Free Statistics

of Irreproducible Research!

Author's title

Author*Unverified author*
R Software Modulerwasp_autocorrelation.wasp
Title produced by software(Partial) Autocorrelation Function
Date of computationTue, 10 Apr 2012 05:50:28 -0400
Cite this page as followsStatistical Computations at FreeStatistics.org, Office for Research Development and Education, URL https://freestatistics.org/blog/index.php?v=date/2012/Apr/10/t1334051766ofywnftdf6yqj2o.htm/, Retrieved Sun, 28 Apr 2024 13:16:25 +0000
Statistical Computations at FreeStatistics.org, Office for Research Development and Education, URL https://freestatistics.org/blog/index.php?pk=164341, Retrieved Sun, 28 Apr 2024 13:16:25 +0000
QR Codes:

Original text written by user:
IsPrivate?No (this computation is public)
User-defined keywordsKDGP2W12
Estimated Impact189
Family? (F = Feedback message, R = changed R code, M = changed R Module, P = changed Parameters, D = changed Data)
-       [(Partial) Autocorrelation Function] [Autocorrelatie (t...] [2012-04-10 09:50:28] [ef02148344264346fe23a57cc665e979] [Current]
Feedback Forum

Post a new message
Dataseries X:
78,7
75,7
77,1
86,1
86,8
86,3
91,5
90,7
78,2
73
73,7
77,3
67,5
72,7
76,6
82,4
82,3
86,3
93
88,8
96,9
103,9
115,7
112,8
114,7
118
129,3
137
156
166,2
167,8
144,3
126
90,4
67,5
52,4
54,6
52,9
59,1
63,3
73,8
87,6
81,8
90,7
86,3
93,6
98
94,3
97,6
94,2
100,2
106,7
95,7
94,6
94,7
96,2
96,3
103,3
106,8
113,7
117,4
123,6
137,6
147,4
137,2
133,8
136,7
127,3
128,7
127
133,7
132


Summary of computational transaction
Raw Inputview raw input (R code)
Raw Outputview raw output of R engine
Computing time1 seconds
R Server'Herman Ole Andreas Wold' @ wold.wessa.net

\begin{tabular}{lllllllll}
\hline
Summary of computational transaction \tabularnewline
Raw Input & view raw input (R code)  \tabularnewline
Raw Output & view raw output of R engine  \tabularnewline
Computing time & 1 seconds \tabularnewline
R Server & 'Herman Ole Andreas Wold' @ wold.wessa.net \tabularnewline
\hline
\end{tabular}
%Source: https://freestatistics.org/blog/index.php?pk=164341&T=0

[TABLE]
[ROW][C]Summary of computational transaction[/C][/ROW]
[ROW][C]Raw Input[/C][C]view raw input (R code) [/C][/ROW]
[ROW][C]Raw Output[/C][C]view raw output of R engine [/C][/ROW]
[ROW][C]Computing time[/C][C]1 seconds[/C][/ROW]
[ROW][C]R Server[/C][C]'Herman Ole Andreas Wold' @ wold.wessa.net[/C][/ROW]
[/TABLE]
Source: https://freestatistics.org/blog/index.php?pk=164341&T=0

Globally Unique Identifier (entire table): ba.freestatistics.org/blog/index.php?pk=164341&T=0

As an alternative you can also use a QR Code:  

The GUIDs for individual cells are displayed in the table below:

Summary of computational transaction
Raw Inputview raw input (R code)
Raw Outputview raw output of R engine
Computing time1 seconds
R Server'Herman Ole Andreas Wold' @ wold.wessa.net


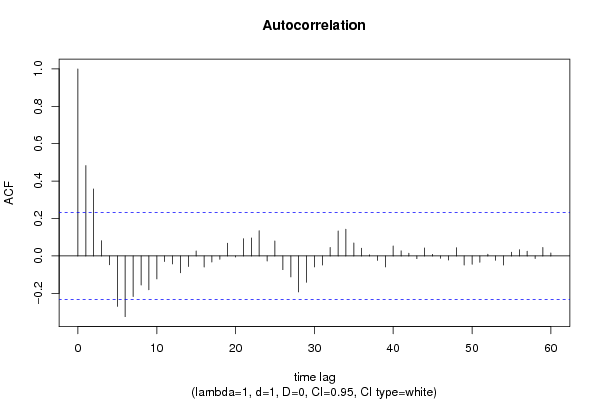
Autocorrelation Function
Time lag kACF(k)T-STATP-value
10.483144.0716e-05
20.3579953.01650.001773
30.0812460.68460.247915
4-0.047516-0.40040.345041
5-0.269854-2.27380.013001
6-0.324768-2.73650.003919
7-0.217364-1.83150.035607
8-0.155133-1.30720.097686
9-0.181008-1.52520.065826
10-0.122726-1.03410.152297
11-0.030294-0.25530.399631
12-0.042723-0.360.359963
13-0.089925-0.75770.225563
14-0.056918-0.47960.316495
150.0268580.22630.410804
16-0.059624-0.50240.30847
17-0.032548-0.27430.392343
18-0.017977-0.15150.440013
190.0680120.57310.284201
20-0.006009-0.05060.479879
210.0918560.7740.220753
220.0956860.80630.211391
230.1344611.1330.130515
24-0.027079-0.22820.410085
250.0796110.67080.252258
26-0.073389-0.61840.269151
27-0.112165-0.94510.173902
28-0.192368-1.62090.054734
29-0.140555-1.18430.120115
30-0.058616-0.49390.311449
31-0.048198-0.40610.342938
320.0449930.37910.352865
330.1329781.12050.13314
340.1426861.20230.116622
350.0692260.58330.280768
360.0409890.34540.365414
370.0058260.04910.480492
38-0.023659-0.19940.421277
39-0.05848-0.49280.311852
400.052910.44580.328538
410.0272190.22940.409627
420.0140270.11820.453122
43-0.014401-0.12130.451879
440.0420380.35420.362112
450.008540.0720.471418
46-0.012389-0.10440.458576
47-0.021857-0.18420.427204
480.0437240.36840.356825
49-0.048379-0.40760.342379
50-0.044292-0.37320.35505
51-0.033512-0.28240.389239
520.0089640.07550.470003
53-0.022847-0.19250.423945
54-0.048661-0.410.341511
550.0194940.16430.434998
560.0333340.28090.389812
570.0250490.21110.41672
58-0.013448-0.11330.45505
590.0452780.38150.351979
600.0157090.13240.447534

\begin{tabular}{lllllllll}
\hline
Autocorrelation Function \tabularnewline
Time lag k & ACF(k) & T-STAT & P-value \tabularnewline
1 & 0.48314 & 4.071 & 6e-05 \tabularnewline
2 & 0.357995 & 3.0165 & 0.001773 \tabularnewline
3 & 0.081246 & 0.6846 & 0.247915 \tabularnewline
4 & -0.047516 & -0.4004 & 0.345041 \tabularnewline
5 & -0.269854 & -2.2738 & 0.013001 \tabularnewline
6 & -0.324768 & -2.7365 & 0.003919 \tabularnewline
7 & -0.217364 & -1.8315 & 0.035607 \tabularnewline
8 & -0.155133 & -1.3072 & 0.097686 \tabularnewline
9 & -0.181008 & -1.5252 & 0.065826 \tabularnewline
10 & -0.122726 & -1.0341 & 0.152297 \tabularnewline
11 & -0.030294 & -0.2553 & 0.399631 \tabularnewline
12 & -0.042723 & -0.36 & 0.359963 \tabularnewline
13 & -0.089925 & -0.7577 & 0.225563 \tabularnewline
14 & -0.056918 & -0.4796 & 0.316495 \tabularnewline
15 & 0.026858 & 0.2263 & 0.410804 \tabularnewline
16 & -0.059624 & -0.5024 & 0.30847 \tabularnewline
17 & -0.032548 & -0.2743 & 0.392343 \tabularnewline
18 & -0.017977 & -0.1515 & 0.440013 \tabularnewline
19 & 0.068012 & 0.5731 & 0.284201 \tabularnewline
20 & -0.006009 & -0.0506 & 0.479879 \tabularnewline
21 & 0.091856 & 0.774 & 0.220753 \tabularnewline
22 & 0.095686 & 0.8063 & 0.211391 \tabularnewline
23 & 0.134461 & 1.133 & 0.130515 \tabularnewline
24 & -0.027079 & -0.2282 & 0.410085 \tabularnewline
25 & 0.079611 & 0.6708 & 0.252258 \tabularnewline
26 & -0.073389 & -0.6184 & 0.269151 \tabularnewline
27 & -0.112165 & -0.9451 & 0.173902 \tabularnewline
28 & -0.192368 & -1.6209 & 0.054734 \tabularnewline
29 & -0.140555 & -1.1843 & 0.120115 \tabularnewline
30 & -0.058616 & -0.4939 & 0.311449 \tabularnewline
31 & -0.048198 & -0.4061 & 0.342938 \tabularnewline
32 & 0.044993 & 0.3791 & 0.352865 \tabularnewline
33 & 0.132978 & 1.1205 & 0.13314 \tabularnewline
34 & 0.142686 & 1.2023 & 0.116622 \tabularnewline
35 & 0.069226 & 0.5833 & 0.280768 \tabularnewline
36 & 0.040989 & 0.3454 & 0.365414 \tabularnewline
37 & 0.005826 & 0.0491 & 0.480492 \tabularnewline
38 & -0.023659 & -0.1994 & 0.421277 \tabularnewline
39 & -0.05848 & -0.4928 & 0.311852 \tabularnewline
40 & 0.05291 & 0.4458 & 0.328538 \tabularnewline
41 & 0.027219 & 0.2294 & 0.409627 \tabularnewline
42 & 0.014027 & 0.1182 & 0.453122 \tabularnewline
43 & -0.014401 & -0.1213 & 0.451879 \tabularnewline
44 & 0.042038 & 0.3542 & 0.362112 \tabularnewline
45 & 0.00854 & 0.072 & 0.471418 \tabularnewline
46 & -0.012389 & -0.1044 & 0.458576 \tabularnewline
47 & -0.021857 & -0.1842 & 0.427204 \tabularnewline
48 & 0.043724 & 0.3684 & 0.356825 \tabularnewline
49 & -0.048379 & -0.4076 & 0.342379 \tabularnewline
50 & -0.044292 & -0.3732 & 0.35505 \tabularnewline
51 & -0.033512 & -0.2824 & 0.389239 \tabularnewline
52 & 0.008964 & 0.0755 & 0.470003 \tabularnewline
53 & -0.022847 & -0.1925 & 0.423945 \tabularnewline
54 & -0.048661 & -0.41 & 0.341511 \tabularnewline
55 & 0.019494 & 0.1643 & 0.434998 \tabularnewline
56 & 0.033334 & 0.2809 & 0.389812 \tabularnewline
57 & 0.025049 & 0.2111 & 0.41672 \tabularnewline
58 & -0.013448 & -0.1133 & 0.45505 \tabularnewline
59 & 0.045278 & 0.3815 & 0.351979 \tabularnewline
60 & 0.015709 & 0.1324 & 0.447534 \tabularnewline
\hline
\end{tabular}
%Source: https://freestatistics.org/blog/index.php?pk=164341&T=1

[TABLE]
[ROW][C]Autocorrelation Function[/C][/ROW]
[ROW][C]Time lag k[/C][C]ACF(k)[/C][C]T-STAT[/C][C]P-value[/C][/ROW]
[ROW][C]1[/C][C]0.48314[/C][C]4.071[/C][C]6e-05[/C][/ROW]
[ROW][C]2[/C][C]0.357995[/C][C]3.0165[/C][C]0.001773[/C][/ROW]
[ROW][C]3[/C][C]0.081246[/C][C]0.6846[/C][C]0.247915[/C][/ROW]
[ROW][C]4[/C][C]-0.047516[/C][C]-0.4004[/C][C]0.345041[/C][/ROW]
[ROW][C]5[/C][C]-0.269854[/C][C]-2.2738[/C][C]0.013001[/C][/ROW]
[ROW][C]6[/C][C]-0.324768[/C][C]-2.7365[/C][C]0.003919[/C][/ROW]
[ROW][C]7[/C][C]-0.217364[/C][C]-1.8315[/C][C]0.035607[/C][/ROW]
[ROW][C]8[/C][C]-0.155133[/C][C]-1.3072[/C][C]0.097686[/C][/ROW]
[ROW][C]9[/C][C]-0.181008[/C][C]-1.5252[/C][C]0.065826[/C][/ROW]
[ROW][C]10[/C][C]-0.122726[/C][C]-1.0341[/C][C]0.152297[/C][/ROW]
[ROW][C]11[/C][C]-0.030294[/C][C]-0.2553[/C][C]0.399631[/C][/ROW]
[ROW][C]12[/C][C]-0.042723[/C][C]-0.36[/C][C]0.359963[/C][/ROW]
[ROW][C]13[/C][C]-0.089925[/C][C]-0.7577[/C][C]0.225563[/C][/ROW]
[ROW][C]14[/C][C]-0.056918[/C][C]-0.4796[/C][C]0.316495[/C][/ROW]
[ROW][C]15[/C][C]0.026858[/C][C]0.2263[/C][C]0.410804[/C][/ROW]
[ROW][C]16[/C][C]-0.059624[/C][C]-0.5024[/C][C]0.30847[/C][/ROW]
[ROW][C]17[/C][C]-0.032548[/C][C]-0.2743[/C][C]0.392343[/C][/ROW]
[ROW][C]18[/C][C]-0.017977[/C][C]-0.1515[/C][C]0.440013[/C][/ROW]
[ROW][C]19[/C][C]0.068012[/C][C]0.5731[/C][C]0.284201[/C][/ROW]
[ROW][C]20[/C][C]-0.006009[/C][C]-0.0506[/C][C]0.479879[/C][/ROW]
[ROW][C]21[/C][C]0.091856[/C][C]0.774[/C][C]0.220753[/C][/ROW]
[ROW][C]22[/C][C]0.095686[/C][C]0.8063[/C][C]0.211391[/C][/ROW]
[ROW][C]23[/C][C]0.134461[/C][C]1.133[/C][C]0.130515[/C][/ROW]
[ROW][C]24[/C][C]-0.027079[/C][C]-0.2282[/C][C]0.410085[/C][/ROW]
[ROW][C]25[/C][C]0.079611[/C][C]0.6708[/C][C]0.252258[/C][/ROW]
[ROW][C]26[/C][C]-0.073389[/C][C]-0.6184[/C][C]0.269151[/C][/ROW]
[ROW][C]27[/C][C]-0.112165[/C][C]-0.9451[/C][C]0.173902[/C][/ROW]
[ROW][C]28[/C][C]-0.192368[/C][C]-1.6209[/C][C]0.054734[/C][/ROW]
[ROW][C]29[/C][C]-0.140555[/C][C]-1.1843[/C][C]0.120115[/C][/ROW]
[ROW][C]30[/C][C]-0.058616[/C][C]-0.4939[/C][C]0.311449[/C][/ROW]
[ROW][C]31[/C][C]-0.048198[/C][C]-0.4061[/C][C]0.342938[/C][/ROW]
[ROW][C]32[/C][C]0.044993[/C][C]0.3791[/C][C]0.352865[/C][/ROW]
[ROW][C]33[/C][C]0.132978[/C][C]1.1205[/C][C]0.13314[/C][/ROW]
[ROW][C]34[/C][C]0.142686[/C][C]1.2023[/C][C]0.116622[/C][/ROW]
[ROW][C]35[/C][C]0.069226[/C][C]0.5833[/C][C]0.280768[/C][/ROW]
[ROW][C]36[/C][C]0.040989[/C][C]0.3454[/C][C]0.365414[/C][/ROW]
[ROW][C]37[/C][C]0.005826[/C][C]0.0491[/C][C]0.480492[/C][/ROW]
[ROW][C]38[/C][C]-0.023659[/C][C]-0.1994[/C][C]0.421277[/C][/ROW]
[ROW][C]39[/C][C]-0.05848[/C][C]-0.4928[/C][C]0.311852[/C][/ROW]
[ROW][C]40[/C][C]0.05291[/C][C]0.4458[/C][C]0.328538[/C][/ROW]
[ROW][C]41[/C][C]0.027219[/C][C]0.2294[/C][C]0.409627[/C][/ROW]
[ROW][C]42[/C][C]0.014027[/C][C]0.1182[/C][C]0.453122[/C][/ROW]
[ROW][C]43[/C][C]-0.014401[/C][C]-0.1213[/C][C]0.451879[/C][/ROW]
[ROW][C]44[/C][C]0.042038[/C][C]0.3542[/C][C]0.362112[/C][/ROW]
[ROW][C]45[/C][C]0.00854[/C][C]0.072[/C][C]0.471418[/C][/ROW]
[ROW][C]46[/C][C]-0.012389[/C][C]-0.1044[/C][C]0.458576[/C][/ROW]
[ROW][C]47[/C][C]-0.021857[/C][C]-0.1842[/C][C]0.427204[/C][/ROW]
[ROW][C]48[/C][C]0.043724[/C][C]0.3684[/C][C]0.356825[/C][/ROW]
[ROW][C]49[/C][C]-0.048379[/C][C]-0.4076[/C][C]0.342379[/C][/ROW]
[ROW][C]50[/C][C]-0.044292[/C][C]-0.3732[/C][C]0.35505[/C][/ROW]
[ROW][C]51[/C][C]-0.033512[/C][C]-0.2824[/C][C]0.389239[/C][/ROW]
[ROW][C]52[/C][C]0.008964[/C][C]0.0755[/C][C]0.470003[/C][/ROW]
[ROW][C]53[/C][C]-0.022847[/C][C]-0.1925[/C][C]0.423945[/C][/ROW]
[ROW][C]54[/C][C]-0.048661[/C][C]-0.41[/C][C]0.341511[/C][/ROW]
[ROW][C]55[/C][C]0.019494[/C][C]0.1643[/C][C]0.434998[/C][/ROW]
[ROW][C]56[/C][C]0.033334[/C][C]0.2809[/C][C]0.389812[/C][/ROW]
[ROW][C]57[/C][C]0.025049[/C][C]0.2111[/C][C]0.41672[/C][/ROW]
[ROW][C]58[/C][C]-0.013448[/C][C]-0.1133[/C][C]0.45505[/C][/ROW]
[ROW][C]59[/C][C]0.045278[/C][C]0.3815[/C][C]0.351979[/C][/ROW]
[ROW][C]60[/C][C]0.015709[/C][C]0.1324[/C][C]0.447534[/C][/ROW]
[/TABLE]
Source: https://freestatistics.org/blog/index.php?pk=164341&T=1

Globally Unique Identifier (entire table): ba.freestatistics.org/blog/index.php?pk=164341&T=1

As an alternative you can also use a QR Code:  

The GUIDs for individual cells are displayed in the table below:

Autocorrelation Function
Time lag kACF(k)T-STATP-value
10.483144.0716e-05
20.3579953.01650.001773
30.0812460.68460.247915
4-0.047516-0.40040.345041
5-0.269854-2.27380.013001
6-0.324768-2.73650.003919
7-0.217364-1.83150.035607
8-0.155133-1.30720.097686
9-0.181008-1.52520.065826
10-0.122726-1.03410.152297
11-0.030294-0.25530.399631
12-0.042723-0.360.359963
13-0.089925-0.75770.225563
14-0.056918-0.47960.316495
150.0268580.22630.410804
16-0.059624-0.50240.30847
17-0.032548-0.27430.392343
18-0.017977-0.15150.440013
190.0680120.57310.284201
20-0.006009-0.05060.479879
210.0918560.7740.220753
220.0956860.80630.211391
230.1344611.1330.130515
24-0.027079-0.22820.410085
250.0796110.67080.252258
26-0.073389-0.61840.269151
27-0.112165-0.94510.173902
28-0.192368-1.62090.054734
29-0.140555-1.18430.120115
30-0.058616-0.49390.311449
31-0.048198-0.40610.342938
320.0449930.37910.352865
330.1329781.12050.13314
340.1426861.20230.116622
350.0692260.58330.280768
360.0409890.34540.365414
370.0058260.04910.480492
38-0.023659-0.19940.421277
39-0.05848-0.49280.311852
400.052910.44580.328538
410.0272190.22940.409627
420.0140270.11820.453122
43-0.014401-0.12130.451879
440.0420380.35420.362112
450.008540.0720.471418
46-0.012389-0.10440.458576
47-0.021857-0.18420.427204
480.0437240.36840.356825
49-0.048379-0.40760.342379
50-0.044292-0.37320.35505
51-0.033512-0.28240.389239
520.0089640.07550.470003
53-0.022847-0.19250.423945
54-0.048661-0.410.341511
550.0194940.16430.434998
560.0333340.28090.389812
570.0250490.21110.41672
58-0.013448-0.11330.45505
590.0452780.38150.351979
600.0157090.13240.447534


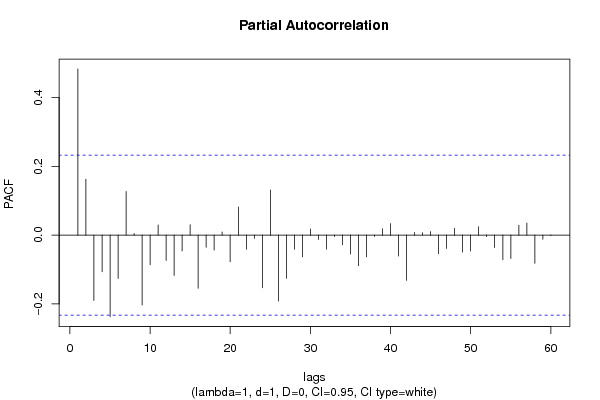
Partial Autocorrelation Function
Time lag kPACF(k)T-STATP-value
10.483144.0716e-05
20.1625041.36930.087614
3-0.190425-1.60460.056516
4-0.106583-0.89810.186088
5-0.237116-1.9980.024776
6-0.125899-1.06080.146177
70.1267831.06830.144505
80.0046420.03910.484455
9-0.203363-1.71360.045486
10-0.086234-0.72660.234925
110.0292880.24680.402895
12-0.073957-0.62320.267585
13-0.117143-0.98710.163481
14-0.045919-0.38690.349988
150.0300270.2530.400495
16-0.154327-1.30040.098838
17-0.035251-0.2970.383656
18-0.043442-0.36610.357707
190.0092870.07830.468924
20-0.077359-0.65180.258306
210.0818090.68930.246431
22-0.040954-0.34510.365525
23-0.009454-0.07970.468367
24-0.152982-1.28910.100782
250.1307341.10160.137182
26-0.191878-1.61680.055179
27-0.125358-1.05630.147209
28-0.041094-0.34630.365084
29-0.063109-0.53180.298273
300.0176140.14840.441218
31-0.012603-0.10620.457863
32-0.040723-0.34310.366255
33-0.004354-0.03670.485417
34-0.02802-0.23610.407018
35-0.055101-0.46430.32193
36-0.089099-0.75080.227639
37-0.063134-0.5320.2982
38-0.004159-0.0350.486072
390.0184480.15540.438455
400.0334540.28190.389423
41-0.060846-0.51270.304876
42-0.13177-1.11030.135306
430.0075060.06320.474874
440.0068620.05780.477027
450.0102190.08610.465813
46-0.054307-0.45760.324318
47-0.038925-0.3280.371944
480.0197110.16610.434279
49-0.049607-0.4180.338605
50-0.046474-0.39160.348266
510.0241710.20370.419599
52-0.004368-0.03680.485371
53-0.036239-0.30540.380496
54-0.071601-0.60330.274108
55-0.067982-0.57280.284285
560.028940.24390.404025
570.0349270.29430.384694
58-0.081876-0.68990.246254
59-0.012302-0.10370.458867
60-0.001631-0.01370.494537

\begin{tabular}{lllllllll}
\hline
Partial Autocorrelation Function \tabularnewline
Time lag k & PACF(k) & T-STAT & P-value \tabularnewline
1 & 0.48314 & 4.071 & 6e-05 \tabularnewline
2 & 0.162504 & 1.3693 & 0.087614 \tabularnewline
3 & -0.190425 & -1.6046 & 0.056516 \tabularnewline
4 & -0.106583 & -0.8981 & 0.186088 \tabularnewline
5 & -0.237116 & -1.998 & 0.024776 \tabularnewline
6 & -0.125899 & -1.0608 & 0.146177 \tabularnewline
7 & 0.126783 & 1.0683 & 0.144505 \tabularnewline
8 & 0.004642 & 0.0391 & 0.484455 \tabularnewline
9 & -0.203363 & -1.7136 & 0.045486 \tabularnewline
10 & -0.086234 & -0.7266 & 0.234925 \tabularnewline
11 & 0.029288 & 0.2468 & 0.402895 \tabularnewline
12 & -0.073957 & -0.6232 & 0.267585 \tabularnewline
13 & -0.117143 & -0.9871 & 0.163481 \tabularnewline
14 & -0.045919 & -0.3869 & 0.349988 \tabularnewline
15 & 0.030027 & 0.253 & 0.400495 \tabularnewline
16 & -0.154327 & -1.3004 & 0.098838 \tabularnewline
17 & -0.035251 & -0.297 & 0.383656 \tabularnewline
18 & -0.043442 & -0.3661 & 0.357707 \tabularnewline
19 & 0.009287 & 0.0783 & 0.468924 \tabularnewline
20 & -0.077359 & -0.6518 & 0.258306 \tabularnewline
21 & 0.081809 & 0.6893 & 0.246431 \tabularnewline
22 & -0.040954 & -0.3451 & 0.365525 \tabularnewline
23 & -0.009454 & -0.0797 & 0.468367 \tabularnewline
24 & -0.152982 & -1.2891 & 0.100782 \tabularnewline
25 & 0.130734 & 1.1016 & 0.137182 \tabularnewline
26 & -0.191878 & -1.6168 & 0.055179 \tabularnewline
27 & -0.125358 & -1.0563 & 0.147209 \tabularnewline
28 & -0.041094 & -0.3463 & 0.365084 \tabularnewline
29 & -0.063109 & -0.5318 & 0.298273 \tabularnewline
30 & 0.017614 & 0.1484 & 0.441218 \tabularnewline
31 & -0.012603 & -0.1062 & 0.457863 \tabularnewline
32 & -0.040723 & -0.3431 & 0.366255 \tabularnewline
33 & -0.004354 & -0.0367 & 0.485417 \tabularnewline
34 & -0.02802 & -0.2361 & 0.407018 \tabularnewline
35 & -0.055101 & -0.4643 & 0.32193 \tabularnewline
36 & -0.089099 & -0.7508 & 0.227639 \tabularnewline
37 & -0.063134 & -0.532 & 0.2982 \tabularnewline
38 & -0.004159 & -0.035 & 0.486072 \tabularnewline
39 & 0.018448 & 0.1554 & 0.438455 \tabularnewline
40 & 0.033454 & 0.2819 & 0.389423 \tabularnewline
41 & -0.060846 & -0.5127 & 0.304876 \tabularnewline
42 & -0.13177 & -1.1103 & 0.135306 \tabularnewline
43 & 0.007506 & 0.0632 & 0.474874 \tabularnewline
44 & 0.006862 & 0.0578 & 0.477027 \tabularnewline
45 & 0.010219 & 0.0861 & 0.465813 \tabularnewline
46 & -0.054307 & -0.4576 & 0.324318 \tabularnewline
47 & -0.038925 & -0.328 & 0.371944 \tabularnewline
48 & 0.019711 & 0.1661 & 0.434279 \tabularnewline
49 & -0.049607 & -0.418 & 0.338605 \tabularnewline
50 & -0.046474 & -0.3916 & 0.348266 \tabularnewline
51 & 0.024171 & 0.2037 & 0.419599 \tabularnewline
52 & -0.004368 & -0.0368 & 0.485371 \tabularnewline
53 & -0.036239 & -0.3054 & 0.380496 \tabularnewline
54 & -0.071601 & -0.6033 & 0.274108 \tabularnewline
55 & -0.067982 & -0.5728 & 0.284285 \tabularnewline
56 & 0.02894 & 0.2439 & 0.404025 \tabularnewline
57 & 0.034927 & 0.2943 & 0.384694 \tabularnewline
58 & -0.081876 & -0.6899 & 0.246254 \tabularnewline
59 & -0.012302 & -0.1037 & 0.458867 \tabularnewline
60 & -0.001631 & -0.0137 & 0.494537 \tabularnewline
\hline
\end{tabular}
%Source: https://freestatistics.org/blog/index.php?pk=164341&T=2

[TABLE]
[ROW][C]Partial Autocorrelation Function[/C][/ROW]
[ROW][C]Time lag k[/C][C]PACF(k)[/C][C]T-STAT[/C][C]P-value[/C][/ROW]
[ROW][C]1[/C][C]0.48314[/C][C]4.071[/C][C]6e-05[/C][/ROW]
[ROW][C]2[/C][C]0.162504[/C][C]1.3693[/C][C]0.087614[/C][/ROW]
[ROW][C]3[/C][C]-0.190425[/C][C]-1.6046[/C][C]0.056516[/C][/ROW]
[ROW][C]4[/C][C]-0.106583[/C][C]-0.8981[/C][C]0.186088[/C][/ROW]
[ROW][C]5[/C][C]-0.237116[/C][C]-1.998[/C][C]0.024776[/C][/ROW]
[ROW][C]6[/C][C]-0.125899[/C][C]-1.0608[/C][C]0.146177[/C][/ROW]
[ROW][C]7[/C][C]0.126783[/C][C]1.0683[/C][C]0.144505[/C][/ROW]
[ROW][C]8[/C][C]0.004642[/C][C]0.0391[/C][C]0.484455[/C][/ROW]
[ROW][C]9[/C][C]-0.203363[/C][C]-1.7136[/C][C]0.045486[/C][/ROW]
[ROW][C]10[/C][C]-0.086234[/C][C]-0.7266[/C][C]0.234925[/C][/ROW]
[ROW][C]11[/C][C]0.029288[/C][C]0.2468[/C][C]0.402895[/C][/ROW]
[ROW][C]12[/C][C]-0.073957[/C][C]-0.6232[/C][C]0.267585[/C][/ROW]
[ROW][C]13[/C][C]-0.117143[/C][C]-0.9871[/C][C]0.163481[/C][/ROW]
[ROW][C]14[/C][C]-0.045919[/C][C]-0.3869[/C][C]0.349988[/C][/ROW]
[ROW][C]15[/C][C]0.030027[/C][C]0.253[/C][C]0.400495[/C][/ROW]
[ROW][C]16[/C][C]-0.154327[/C][C]-1.3004[/C][C]0.098838[/C][/ROW]
[ROW][C]17[/C][C]-0.035251[/C][C]-0.297[/C][C]0.383656[/C][/ROW]
[ROW][C]18[/C][C]-0.043442[/C][C]-0.3661[/C][C]0.357707[/C][/ROW]
[ROW][C]19[/C][C]0.009287[/C][C]0.0783[/C][C]0.468924[/C][/ROW]
[ROW][C]20[/C][C]-0.077359[/C][C]-0.6518[/C][C]0.258306[/C][/ROW]
[ROW][C]21[/C][C]0.081809[/C][C]0.6893[/C][C]0.246431[/C][/ROW]
[ROW][C]22[/C][C]-0.040954[/C][C]-0.3451[/C][C]0.365525[/C][/ROW]
[ROW][C]23[/C][C]-0.009454[/C][C]-0.0797[/C][C]0.468367[/C][/ROW]
[ROW][C]24[/C][C]-0.152982[/C][C]-1.2891[/C][C]0.100782[/C][/ROW]
[ROW][C]25[/C][C]0.130734[/C][C]1.1016[/C][C]0.137182[/C][/ROW]
[ROW][C]26[/C][C]-0.191878[/C][C]-1.6168[/C][C]0.055179[/C][/ROW]
[ROW][C]27[/C][C]-0.125358[/C][C]-1.0563[/C][C]0.147209[/C][/ROW]
[ROW][C]28[/C][C]-0.041094[/C][C]-0.3463[/C][C]0.365084[/C][/ROW]
[ROW][C]29[/C][C]-0.063109[/C][C]-0.5318[/C][C]0.298273[/C][/ROW]
[ROW][C]30[/C][C]0.017614[/C][C]0.1484[/C][C]0.441218[/C][/ROW]
[ROW][C]31[/C][C]-0.012603[/C][C]-0.1062[/C][C]0.457863[/C][/ROW]
[ROW][C]32[/C][C]-0.040723[/C][C]-0.3431[/C][C]0.366255[/C][/ROW]
[ROW][C]33[/C][C]-0.004354[/C][C]-0.0367[/C][C]0.485417[/C][/ROW]
[ROW][C]34[/C][C]-0.02802[/C][C]-0.2361[/C][C]0.407018[/C][/ROW]
[ROW][C]35[/C][C]-0.055101[/C][C]-0.4643[/C][C]0.32193[/C][/ROW]
[ROW][C]36[/C][C]-0.089099[/C][C]-0.7508[/C][C]0.227639[/C][/ROW]
[ROW][C]37[/C][C]-0.063134[/C][C]-0.532[/C][C]0.2982[/C][/ROW]
[ROW][C]38[/C][C]-0.004159[/C][C]-0.035[/C][C]0.486072[/C][/ROW]
[ROW][C]39[/C][C]0.018448[/C][C]0.1554[/C][C]0.438455[/C][/ROW]
[ROW][C]40[/C][C]0.033454[/C][C]0.2819[/C][C]0.389423[/C][/ROW]
[ROW][C]41[/C][C]-0.060846[/C][C]-0.5127[/C][C]0.304876[/C][/ROW]
[ROW][C]42[/C][C]-0.13177[/C][C]-1.1103[/C][C]0.135306[/C][/ROW]
[ROW][C]43[/C][C]0.007506[/C][C]0.0632[/C][C]0.474874[/C][/ROW]
[ROW][C]44[/C][C]0.006862[/C][C]0.0578[/C][C]0.477027[/C][/ROW]
[ROW][C]45[/C][C]0.010219[/C][C]0.0861[/C][C]0.465813[/C][/ROW]
[ROW][C]46[/C][C]-0.054307[/C][C]-0.4576[/C][C]0.324318[/C][/ROW]
[ROW][C]47[/C][C]-0.038925[/C][C]-0.328[/C][C]0.371944[/C][/ROW]
[ROW][C]48[/C][C]0.019711[/C][C]0.1661[/C][C]0.434279[/C][/ROW]
[ROW][C]49[/C][C]-0.049607[/C][C]-0.418[/C][C]0.338605[/C][/ROW]
[ROW][C]50[/C][C]-0.046474[/C][C]-0.3916[/C][C]0.348266[/C][/ROW]
[ROW][C]51[/C][C]0.024171[/C][C]0.2037[/C][C]0.419599[/C][/ROW]
[ROW][C]52[/C][C]-0.004368[/C][C]-0.0368[/C][C]0.485371[/C][/ROW]
[ROW][C]53[/C][C]-0.036239[/C][C]-0.3054[/C][C]0.380496[/C][/ROW]
[ROW][C]54[/C][C]-0.071601[/C][C]-0.6033[/C][C]0.274108[/C][/ROW]
[ROW][C]55[/C][C]-0.067982[/C][C]-0.5728[/C][C]0.284285[/C][/ROW]
[ROW][C]56[/C][C]0.02894[/C][C]0.2439[/C][C]0.404025[/C][/ROW]
[ROW][C]57[/C][C]0.034927[/C][C]0.2943[/C][C]0.384694[/C][/ROW]
[ROW][C]58[/C][C]-0.081876[/C][C]-0.6899[/C][C]0.246254[/C][/ROW]
[ROW][C]59[/C][C]-0.012302[/C][C]-0.1037[/C][C]0.458867[/C][/ROW]
[ROW][C]60[/C][C]-0.001631[/C][C]-0.0137[/C][C]0.494537[/C][/ROW]
[/TABLE]
Source: https://freestatistics.org/blog/index.php?pk=164341&T=2

Globally Unique Identifier (entire table): ba.freestatistics.org/blog/index.php?pk=164341&T=2

As an alternative you can also use a QR Code:  

The GUIDs for individual cells are displayed in the table below:

Partial Autocorrelation Function
Time lag kPACF(k)T-STATP-value
10.483144.0716e-05
20.1625041.36930.087614
3-0.190425-1.60460.056516
4-0.106583-0.89810.186088
5-0.237116-1.9980.024776
6-0.125899-1.06080.146177
70.1267831.06830.144505
80.0046420.03910.484455
9-0.203363-1.71360.045486
10-0.086234-0.72660.234925
110.0292880.24680.402895
12-0.073957-0.62320.267585
13-0.117143-0.98710.163481
14-0.045919-0.38690.349988
150.0300270.2530.400495
16-0.154327-1.30040.098838
17-0.035251-0.2970.383656
18-0.043442-0.36610.357707
190.0092870.07830.468924
20-0.077359-0.65180.258306
210.0818090.68930.246431
22-0.040954-0.34510.365525
23-0.009454-0.07970.468367
24-0.152982-1.28910.100782
250.1307341.10160.137182
26-0.191878-1.61680.055179
27-0.125358-1.05630.147209
28-0.041094-0.34630.365084
29-0.063109-0.53180.298273
300.0176140.14840.441218
31-0.012603-0.10620.457863
32-0.040723-0.34310.366255
33-0.004354-0.03670.485417
34-0.02802-0.23610.407018
35-0.055101-0.46430.32193
36-0.089099-0.75080.227639
37-0.063134-0.5320.2982
38-0.004159-0.0350.486072
390.0184480.15540.438455
400.0334540.28190.389423
41-0.060846-0.51270.304876
42-0.13177-1.11030.135306
430.0075060.06320.474874
440.0068620.05780.477027
450.0102190.08610.465813
46-0.054307-0.45760.324318
47-0.038925-0.3280.371944
480.0197110.16610.434279
49-0.049607-0.4180.338605
50-0.046474-0.39160.348266
510.0241710.20370.419599
52-0.004368-0.03680.485371
53-0.036239-0.30540.380496
54-0.071601-0.60330.274108
55-0.067982-0.57280.284285
560.028940.24390.404025
570.0349270.29430.384694
58-0.081876-0.68990.246254
59-0.012302-0.10370.458867
60-0.001631-0.01370.494537


Parameters (Session):
par1 = 10 ; par2 = 1 ; par3 = 0 ; par4 = 0 ; par5 = 12 ; par6 = White Noise ; par7 = 0.95 ;
Parameters (R input):
par1 = 60 ; par2 = 1 ; par3 = 1 ; par4 = 0 ; par5 = 12 ; par6 = White Noise ; par7 = 0.95 ; par8 = ;
R code (references can be found in the software module):
if (par1 == 'Default') {
par1 = 10*log10(length(x))
} else {
par1 <- as.numeric(par1)
}
par2 <- as.numeric(par2)
par3 <- as.numeric(par3)
par4 <- as.numeric(par4)
par5 <- as.numeric(par5)
if (par6 == 'White Noise') par6 <- 'white' else par6 <- 'ma'
par7 <- as.numeric(par7)
if (par8 != '') par8 <- as.numeric(par8)
ox <- x
if (par8 == '') {
if (par2 == 0) {
x <- log(x)
} else {
x <- (x ^ par2 - 1) / par2
}
} else {
x <- log(x,base=par8)
}
if (par3 > 0) x <- diff(x,lag=1,difference=par3)
if (par4 > 0) x <- diff(x,lag=par5,difference=par4)
bitmap(file='picts.png')
op <- par(mfrow=c(2,1))
plot(ox,type='l',main='Original Time Series',xlab='time',ylab='value')
if (par8=='') {
mytitle <- paste('Working Time Series (lambda=',par2,', d=',par3,', D=',par4,')',sep='')
mysub <- paste('(lambda=',par2,', d=',par3,', D=',par4,', CI=', par7, ', CI type=',par6,')',sep='')
} else {
mytitle <- paste('Working Time Series (base=',par8,', d=',par3,', D=',par4,')',sep='')
mysub <- paste('(base=',par8,', d=',par3,', D=',par4,', CI=', par7, ', CI type=',par6,')',sep='')
}
plot(x,type='l', main=mytitle,xlab='time',ylab='value')
par(op)
dev.off()
bitmap(file='pic1.png')
racf <- acf(x, par1, main='Autocorrelation', xlab='time lag', ylab='ACF', ci.type=par6, ci=par7, sub=mysub)
dev.off()
bitmap(file='pic2.png')
rpacf <- pacf(x,par1,main='Partial Autocorrelation',xlab='lags',ylab='PACF',sub=mysub)
dev.off()
(myacf <- c(racf$acf))
(mypacf <- c(rpacf$acf))
lengthx <- length(x)
sqrtn <- sqrt(lengthx)
load(file='createtable')
a<-table.start()
a<-table.row.start(a)
a<-table.element(a,'Autocorrelation Function',4,TRUE)
a<-table.row.end(a)
a<-table.row.start(a)
a<-table.element(a,'Time lag k',header=TRUE)
a<-table.element(a,hyperlink('basics.htm','ACF(k)','click here for more information about the Autocorrelation Function'),header=TRUE)
a<-table.element(a,'T-STAT',header=TRUE)
a<-table.element(a,'P-value',header=TRUE)
a<-table.row.end(a)
for (i in 2:(par1+1)) {
a<-table.row.start(a)
a<-table.element(a,i-1,header=TRUE)
a<-table.element(a,round(myacf[i],6))
mytstat <- myacf[i]*sqrtn
a<-table.element(a,round(mytstat,4))
a<-table.element(a,round(1-pt(abs(mytstat),lengthx),6))
a<-table.row.end(a)
}
a<-table.end(a)
table.save(a,file='mytable.tab')
a<-table.start()
a<-table.row.start(a)
a<-table.element(a,'Partial Autocorrelation Function',4,TRUE)
a<-table.row.end(a)
a<-table.row.start(a)
a<-table.element(a,'Time lag k',header=TRUE)
a<-table.element(a,hyperlink('basics.htm','PACF(k)','click here for more information about the Partial Autocorrelation Function'),header=TRUE)
a<-table.element(a,'T-STAT',header=TRUE)
a<-table.element(a,'P-value',header=TRUE)
a<-table.row.end(a)
for (i in 1:par1) {
a<-table.row.start(a)
a<-table.element(a,i,header=TRUE)
a<-table.element(a,round(mypacf[i],6))
mytstat <- mypacf[i]*sqrtn
a<-table.element(a,round(mytstat,4))
a<-table.element(a,round(1-pt(abs(mytstat),lengthx),6))
a<-table.row.end(a)
}
a<-table.end(a)
table.save(a,file='mytable1.tab')