Free Statistics

of Irreproducible Research!

Author's title

Author*The author of this computation has been verified*
R Software Modulerwasp_hierarchicalclusteringdm.wasp
Title produced by softwareHierarchical Clustering
Date of computationThu, 26 Apr 2012 08:52:58 -0400
Cite this page as followsStatistical Computations at FreeStatistics.org, Office for Research Development and Education, URL https://freestatistics.org/blog/index.php?v=date/2012/Apr/26/t1335444819z9zhtzen6l36xw7.htm/, Retrieved Sun, 28 Apr 2024 19:14:58 +0000
Statistical Computations at FreeStatistics.org, Office for Research Development and Education, URL https://freestatistics.org/blog/index.php?pk=164896, Retrieved Sun, 28 Apr 2024 19:14:58 +0000
QR Codes:

Original text written by user:
IsPrivate?No (this computation is public)
User-defined keywords
Estimated Impact134
Family? (F = Feedback message, R = changed R code, M = changed R Module, P = changed Parameters, D = changed Data)
-       [Hierarchical Clustering] [] [2012-04-26 12:52:58] [685fae5a377cc1dc51f9f02306b751ce] [Current]
- RMP     [Notched Boxplots] [] [2012-04-29 10:08:19] [729e3e98c2c68b03161978d53cee5b12]
- RMP     [Notched Boxplots] [] [2012-04-29 10:08:55] [729e3e98c2c68b03161978d53cee5b12]
-   P     [Hierarchical Clustering] [] [2012-04-29 11:43:34] [729e3e98c2c68b03161978d53cee5b12]
-   P     [Hierarchical Clustering] [] [2012-04-29 11:44:30] [729e3e98c2c68b03161978d53cee5b12]
Feedback Forum

Post a new message


Summary of computational transaction
Raw Inputview raw input (R code)
Raw Outputview raw output of R engine
Computing time1 seconds
R Server'Herman Ole Andreas Wold' @ wold.wessa.net

\begin{tabular}{lllllllll}
\hline
Summary of computational transaction \tabularnewline
Raw Input & view raw input (R code)  \tabularnewline
Raw Output & view raw output of R engine  \tabularnewline
Computing time & 1 seconds \tabularnewline
R Server & 'Herman Ole Andreas Wold' @ wold.wessa.net \tabularnewline
\hline
\end{tabular}
%Source: https://freestatistics.org/blog/index.php?pk=164896&T=0

[TABLE]
[ROW][C]Summary of computational transaction[/C][/ROW]
[ROW][C]Raw Input[/C][C]view raw input (R code) [/C][/ROW]
[ROW][C]Raw Output[/C][C]view raw output of R engine [/C][/ROW]
[ROW][C]Computing time[/C][C]1 seconds[/C][/ROW]
[ROW][C]R Server[/C][C]'Herman Ole Andreas Wold' @ wold.wessa.net[/C][/ROW]
[/TABLE]
Source: https://freestatistics.org/blog/index.php?pk=164896&T=0

Globally Unique Identifier (entire table): ba.freestatistics.org/blog/index.php?pk=164896&T=0

As an alternative you can also use a QR Code:  

The GUIDs for individual cells are displayed in the table below:

Summary of computational transaction
Raw Inputview raw input (R code)
Raw Outputview raw output of R engine
Computing time1 seconds
R Server'Herman Ole Andreas Wold' @ wold.wessa.net


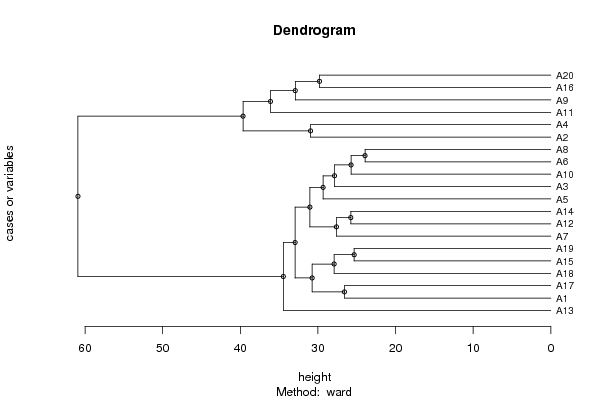
Summary of Dendrogram
LabelHeight
A123.9374184071716
A225.3377189186399
A325.7302673011139
A425.7681974534503
A526.5894716006167
A627.6181535413792
A727.8684902482867
A827.9125106173163
A929.3383215454546
A1029.7993288515027
A1130.7447323021374
A1230.9515750810843
A1331.0378973887688
A1432.9181743036563
A1532.9411535971756
A1634.4546986248259
A1736.1122015126471
A1839.6479379381789
A1960.9120452260654

\begin{tabular}{lllllllll}
\hline
Summary of Dendrogram \tabularnewline
Label & Height \tabularnewline
A1 & 23.9374184071716 \tabularnewline
A2 & 25.3377189186399 \tabularnewline
A3 & 25.7302673011139 \tabularnewline
A4 & 25.7681974534503 \tabularnewline
A5 & 26.5894716006167 \tabularnewline
A6 & 27.6181535413792 \tabularnewline
A7 & 27.8684902482867 \tabularnewline
A8 & 27.9125106173163 \tabularnewline
A9 & 29.3383215454546 \tabularnewline
A10 & 29.7993288515027 \tabularnewline
A11 & 30.7447323021374 \tabularnewline
A12 & 30.9515750810843 \tabularnewline
A13 & 31.0378973887688 \tabularnewline
A14 & 32.9181743036563 \tabularnewline
A15 & 32.9411535971756 \tabularnewline
A16 & 34.4546986248259 \tabularnewline
A17 & 36.1122015126471 \tabularnewline
A18 & 39.6479379381789 \tabularnewline
A19 & 60.9120452260654 \tabularnewline
\hline
\end{tabular}
%Source: https://freestatistics.org/blog/index.php?pk=164896&T=1

[TABLE]
[ROW][C]Summary of Dendrogram[/C][/ROW]
[ROW][C]Label[/C][C]Height[/C][/ROW]
[ROW][C]A1[/C][C]23.9374184071716[/C][/ROW]
[ROW][C]A2[/C][C]25.3377189186399[/C][/ROW]
[ROW][C]A3[/C][C]25.7302673011139[/C][/ROW]
[ROW][C]A4[/C][C]25.7681974534503[/C][/ROW]
[ROW][C]A5[/C][C]26.5894716006167[/C][/ROW]
[ROW][C]A6[/C][C]27.6181535413792[/C][/ROW]
[ROW][C]A7[/C][C]27.8684902482867[/C][/ROW]
[ROW][C]A8[/C][C]27.9125106173163[/C][/ROW]
[ROW][C]A9[/C][C]29.3383215454546[/C][/ROW]
[ROW][C]A10[/C][C]29.7993288515027[/C][/ROW]
[ROW][C]A11[/C][C]30.7447323021374[/C][/ROW]
[ROW][C]A12[/C][C]30.9515750810843[/C][/ROW]
[ROW][C]A13[/C][C]31.0378973887688[/C][/ROW]
[ROW][C]A14[/C][C]32.9181743036563[/C][/ROW]
[ROW][C]A15[/C][C]32.9411535971756[/C][/ROW]
[ROW][C]A16[/C][C]34.4546986248259[/C][/ROW]
[ROW][C]A17[/C][C]36.1122015126471[/C][/ROW]
[ROW][C]A18[/C][C]39.6479379381789[/C][/ROW]
[ROW][C]A19[/C][C]60.9120452260654[/C][/ROW]
[/TABLE]
Source: https://freestatistics.org/blog/index.php?pk=164896&T=1

Globally Unique Identifier (entire table): ba.freestatistics.org/blog/index.php?pk=164896&T=1

As an alternative you can also use a QR Code:  

The GUIDs for individual cells are displayed in the table below:

Summary of Dendrogram
LabelHeight
A123.9374184071716
A225.3377189186399
A325.7302673011139
A425.7681974534503
A526.5894716006167
A627.6181535413792
A727.8684902482867
A827.9125106173163
A929.3383215454546
A1029.7993288515027
A1130.7447323021374
A1230.9515750810843
A1331.0378973887688
A1432.9181743036563
A1532.9411535971756
A1634.4546986248259
A1736.1122015126471
A1839.6479379381789
A1960.9120452260654


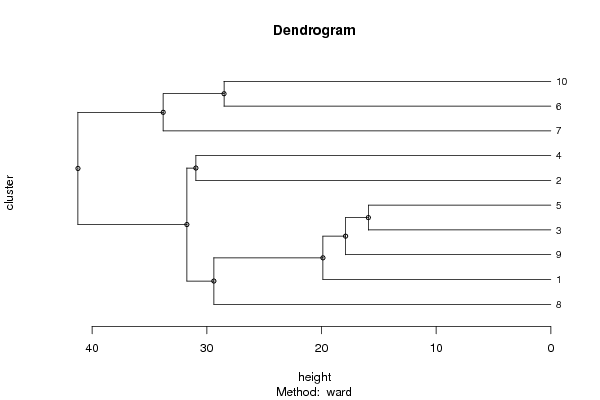
Summary of Cut Dendrogram
LabelHeight
115.9121197693945
217.8981264243742
319.871473857149
428.49561369755
529.3834551930915
630.9515750810843
731.7364676234147
833.8007421652764
941.2325646087353

\begin{tabular}{lllllllll}
\hline
Summary of Cut Dendrogram \tabularnewline
Label & Height \tabularnewline
1 & 15.9121197693945 \tabularnewline
2 & 17.8981264243742 \tabularnewline
3 & 19.871473857149 \tabularnewline
4 & 28.49561369755 \tabularnewline
5 & 29.3834551930915 \tabularnewline
6 & 30.9515750810843 \tabularnewline
7 & 31.7364676234147 \tabularnewline
8 & 33.8007421652764 \tabularnewline
9 & 41.2325646087353 \tabularnewline
\hline
\end{tabular}
%Source: https://freestatistics.org/blog/index.php?pk=164896&T=2

[TABLE]
[ROW][C]Summary of Cut Dendrogram[/C][/ROW]
[ROW][C]Label[/C][C]Height[/C][/ROW]
[ROW][C]1[/C][C]15.9121197693945[/C][/ROW]
[ROW][C]2[/C][C]17.8981264243742[/C][/ROW]
[ROW][C]3[/C][C]19.871473857149[/C][/ROW]
[ROW][C]4[/C][C]28.49561369755[/C][/ROW]
[ROW][C]5[/C][C]29.3834551930915[/C][/ROW]
[ROW][C]6[/C][C]30.9515750810843[/C][/ROW]
[ROW][C]7[/C][C]31.7364676234147[/C][/ROW]
[ROW][C]8[/C][C]33.8007421652764[/C][/ROW]
[ROW][C]9[/C][C]41.2325646087353[/C][/ROW]
[/TABLE]
Source: https://freestatistics.org/blog/index.php?pk=164896&T=2

Globally Unique Identifier (entire table): ba.freestatistics.org/blog/index.php?pk=164896&T=2

As an alternative you can also use a QR Code:  

The GUIDs for individual cells are displayed in the table below:

Summary of Cut Dendrogram
LabelHeight
115.9121197693945
217.8981264243742
319.871473857149
428.49561369755
529.3834551930915
630.9515750810843
731.7364676234147
833.8007421652764
941.2325646087353


Parameters (Session):
par1 = ward ; par2 = 10 ; par3 = TRUE ; par4 = FALSE ; par5 = male ; par6 = all ; par7 = all ; par8 = ATTLES all ; par9 = variables ;
Parameters (R input):
par1 = ward ; par2 = 10 ; par3 = TRUE ; par4 = FALSE ; par5 = male ; par6 = all ; par7 = all ; par8 = ATTLES all ; par9 = variables ;
R code (references can be found in the software module):
x <- as.data.frame(read.table(file='https://automated.biganalytics.eu/download/utaut.csv',sep=',',header=T))
x$U25 <- 6-x$U25
if(par5 == 'female') x <- x[x$Gender==0,]
if(par5 == 'male') x <- x[x$Gender==1,]
if(par6 == 'prep') x <- x[x$Pop==1,]
if(par6 == 'bachelor') x <- x[x$Pop==0,]
if(par7 != 'all') {
x <- x[x$Year==as.numeric(par7),]
}
cAc <- with(x,cbind( A1, A2, A3, A4, A5, A6, A7, A8, A9,A10))
cAs <- with(x,cbind(A11,A12,A13,A14,A15,A16,A17,A18,A19,A20))
cA <- cbind(cAc,cAs)
cCa <- with(x,cbind(C1,C3,C5,C7, C9,C11,C13,C15,C17,C19,C21,C23,C25,C27,C29,C31,C33,C35,C37,C39,C41,C43,C45,C47))
cCp <- with(x,cbind(C2,C4,C6,C8,C10,C12,C14,C16,C18,C20,C22,C24,C26,C28,C30,C32,C34,C36,C38,C40,C42,C44,C46,C48))
cC <- cbind(cCa,cCp)
cU <- with(x,cbind(U1,U2,U3,U4,U5,U6,U7,U8,U9,U10,U11,U12,U13,U14,U15,U16,U17,U18,U19,U20,U21,U22,U23,U24,U25,U26,U27,U28,U29,U30,U31,U32,U33))
cE <- with(x,cbind(BC,NNZFG,MRT,AFL,LPM,LPC,W,WPA))
cX <- with(x,cbind(X1,X2,X3,X4,X5,X6,X7,X8,X9,X10,X11,X12,X13,X14,X15,X16,X17,X18))
if (par8=='ATTLES connected') x <- cAc
if (par8=='ATTLES separate') x <- cAs
if (par8=='ATTLES all') x <- cA
if (par8=='COLLES actuals') x <- cCa
if (par8=='COLLES preferred') x <- cCp
if (par8=='COLLES all') x <- cC
if (par8=='CSUQ') x <- cU
if (par8=='Learning Activities') x <- cE
if (par8=='Exam Items') x <- cX
ncol <- length(x[1,])
for (jjj in 1:ncol) {
x <- x[!is.na(x[,jjj]),]
}
par3 <- as.logical(par3)
par4 <- as.logical(par4)
if (par3 == TRUE){
dum = xlab
xlab = ylab
ylab = dum
}
if (par9=='variables') {
x <- t(x)
} else {
ncol <- length(x[1,])
colnames(x) <- 1:ncol
}
hc <- hclust(dist(x),method=par1)
d <- as.dendrogram(hc)
str(d)
mysub <- paste('Method: ',par1)
bitmap(file='test1.png')
if (par4 == TRUE){
plot(d,main=main,ylab=ylab,xlab=xlab,horiz=par3, nodePar=list(pch = c(1,NA), cex=0.8, lab.cex = 0.8),type='t',center=T, sub=mysub)
} else {
plot(d,main=main,ylab=ylab,xlab=xlab,horiz=par3, nodePar=list(pch = c(1,NA), cex=0.8, lab.cex = 0.8), sub=mysub)
}
dev.off()
if (par2 != 'ALL'){
if (par3 == TRUE){
ylab = 'cluster'
} else {
xlab = 'cluster'
}
par2 <- as.numeric(par2)
memb <- cutree(hc, k = par2)
cent <- NULL
for(k in 1:par2){
cent <- rbind(cent, colMeans(x[memb == k, , drop = FALSE]))
}
hc1 <- hclust(dist(cent),method=par1, members = table(memb))
de <- as.dendrogram(hc1)
bitmap(file='test2.png')
if (par4 == TRUE){
plot(de,main=main,ylab=ylab,xlab=xlab,horiz=par3, nodePar=list(pch = c(1,NA), cex=0.8, lab.cex = 0.8),type='t',center=T, sub=mysub)
} else {
plot(de,main=main,ylab=ylab,xlab=xlab,horiz=par3, nodePar=list(pch = c(1,NA), cex=0.8, lab.cex = 0.8), sub=mysub)
}
dev.off()
str(de)
}
load(file='createtable')
a<-table.start()
a<-table.row.start(a)
a<-table.element(a,'Summary of Dendrogram',2,TRUE)
a<-table.row.end(a)
a<-table.row.start(a)
a<-table.element(a,'Label',header=TRUE)
a<-table.element(a,'Height',header=TRUE)
a<-table.row.end(a)
num <- length(x[,1])-1
for (i in 1:num)
{
a<-table.row.start(a)
a<-table.element(a,hc$labels[i])
a<-table.element(a,hc$height[i])
a<-table.row.end(a)
}
a<-table.end(a)
table.save(a,file='mytable1.tab')
if (par2 != 'ALL'){
a<-table.start()
a<-table.row.start(a)
a<-table.element(a,'Summary of Cut Dendrogram',2,TRUE)
a<-table.row.end(a)
a<-table.row.start(a)
a<-table.element(a,'Label',header=TRUE)
a<-table.element(a,'Height',header=TRUE)
a<-table.row.end(a)
num <- par2-1
for (i in 1:num)
{
a<-table.row.start(a)
a<-table.element(a,i)
a<-table.element(a,hc1$height[i])
a<-table.row.end(a)
}
a<-table.end(a)
table.save(a,file='mytable2.tab')
}