Free Statistics

of Irreproducible Research!

Author's title

Author*The author of this computation has been verified*
R Software Modulerwasp_hierarchicalclusteringdm.wasp
Title produced by softwareHierarchical Clustering
Date of computationMon, 30 Apr 2012 07:51:56 -0400
Cite this page as followsStatistical Computations at FreeStatistics.org, Office for Research Development and Education, URL https://freestatistics.org/blog/index.php?v=date/2012/Apr/30/t1335786786133yp6lrld7u4xx.htm/, Retrieved Mon, 29 Apr 2024 07:43:36 +0000
Statistical Computations at FreeStatistics.org, Office for Research Development and Education, URL https://freestatistics.org/blog/index.php?pk=165222, Retrieved Mon, 29 Apr 2024 07:43:36 +0000
QR Codes:

Original text written by user:
IsPrivate?No (this computation is public)
User-defined keywords
Estimated Impact150
Family? (F = Feedback message, R = changed R code, M = changed R Module, P = changed Parameters, D = changed Data)
-     [Hierarchical Clustering] [Hierarchical Clus...] [2012-04-23 19:51:00] [489eb911c8db04aca1fc54d886fc3144]
-   P   [Hierarchical Clustering] [Hierarchical Clus...] [2012-04-23 19:52:52] [489eb911c8db04aca1fc54d886fc3144]
-   P       [Hierarchical Clustering] [Hierarchical Clus...] [2012-04-30 11:51:56] [d160b678fd2d7bb562db2147d7efddc2] [Current]
Feedback Forum

Post a new message


Summary of computational transaction
Raw Inputview raw input (R code)
Raw Outputview raw output of R engine
Computing time1 seconds
R Server'Gwilym Jenkins' @ jenkins.wessa.net

\begin{tabular}{lllllllll}
\hline
Summary of computational transaction \tabularnewline
Raw Input & view raw input (R code)  \tabularnewline
Raw Output & view raw output of R engine  \tabularnewline
Computing time & 1 seconds \tabularnewline
R Server & 'Gwilym Jenkins' @ jenkins.wessa.net \tabularnewline
\hline
\end{tabular}
%Source: https://freestatistics.org/blog/index.php?pk=165222&T=0

[TABLE]
[ROW][C]Summary of computational transaction[/C][/ROW]
[ROW][C]Raw Input[/C][C]view raw input (R code) [/C][/ROW]
[ROW][C]Raw Output[/C][C]view raw output of R engine [/C][/ROW]
[ROW][C]Computing time[/C][C]1 seconds[/C][/ROW]
[ROW][C]R Server[/C][C]'Gwilym Jenkins' @ jenkins.wessa.net[/C][/ROW]
[/TABLE]
Source: https://freestatistics.org/blog/index.php?pk=165222&T=0

Globally Unique Identifier (entire table): ba.freestatistics.org/blog/index.php?pk=165222&T=0

As an alternative you can also use a QR Code:  

The GUIDs for individual cells are displayed in the table below:

Summary of computational transaction
Raw Inputview raw input (R code)
Raw Outputview raw output of R engine
Computing time1 seconds
R Server'Gwilym Jenkins' @ jenkins.wessa.net


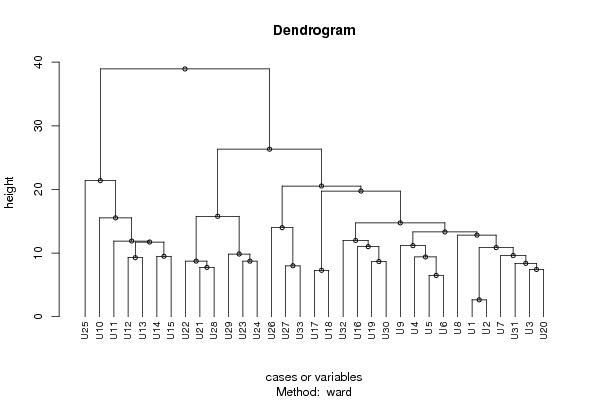
Summary of Dendrogram
LabelHeight
U12.64575131106459
U26.48074069840786
U37.28010988928052
U47.41619848709566
U57.74596669241483
U68
U78.37861860010698
U88.66025403784439
U98.71779788708135
U108.72926303637003
U119.2736184954957
U129.38033455075732
U139.48683298050514
U149.60464095907842
U159.84009725109337
U1610.8548984849615
U1711.0016562236011
U1811.1554681434894
U1911.7315064052927
U2011.8866598023085
U2111.974990945281
U2212.808378479263
U2313.3194480708804
U2413.9865752375387
U2514.7373114303306
U2615.52508745973
U2715.7682515814551
U2819.7383301252291
U2920.5305771553831
U3021.3868206539163
U3126.3179808266507
U3238.9296289927613

\begin{tabular}{lllllllll}
\hline
Summary of Dendrogram \tabularnewline
Label & Height \tabularnewline
U1 & 2.64575131106459 \tabularnewline
U2 & 6.48074069840786 \tabularnewline
U3 & 7.28010988928052 \tabularnewline
U4 & 7.41619848709566 \tabularnewline
U5 & 7.74596669241483 \tabularnewline
U6 & 8 \tabularnewline
U7 & 8.37861860010698 \tabularnewline
U8 & 8.66025403784439 \tabularnewline
U9 & 8.71779788708135 \tabularnewline
U10 & 8.72926303637003 \tabularnewline
U11 & 9.2736184954957 \tabularnewline
U12 & 9.38033455075732 \tabularnewline
U13 & 9.48683298050514 \tabularnewline
U14 & 9.60464095907842 \tabularnewline
U15 & 9.84009725109337 \tabularnewline
U16 & 10.8548984849615 \tabularnewline
U17 & 11.0016562236011 \tabularnewline
U18 & 11.1554681434894 \tabularnewline
U19 & 11.7315064052927 \tabularnewline
U20 & 11.8866598023085 \tabularnewline
U21 & 11.974990945281 \tabularnewline
U22 & 12.808378479263 \tabularnewline
U23 & 13.3194480708804 \tabularnewline
U24 & 13.9865752375387 \tabularnewline
U25 & 14.7373114303306 \tabularnewline
U26 & 15.52508745973 \tabularnewline
U27 & 15.7682515814551 \tabularnewline
U28 & 19.7383301252291 \tabularnewline
U29 & 20.5305771553831 \tabularnewline
U30 & 21.3868206539163 \tabularnewline
U31 & 26.3179808266507 \tabularnewline
U32 & 38.9296289927613 \tabularnewline
\hline
\end{tabular}
%Source: https://freestatistics.org/blog/index.php?pk=165222&T=1

[TABLE]
[ROW][C]Summary of Dendrogram[/C][/ROW]
[ROW][C]Label[/C][C]Height[/C][/ROW]
[ROW][C]U1[/C][C]2.64575131106459[/C][/ROW]
[ROW][C]U2[/C][C]6.48074069840786[/C][/ROW]
[ROW][C]U3[/C][C]7.28010988928052[/C][/ROW]
[ROW][C]U4[/C][C]7.41619848709566[/C][/ROW]
[ROW][C]U5[/C][C]7.74596669241483[/C][/ROW]
[ROW][C]U6[/C][C]8[/C][/ROW]
[ROW][C]U7[/C][C]8.37861860010698[/C][/ROW]
[ROW][C]U8[/C][C]8.66025403784439[/C][/ROW]
[ROW][C]U9[/C][C]8.71779788708135[/C][/ROW]
[ROW][C]U10[/C][C]8.72926303637003[/C][/ROW]
[ROW][C]U11[/C][C]9.2736184954957[/C][/ROW]
[ROW][C]U12[/C][C]9.38033455075732[/C][/ROW]
[ROW][C]U13[/C][C]9.48683298050514[/C][/ROW]
[ROW][C]U14[/C][C]9.60464095907842[/C][/ROW]
[ROW][C]U15[/C][C]9.84009725109337[/C][/ROW]
[ROW][C]U16[/C][C]10.8548984849615[/C][/ROW]
[ROW][C]U17[/C][C]11.0016562236011[/C][/ROW]
[ROW][C]U18[/C][C]11.1554681434894[/C][/ROW]
[ROW][C]U19[/C][C]11.7315064052927[/C][/ROW]
[ROW][C]U20[/C][C]11.8866598023085[/C][/ROW]
[ROW][C]U21[/C][C]11.974990945281[/C][/ROW]
[ROW][C]U22[/C][C]12.808378479263[/C][/ROW]
[ROW][C]U23[/C][C]13.3194480708804[/C][/ROW]
[ROW][C]U24[/C][C]13.9865752375387[/C][/ROW]
[ROW][C]U25[/C][C]14.7373114303306[/C][/ROW]
[ROW][C]U26[/C][C]15.52508745973[/C][/ROW]
[ROW][C]U27[/C][C]15.7682515814551[/C][/ROW]
[ROW][C]U28[/C][C]19.7383301252291[/C][/ROW]
[ROW][C]U29[/C][C]20.5305771553831[/C][/ROW]
[ROW][C]U30[/C][C]21.3868206539163[/C][/ROW]
[ROW][C]U31[/C][C]26.3179808266507[/C][/ROW]
[ROW][C]U32[/C][C]38.9296289927613[/C][/ROW]
[/TABLE]
Source: https://freestatistics.org/blog/index.php?pk=165222&T=1

Globally Unique Identifier (entire table): ba.freestatistics.org/blog/index.php?pk=165222&T=1

As an alternative you can also use a QR Code:  

The GUIDs for individual cells are displayed in the table below:

Summary of Dendrogram
LabelHeight
U12.64575131106459
U26.48074069840786
U37.28010988928052
U47.41619848709566
U57.74596669241483
U68
U78.37861860010698
U88.66025403784439
U98.71779788708135
U108.72926303637003
U119.2736184954957
U129.38033455075732
U139.48683298050514
U149.60464095907842
U159.84009725109337
U1610.8548984849615
U1711.0016562236011
U1811.1554681434894
U1911.7315064052927
U2011.8866598023085
U2111.974990945281
U2212.808378479263
U2313.3194480708804
U2413.9865752375387
U2514.7373114303306
U2615.52508745973
U2715.7682515814551
U2819.7383301252291
U2920.5305771553831
U3021.3868206539163
U3126.3179808266507
U3238.9296289927613


Parameters (Session):
par1 = ward ; par2 = ALL ; par3 = FALSE ; par4 = FALSE ; par5 = male ; par6 = bachelor ; par7 = all ; par8 = CSUQ ; par9 = variables ;
Parameters (R input):
par1 = ward ; par2 = ALL ; par3 = FALSE ; par4 = FALSE ; par5 = male ; par6 = bachelor ; par7 = all ; par8 = CSUQ ; par9 = variables ;
R code (references can be found in the software module):
x <- as.data.frame(read.table(file='https://automated.biganalytics.eu/download/utaut.csv',sep=',',header=T))
x$U25 <- 6-x$U25
if(par5 == 'female') x <- x[x$Gender==0,]
if(par5 == 'male') x <- x[x$Gender==1,]
if(par6 == 'prep') x <- x[x$Pop==1,]
if(par6 == 'bachelor') x <- x[x$Pop==0,]
if(par7 != 'all') {
x <- x[x$Year==as.numeric(par7),]
}
cAc <- with(x,cbind( A1, A2, A3, A4, A5, A6, A7, A8, A9,A10))
cAs <- with(x,cbind(A11,A12,A13,A14,A15,A16,A17,A18,A19,A20))
cA <- cbind(cAc,cAs)
cCa <- with(x,cbind(C1,C3,C5,C7, C9,C11,C13,C15,C17,C19,C21,C23,C25,C27,C29,C31,C33,C35,C37,C39,C41,C43,C45,C47))
cCp <- with(x,cbind(C2,C4,C6,C8,C10,C12,C14,C16,C18,C20,C22,C24,C26,C28,C30,C32,C34,C36,C38,C40,C42,C44,C46,C48))
cC <- cbind(cCa,cCp)
cU <- with(x,cbind(U1,U2,U3,U4,U5,U6,U7,U8,U9,U10,U11,U12,U13,U14,U15,U16,U17,U18,U19,U20,U21,U22,U23,U24,U25,U26,U27,U28,U29,U30,U31,U32,U33))
cE <- with(x,cbind(BC,NNZFG,MRT,AFL,LPM,LPC,W,WPA))
cX <- with(x,cbind(X1,X2,X3,X4,X5,X6,X7,X8,X9,X10,X11,X12,X13,X14,X15,X16,X17,X18))
if (par8=='ATTLES connected') x <- cAc
if (par8=='ATTLES separate') x <- cAs
if (par8=='ATTLES all') x <- cA
if (par8=='COLLES actuals') x <- cCa
if (par8=='COLLES preferred') x <- cCp
if (par8=='COLLES all') x <- cC
if (par8=='CSUQ') x <- cU
if (par8=='Learning Activities') x <- cE
if (par8=='Exam Items') x <- cX
ncol <- length(x[1,])
for (jjj in 1:ncol) {
x <- x[!is.na(x[,jjj]),]
}
par3 <- as.logical(par3)
par4 <- as.logical(par4)
if (par3 == TRUE){
dum = xlab
xlab = ylab
ylab = dum
}
if (par9=='variables') {
x <- t(x)
} else {
ncol <- length(x[1,])
colnames(x) <- 1:ncol
}
hc <- hclust(dist(x),method=par1)
d <- as.dendrogram(hc)
str(d)
mysub <- paste('Method: ',par1)
bitmap(file='test1.png')
if (par4 == TRUE){
plot(d,main=main,ylab=ylab,xlab=xlab,horiz=par3, nodePar=list(pch = c(1,NA), cex=0.8, lab.cex = 0.8),type='t',center=T, sub=mysub)
} else {
plot(d,main=main,ylab=ylab,xlab=xlab,horiz=par3, nodePar=list(pch = c(1,NA), cex=0.8, lab.cex = 0.8), sub=mysub)
}
dev.off()
if (par2 != 'ALL'){
if (par3 == TRUE){
ylab = 'cluster'
} else {
xlab = 'cluster'
}
par2 <- as.numeric(par2)
memb <- cutree(hc, k = par2)
cent <- NULL
for(k in 1:par2){
cent <- rbind(cent, colMeans(x[memb == k, , drop = FALSE]))
}
hc1 <- hclust(dist(cent),method=par1, members = table(memb))
de <- as.dendrogram(hc1)
bitmap(file='test2.png')
if (par4 == TRUE){
plot(de,main=main,ylab=ylab,xlab=xlab,horiz=par3, nodePar=list(pch = c(1,NA), cex=0.8, lab.cex = 0.8),type='t',center=T, sub=mysub)
} else {
plot(de,main=main,ylab=ylab,xlab=xlab,horiz=par3, nodePar=list(pch = c(1,NA), cex=0.8, lab.cex = 0.8), sub=mysub)
}
dev.off()
str(de)
}
load(file='createtable')
a<-table.start()
a<-table.row.start(a)
a<-table.element(a,'Summary of Dendrogram',2,TRUE)
a<-table.row.end(a)
a<-table.row.start(a)
a<-table.element(a,'Label',header=TRUE)
a<-table.element(a,'Height',header=TRUE)
a<-table.row.end(a)
num <- length(x[,1])-1
for (i in 1:num)
{
a<-table.row.start(a)
a<-table.element(a,hc$labels[i])
a<-table.element(a,hc$height[i])
a<-table.row.end(a)
}
a<-table.end(a)
table.save(a,file='mytable1.tab')
if (par2 != 'ALL'){
a<-table.start()
a<-table.row.start(a)
a<-table.element(a,'Summary of Cut Dendrogram',2,TRUE)
a<-table.row.end(a)
a<-table.row.start(a)
a<-table.element(a,'Label',header=TRUE)
a<-table.element(a,'Height',header=TRUE)
a<-table.row.end(a)
num <- par2-1
for (i in 1:num)
{
a<-table.row.start(a)
a<-table.element(a,i)
a<-table.element(a,hc1$height[i])
a<-table.row.end(a)
}
a<-table.end(a)
table.save(a,file='mytable2.tab')
}