Free Statistics

of Irreproducible Research!

Author's title

Author*The author of this computation has been verified*
R Software Modulerwasp_hierarchicalclusteringdm.wasp
Title produced by softwareHierarchical Clustering
Date of computationMon, 30 Apr 2012 09:01:05 -0400
Cite this page as followsStatistical Computations at FreeStatistics.org, Office for Research Development and Education, URL https://freestatistics.org/blog/index.php?v=date/2012/Apr/30/t1335790903l1v0zpfj3z6xz9s.htm/, Retrieved Sun, 28 Apr 2024 19:23:04 +0000
Statistical Computations at FreeStatistics.org, Office for Research Development and Education, URL https://freestatistics.org/blog/index.php?pk=165244, Retrieved Sun, 28 Apr 2024 19:23:04 +0000
QR Codes:

Original text written by user:
IsPrivate?No (this computation is public)
User-defined keywords
Estimated Impact106
Family? (F = Feedback message, R = changed R code, M = changed R Module, P = changed Parameters, D = changed Data)
-       [Hierarchical Clustering] [FemaleBA2] [2012-04-30 13:01:05] [050dc696fa22882d0c3b1ebe5a70a85e] [Current]
Feedback Forum

Post a new message


Summary of computational transaction
Raw Inputview raw input (R code)
Raw Outputview raw output of R engine
Computing time2 seconds
R Server'AstonUniversity' @ aston.wessa.net

\begin{tabular}{lllllllll}
\hline
Summary of computational transaction \tabularnewline
Raw Input & view raw input (R code)  \tabularnewline
Raw Output & view raw output of R engine  \tabularnewline
Computing time & 2 seconds \tabularnewline
R Server & 'AstonUniversity' @ aston.wessa.net \tabularnewline
\hline
\end{tabular}
%Source: https://freestatistics.org/blog/index.php?pk=165244&T=0

[TABLE]
[ROW][C]Summary of computational transaction[/C][/ROW]
[ROW][C]Raw Input[/C][C]view raw input (R code) [/C][/ROW]
[ROW][C]Raw Output[/C][C]view raw output of R engine [/C][/ROW]
[ROW][C]Computing time[/C][C]2 seconds[/C][/ROW]
[ROW][C]R Server[/C][C]'AstonUniversity' @ aston.wessa.net[/C][/ROW]
[/TABLE]
Source: https://freestatistics.org/blog/index.php?pk=165244&T=0

Globally Unique Identifier (entire table): ba.freestatistics.org/blog/index.php?pk=165244&T=0

As an alternative you can also use a QR Code:  

The GUIDs for individual cells are displayed in the table below:

Summary of computational transaction
Raw Inputview raw input (R code)
Raw Outputview raw output of R engine
Computing time2 seconds
R Server'AstonUniversity' @ aston.wessa.net


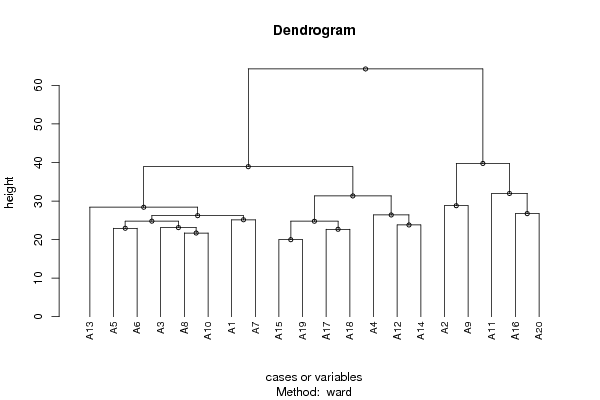
Summary of Dendrogram
LabelHeight
A119.9749843554382
A221.7025344142107
A322.6715680975093
A422.9346898823594
A523.1134692366594
A623.7907545067406
A724.7577367711985
A824.7756815297156
A925.1396101799531
A1026.2128025715758
A1126.3885744108785
A1226.7394839142419
A1328.3922796094289
A1428.7923600977759
A1531.3256290419229
A1631.962366602182
A1738.9268458079737
A1839.753373082564
A1964.2775393737694

\begin{tabular}{lllllllll}
\hline
Summary of Dendrogram \tabularnewline
Label & Height \tabularnewline
A1 & 19.9749843554382 \tabularnewline
A2 & 21.7025344142107 \tabularnewline
A3 & 22.6715680975093 \tabularnewline
A4 & 22.9346898823594 \tabularnewline
A5 & 23.1134692366594 \tabularnewline
A6 & 23.7907545067406 \tabularnewline
A7 & 24.7577367711985 \tabularnewline
A8 & 24.7756815297156 \tabularnewline
A9 & 25.1396101799531 \tabularnewline
A10 & 26.2128025715758 \tabularnewline
A11 & 26.3885744108785 \tabularnewline
A12 & 26.7394839142419 \tabularnewline
A13 & 28.3922796094289 \tabularnewline
A14 & 28.7923600977759 \tabularnewline
A15 & 31.3256290419229 \tabularnewline
A16 & 31.962366602182 \tabularnewline
A17 & 38.9268458079737 \tabularnewline
A18 & 39.753373082564 \tabularnewline
A19 & 64.2775393737694 \tabularnewline
\hline
\end{tabular}
%Source: https://freestatistics.org/blog/index.php?pk=165244&T=1

[TABLE]
[ROW][C]Summary of Dendrogram[/C][/ROW]
[ROW][C]Label[/C][C]Height[/C][/ROW]
[ROW][C]A1[/C][C]19.9749843554382[/C][/ROW]
[ROW][C]A2[/C][C]21.7025344142107[/C][/ROW]
[ROW][C]A3[/C][C]22.6715680975093[/C][/ROW]
[ROW][C]A4[/C][C]22.9346898823594[/C][/ROW]
[ROW][C]A5[/C][C]23.1134692366594[/C][/ROW]
[ROW][C]A6[/C][C]23.7907545067406[/C][/ROW]
[ROW][C]A7[/C][C]24.7577367711985[/C][/ROW]
[ROW][C]A8[/C][C]24.7756815297156[/C][/ROW]
[ROW][C]A9[/C][C]25.1396101799531[/C][/ROW]
[ROW][C]A10[/C][C]26.2128025715758[/C][/ROW]
[ROW][C]A11[/C][C]26.3885744108785[/C][/ROW]
[ROW][C]A12[/C][C]26.7394839142419[/C][/ROW]
[ROW][C]A13[/C][C]28.3922796094289[/C][/ROW]
[ROW][C]A14[/C][C]28.7923600977759[/C][/ROW]
[ROW][C]A15[/C][C]31.3256290419229[/C][/ROW]
[ROW][C]A16[/C][C]31.962366602182[/C][/ROW]
[ROW][C]A17[/C][C]38.9268458079737[/C][/ROW]
[ROW][C]A18[/C][C]39.753373082564[/C][/ROW]
[ROW][C]A19[/C][C]64.2775393737694[/C][/ROW]
[/TABLE]
Source: https://freestatistics.org/blog/index.php?pk=165244&T=1

Globally Unique Identifier (entire table): ba.freestatistics.org/blog/index.php?pk=165244&T=1

As an alternative you can also use a QR Code:  

The GUIDs for individual cells are displayed in the table below:

Summary of Dendrogram
LabelHeight
A119.9749843554382
A221.7025344142107
A322.6715680975093
A422.9346898823594
A523.1134692366594
A623.7907545067406
A724.7577367711985
A824.7756815297156
A925.1396101799531
A1026.2128025715758
A1126.3885744108785
A1226.7394839142419
A1328.3922796094289
A1428.7923600977759
A1531.3256290419229
A1631.962366602182
A1738.9268458079737
A1839.753373082564
A1964.2775393737694


Parameters (Session):
par1 = ward ; par2 = ALL ; par3 = FALSE ; par4 = FALSE ; par5 = female ; par6 = all ; par7 = all ; par8 = ATTLES all ; par9 = variables ;
Parameters (R input):
par1 = ward ; par2 = ALL ; par3 = FALSE ; par4 = FALSE ; par5 = female ; par6 = all ; par7 = all ; par8 = ATTLES all ; par9 = variables ;
R code (references can be found in the software module):
x <- as.data.frame(read.table(file='https://automated.biganalytics.eu/download/utaut.csv',sep=',',header=T))
x$U25 <- 6-x$U25
if(par5 == 'female') x <- x[x$Gender==0,]
if(par5 == 'male') x <- x[x$Gender==1,]
if(par6 == 'prep') x <- x[x$Pop==1,]
if(par6 == 'bachelor') x <- x[x$Pop==0,]
if(par7 != 'all') {
x <- x[x$Year==as.numeric(par7),]
}
cAc <- with(x,cbind( A1, A2, A3, A4, A5, A6, A7, A8, A9,A10))
cAs <- with(x,cbind(A11,A12,A13,A14,A15,A16,A17,A18,A19,A20))
cA <- cbind(cAc,cAs)
cCa <- with(x,cbind(C1,C3,C5,C7, C9,C11,C13,C15,C17,C19,C21,C23,C25,C27,C29,C31,C33,C35,C37,C39,C41,C43,C45,C47))
cCp <- with(x,cbind(C2,C4,C6,C8,C10,C12,C14,C16,C18,C20,C22,C24,C26,C28,C30,C32,C34,C36,C38,C40,C42,C44,C46,C48))
cC <- cbind(cCa,cCp)
cU <- with(x,cbind(U1,U2,U3,U4,U5,U6,U7,U8,U9,U10,U11,U12,U13,U14,U15,U16,U17,U18,U19,U20,U21,U22,U23,U24,U25,U26,U27,U28,U29,U30,U31,U32,U33))
cE <- with(x,cbind(BC,NNZFG,MRT,AFL,LPM,LPC,W,WPA))
cX <- with(x,cbind(X1,X2,X3,X4,X5,X6,X7,X8,X9,X10,X11,X12,X13,X14,X15,X16,X17,X18))
if (par8=='ATTLES connected') x <- cAc
if (par8=='ATTLES separate') x <- cAs
if (par8=='ATTLES all') x <- cA
if (par8=='COLLES actuals') x <- cCa
if (par8=='COLLES preferred') x <- cCp
if (par8=='COLLES all') x <- cC
if (par8=='CSUQ') x <- cU
if (par8=='Learning Activities') x <- cE
if (par8=='Exam Items') x <- cX
ncol <- length(x[1,])
for (jjj in 1:ncol) {
x <- x[!is.na(x[,jjj]),]
}
par3 <- as.logical(par3)
par4 <- as.logical(par4)
if (par3 == TRUE){
dum = xlab
xlab = ylab
ylab = dum
}
if (par9=='variables') {
x <- t(x)
} else {
ncol <- length(x[1,])
colnames(x) <- 1:ncol
}
hc <- hclust(dist(x),method=par1)
d <- as.dendrogram(hc)
str(d)
mysub <- paste('Method: ',par1)
bitmap(file='test1.png')
if (par4 == TRUE){
plot(d,main=main,ylab=ylab,xlab=xlab,horiz=par3, nodePar=list(pch = c(1,NA), cex=0.8, lab.cex = 0.8),type='t',center=T, sub=mysub)
} else {
plot(d,main=main,ylab=ylab,xlab=xlab,horiz=par3, nodePar=list(pch = c(1,NA), cex=0.8, lab.cex = 0.8), sub=mysub)
}
dev.off()
if (par2 != 'ALL'){
if (par3 == TRUE){
ylab = 'cluster'
} else {
xlab = 'cluster'
}
par2 <- as.numeric(par2)
memb <- cutree(hc, k = par2)
cent <- NULL
for(k in 1:par2){
cent <- rbind(cent, colMeans(x[memb == k, , drop = FALSE]))
}
hc1 <- hclust(dist(cent),method=par1, members = table(memb))
de <- as.dendrogram(hc1)
bitmap(file='test2.png')
if (par4 == TRUE){
plot(de,main=main,ylab=ylab,xlab=xlab,horiz=par3, nodePar=list(pch = c(1,NA), cex=0.8, lab.cex = 0.8),type='t',center=T, sub=mysub)
} else {
plot(de,main=main,ylab=ylab,xlab=xlab,horiz=par3, nodePar=list(pch = c(1,NA), cex=0.8, lab.cex = 0.8), sub=mysub)
}
dev.off()
str(de)
}
load(file='createtable')
a<-table.start()
a<-table.row.start(a)
a<-table.element(a,'Summary of Dendrogram',2,TRUE)
a<-table.row.end(a)
a<-table.row.start(a)
a<-table.element(a,'Label',header=TRUE)
a<-table.element(a,'Height',header=TRUE)
a<-table.row.end(a)
num <- length(x[,1])-1
for (i in 1:num)
{
a<-table.row.start(a)
a<-table.element(a,hc$labels[i])
a<-table.element(a,hc$height[i])
a<-table.row.end(a)
}
a<-table.end(a)
table.save(a,file='mytable1.tab')
if (par2 != 'ALL'){
a<-table.start()
a<-table.row.start(a)
a<-table.element(a,'Summary of Cut Dendrogram',2,TRUE)
a<-table.row.end(a)
a<-table.row.start(a)
a<-table.element(a,'Label',header=TRUE)
a<-table.element(a,'Height',header=TRUE)
a<-table.row.end(a)
num <- par2-1
for (i in 1:num)
{
a<-table.row.start(a)
a<-table.element(a,i)
a<-table.element(a,hc1$height[i])
a<-table.row.end(a)
}
a<-table.end(a)
table.save(a,file='mytable2.tab')
}