Free Statistics

of Irreproducible Research!

Author's title

Author*The author of this computation has been verified*
R Software Modulerwasp_notchedbox1dm.wasp
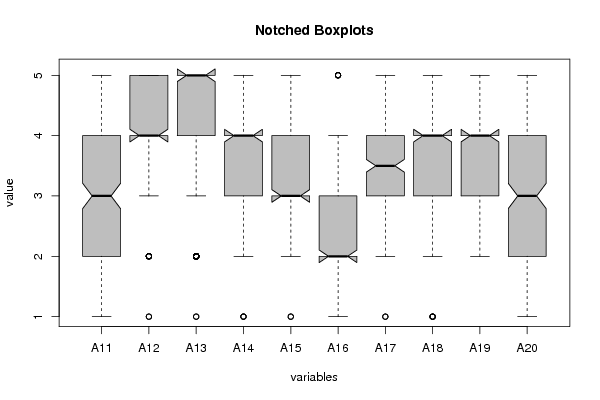
Title produced by softwareNotched Boxplots
Date of computationMon, 30 Apr 2012 09:35:08 -0400
Cite this page as followsStatistical Computations at FreeStatistics.org, Office for Research Development and Education, URL https://freestatistics.org/blog/index.php?v=date/2012/Apr/30/t1335793153zsydm4sylw9gns8.htm/, Retrieved Mon, 29 Apr 2024 02:28:29 +0000
Statistical Computations at FreeStatistics.org, Office for Research Development and Education, URL https://freestatistics.org/blog/index.php?pk=165257, Retrieved Mon, 29 Apr 2024 02:28:29 +0000
QR Codes:

Original text written by user:
IsPrivate?No (this computation is public)
User-defined keywords
Estimated Impact98
Family? (F = Feedback message, R = changed R code, M = changed R Module, P = changed Parameters, D = changed Data)
-       [Notched Boxplots] [Notched Boxplot] [2012-04-30 13:35:08] [d21839ec896caba47931721a9c4efa75] [Current]
- R P     [Notched Boxplots] [NB man] [2012-04-30 14:02:46] [6d29560f77ba0d0db0a9caaa1b5e377d]
- RMP     [Data Mining] [COR] [2012-04-30 14:22:05] [6d29560f77ba0d0db0a9caaa1b5e377d]
Feedback Forum

Post a new message


Summary of computational transaction
Raw Inputview raw input (R code)
Raw Outputview raw output of R engine
Computing time3 seconds
R Server'AstonUniversity' @ aston.wessa.net

\begin{tabular}{lllllllll}
\hline
Summary of computational transaction \tabularnewline
Raw Input & view raw input (R code)  \tabularnewline
Raw Output & view raw output of R engine  \tabularnewline
Computing time & 3 seconds \tabularnewline
R Server & 'AstonUniversity' @ aston.wessa.net \tabularnewline
\hline
\end{tabular}
%Source: https://freestatistics.org/blog/index.php?pk=165257&T=0

[TABLE]
[ROW][C]Summary of computational transaction[/C][/ROW]
[ROW][C]Raw Input[/C][C]view raw input (R code) [/C][/ROW]
[ROW][C]Raw Output[/C][C]view raw output of R engine [/C][/ROW]
[ROW][C]Computing time[/C][C]3 seconds[/C][/ROW]
[ROW][C]R Server[/C][C]'AstonUniversity' @ aston.wessa.net[/C][/ROW]
[/TABLE]
Source: https://freestatistics.org/blog/index.php?pk=165257&T=0

Globally Unique Identifier (entire table): ba.freestatistics.org/blog/index.php?pk=165257&T=0

As an alternative you can also use a QR Code:  

The GUIDs for individual cells are displayed in the table below:

Summary of computational transaction
Raw Inputview raw input (R code)
Raw Outputview raw output of R engine
Computing time3 seconds
R Server'AstonUniversity' @ aston.wessa.net


Boxplot statistics
Variablelower whiskerlower hingemedianupper hingeupper whisker
A1112345
A1234455
A1334555
A1423445
A1523345
A1612234
A17233.545
A1823445
A1923445
A2012345

\begin{tabular}{lllllllll}
\hline
Boxplot statistics \tabularnewline
Variable & lower whisker & lower hinge & median & upper hinge & upper whisker \tabularnewline
A11 & 1 & 2 & 3 & 4 & 5 \tabularnewline
A12 & 3 & 4 & 4 & 5 & 5 \tabularnewline
A13 & 3 & 4 & 5 & 5 & 5 \tabularnewline
A14 & 2 & 3 & 4 & 4 & 5 \tabularnewline
A15 & 2 & 3 & 3 & 4 & 5 \tabularnewline
A16 & 1 & 2 & 2 & 3 & 4 \tabularnewline
A17 & 2 & 3 & 3.5 & 4 & 5 \tabularnewline
A18 & 2 & 3 & 4 & 4 & 5 \tabularnewline
A19 & 2 & 3 & 4 & 4 & 5 \tabularnewline
A20 & 1 & 2 & 3 & 4 & 5 \tabularnewline
\hline
\end{tabular}
%Source: https://freestatistics.org/blog/index.php?pk=165257&T=1

[TABLE]
[ROW][C]Boxplot statistics[/C][/ROW]
[ROW][C]Variable[/C][C]lower whisker[/C][C]lower hinge[/C][C]median[/C][C]upper hinge[/C][C]upper whisker[/C][/ROW]
[ROW][C]A11[/C][C]1[/C][C]2[/C][C]3[/C][C]4[/C][C]5[/C][/ROW]
[ROW][C]A12[/C][C]3[/C][C]4[/C][C]4[/C][C]5[/C][C]5[/C][/ROW]
[ROW][C]A13[/C][C]3[/C][C]4[/C][C]5[/C][C]5[/C][C]5[/C][/ROW]
[ROW][C]A14[/C][C]2[/C][C]3[/C][C]4[/C][C]4[/C][C]5[/C][/ROW]
[ROW][C]A15[/C][C]2[/C][C]3[/C][C]3[/C][C]4[/C][C]5[/C][/ROW]
[ROW][C]A16[/C][C]1[/C][C]2[/C][C]2[/C][C]3[/C][C]4[/C][/ROW]
[ROW][C]A17[/C][C]2[/C][C]3[/C][C]3.5[/C][C]4[/C][C]5[/C][/ROW]
[ROW][C]A18[/C][C]2[/C][C]3[/C][C]4[/C][C]4[/C][C]5[/C][/ROW]
[ROW][C]A19[/C][C]2[/C][C]3[/C][C]4[/C][C]4[/C][C]5[/C][/ROW]
[ROW][C]A20[/C][C]1[/C][C]2[/C][C]3[/C][C]4[/C][C]5[/C][/ROW]
[/TABLE]
Source: https://freestatistics.org/blog/index.php?pk=165257&T=1

Globally Unique Identifier (entire table): ba.freestatistics.org/blog/index.php?pk=165257&T=1

As an alternative you can also use a QR Code:  

The GUIDs for individual cells are displayed in the table below:

Boxplot statistics
Variablelower whiskerlower hingemedianupper hingeupper whisker
A1112345
A1234455
A1334555
A1423445
A1523345
A1612234
A17233.545
A1823445
A1923445
A2012345


Boxplot Notches
Variablelower boundmedianupper bound
A112.7907238875837233.20927611241628
A123.8953619437918644.10463805620814
A134.8953619437918655.10463805620814
A143.8953619437918644.10463805620814
A152.8953619437918633.10463805620814
A161.8953619437918622.10463805620814
A173.395361943791863.53.60463805620814
A183.8953619437918644.10463805620814
A193.8953619437918644.10463805620814
A202.7907238875837233.20927611241628

\begin{tabular}{lllllllll}
\hline
Boxplot Notches \tabularnewline
Variable & lower bound & median & upper bound \tabularnewline
A11 & 2.79072388758372 & 3 & 3.20927611241628 \tabularnewline
A12 & 3.89536194379186 & 4 & 4.10463805620814 \tabularnewline
A13 & 4.89536194379186 & 5 & 5.10463805620814 \tabularnewline
A14 & 3.89536194379186 & 4 & 4.10463805620814 \tabularnewline
A15 & 2.89536194379186 & 3 & 3.10463805620814 \tabularnewline
A16 & 1.89536194379186 & 2 & 2.10463805620814 \tabularnewline
A17 & 3.39536194379186 & 3.5 & 3.60463805620814 \tabularnewline
A18 & 3.89536194379186 & 4 & 4.10463805620814 \tabularnewline
A19 & 3.89536194379186 & 4 & 4.10463805620814 \tabularnewline
A20 & 2.79072388758372 & 3 & 3.20927611241628 \tabularnewline
\hline
\end{tabular}
%Source: https://freestatistics.org/blog/index.php?pk=165257&T=2

[TABLE]
[ROW][C]Boxplot Notches[/C][/ROW]
[ROW][C]Variable[/C][C]lower bound[/C][C]median[/C][C]upper bound[/C][/ROW]
[ROW][C]A11[/C][C]2.79072388758372[/C][C]3[/C][C]3.20927611241628[/C][/ROW]
[ROW][C]A12[/C][C]3.89536194379186[/C][C]4[/C][C]4.10463805620814[/C][/ROW]
[ROW][C]A13[/C][C]4.89536194379186[/C][C]5[/C][C]5.10463805620814[/C][/ROW]
[ROW][C]A14[/C][C]3.89536194379186[/C][C]4[/C][C]4.10463805620814[/C][/ROW]
[ROW][C]A15[/C][C]2.89536194379186[/C][C]3[/C][C]3.10463805620814[/C][/ROW]
[ROW][C]A16[/C][C]1.89536194379186[/C][C]2[/C][C]2.10463805620814[/C][/ROW]
[ROW][C]A17[/C][C]3.39536194379186[/C][C]3.5[/C][C]3.60463805620814[/C][/ROW]
[ROW][C]A18[/C][C]3.89536194379186[/C][C]4[/C][C]4.10463805620814[/C][/ROW]
[ROW][C]A19[/C][C]3.89536194379186[/C][C]4[/C][C]4.10463805620814[/C][/ROW]
[ROW][C]A20[/C][C]2.79072388758372[/C][C]3[/C][C]3.20927611241628[/C][/ROW]
[/TABLE]
Source: https://freestatistics.org/blog/index.php?pk=165257&T=2

Globally Unique Identifier (entire table): ba.freestatistics.org/blog/index.php?pk=165257&T=2

As an alternative you can also use a QR Code:  

The GUIDs for individual cells are displayed in the table below:

Boxplot Notches
Variablelower boundmedianupper bound
A112.7907238875837233.20927611241628
A123.8953619437918644.10463805620814
A134.8953619437918655.10463805620814
A143.8953619437918644.10463805620814
A152.8953619437918633.10463805620814
A161.8953619437918622.10463805620814
A173.395361943791863.53.60463805620814
A183.8953619437918644.10463805620814
A193.8953619437918644.10463805620814
A202.7907238875837233.20927611241628


Parameters (Session):
par1 = grey ; par2 = all ; par3 = all ; par4 = 1 ; par5 = ATTLES separate ;
Parameters (R input):
par1 = grey ; par2 = all ; par3 = all ; par4 = 1 ; par5 = ATTLES separate ;
R code (references can be found in the software module):
par5 <- 'ATTLES connected'
par4 <- 'all'
par3 <- 'all'
par2 <- 'all'
par1 <- 'grey'
x <- as.data.frame(read.table(file='https://automated.biganalytics.eu/download/utaut.csv',sep=',',header=T))
x$U25 <- 6-x$U25
if(par2 == 'female') x <- x[x$Gender==0,]
if(par2 == 'male') x <- x[x$Gender==1,]
if(par3 == 'prep') x <- x[x$Pop==1,]
if(par3 == 'bachelor') x <- x[x$Pop==0,]
if(par4 != 'all') {
x <- x[x$Year==as.numeric(par4),]
}
cAc <- with(x,cbind( A1, A2, A3, A4, A5, A6, A7, A8, A9,A10))
cAs <- with(x,cbind(A11,A12,A13,A14,A15,A16,A17,A18,A19,A20))
cA <- cbind(cAc,cAs)
cCa <- with(x,cbind(C1,C3,C5,C7, C9,C11,C13,C15,C17,C19,C21,C23,C25,C27,C29,C31,C33,C35,C37,C39,C41,C43,C45,C47))
cCp <- with(x,cbind(C2,C4,C6,C8,C10,C12,C14,C16,C18,C20,C22,C24,C26,C28,C30,C32,C34,C36,C38,C40,C42,C44,C46,C48))
cC <- cbind(cCa,cCp)
cU <- with(x,cbind(U1,U2,U3,U4,U5,U6,U7,U8,U9,U10,U11,U12,U13,U14,U15,U16,U17,U18,U19,U20,U21,U22,U23,U24,U25,U26,U27,U28,U29,U30,U31,U32,U33))
cE <- with(x,cbind(BC,NNZFG,MRT,AFL,LPM,LPC,W,WPA))
cX <- with(x,cbind(X1,X2,X3,X4,X5,X6,X7,X8,X9,X10,X11,X12,X13,X14,X15,X16,X17,X18))
if (par5=='ATTLES connected') x <- cAc
if (par5=='ATTLES separate') x <- cAs
if (par5=='ATTLES all') x <- cA
if (par5=='COLLES actuals') x <- cCa
if (par5=='COLLES preferred') x <- cCp
if (par5=='COLLES all') x <- cC
if (par5=='CSUQ') x <- cU
if (par5=='Learning Activities') x <- cE
if (par5=='Exam Items') x <- cX
ncol <- length(x[1,])
for (jjj in 1:ncol) {
x <- x[!is.na(x[,jjj]),]
}
x <- t(x)
y <- x
z <- as.data.frame(t(y))
bitmap(file='test1.png')
(r<-boxplot(z ,xlab=xlab,ylab=ylab,main=main,notch=TRUE,col=par1))
dev.off()
load(file='createtable')
a<-table.start()
a<-table.row.start(a)
a<-table.element(a,hyperlink('overview.htm','Boxplot statistics','Boxplot overview'),6,TRUE)
a<-table.row.end(a)
a<-table.row.start(a)
a<-table.element(a,'Variable',1,TRUE)
a<-table.element(a,hyperlink('lower_whisker.htm','lower whisker','definition of lower whisker'),1,TRUE)
a<-table.element(a,hyperlink('lower_hinge.htm','lower hinge','definition of lower hinge'),1,TRUE)
a<-table.element(a,hyperlink('central_tendency.htm','median','definitions about measures of central tendency'),1,TRUE)
a<-table.element(a,hyperlink('upper_hinge.htm','upper hinge','definition of upper hinge'),1,TRUE)
a<-table.element(a,hyperlink('upper_whisker.htm','upper whisker','definition of upper whisker'),1,TRUE)
a<-table.row.end(a)
for (i in 1:length(y[,1]))
{
a<-table.row.start(a)
a<-table.element(a,dimnames(t(x))[[2]][i],1,TRUE)
for (j in 1:5)
{
a<-table.element(a,r$stats[j,i])
}
a<-table.row.end(a)
}
a<-table.end(a)
table.save(a,file='mytable.tab')
a<-table.start()
a<-table.row.start(a)
a<-table.element(a,'Boxplot Notches',4,TRUE)
a<-table.row.end(a)
a<-table.row.start(a)
a<-table.element(a,'Variable',1,TRUE)
a<-table.element(a,'lower bound',1,TRUE)
a<-table.element(a,'median',1,TRUE)
a<-table.element(a,'upper bound',1,TRUE)
a<-table.row.end(a)
for (i in 1:length(y[,1]))
{
a<-table.row.start(a)
a<-table.element(a,dimnames(t(x))[[2]][i],1,TRUE)
a<-table.element(a,r$conf[1,i])
a<-table.element(a,r$stats[3,i])
a<-table.element(a,r$conf[2,i])
a<-table.row.end(a)
}
a<-table.end(a)
table.save(a,file='mytable1.tab')