Free Statistics

of Irreproducible Research!

Author's title

Author*Unverified author*
R Software Modulerwasp_smp.wasp
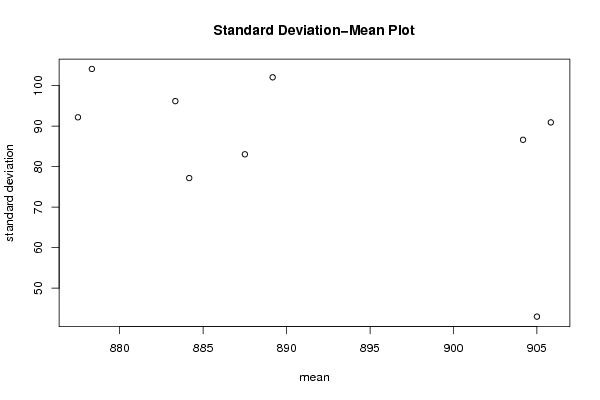
Title produced by softwareStandard Deviation-Mean Plot
Date of computationThu, 09 Aug 2012 08:41:26 -0400
Cite this page as followsStatistical Computations at FreeStatistics.org, Office for Research Development and Education, URL https://freestatistics.org/blog/index.php?v=date/2012/Aug/09/t1344516116zewfqzzqwicvyfs.htm/, Retrieved Wed, 01 May 2024 19:58:49 +0000
Statistical Computations at FreeStatistics.org, Office for Research Development and Education, URL https://freestatistics.org/blog/index.php?pk=169174, Retrieved Wed, 01 May 2024 19:58:49 +0000
QR Codes:

Original text written by user:
IsPrivate?No (this computation is public)
User-defined keywords
Estimated Impact139
Family? (F = Feedback message, R = changed R code, M = changed R Module, P = changed Parameters, D = changed Data)
-       [Standard Deviation-Mean Plot] [] [2012-08-09 12:41:26] [d41d8cd98f00b204e9800998ecf8427e] [Current]
Feedback Forum

Post a new message
Dataseries X:
940
950
920
930
930
900
940
840
890
850
830
940
960
900
940
920
930
970
930
780
810
870
720
880
920
920
950
950
890
960
780
780
760
860
740
1020
890
1040
920
900
950
990
840
740
840
960
790
1010
900
970
920
980
890
1000
880
740
860
940
760
1010
870
980
920
950
880
980
910
730
880
820
690
990
800
960
910
950
940
1010
890
660
860
840
740
980
820
1080
930
970
930
1010
880
740
860
810
750
890
790
1000
890
970
900
990
910
730
850
840
830
950


Summary of computational transaction
Raw Inputview raw input (R code)
Raw Outputview raw output of R engine
Computing time1 seconds
R Server'Gwilym Jenkins' @ jenkins.wessa.net

\begin{tabular}{lllllllll}
\hline
Summary of computational transaction \tabularnewline
Raw Input & view raw input (R code)  \tabularnewline
Raw Output & view raw output of R engine  \tabularnewline
Computing time & 1 seconds \tabularnewline
R Server & 'Gwilym Jenkins' @ jenkins.wessa.net \tabularnewline
\hline
\end{tabular}
%Source: https://freestatistics.org/blog/index.php?pk=169174&T=0

[TABLE]
[ROW][C]Summary of computational transaction[/C][/ROW]
[ROW][C]Raw Input[/C][C]view raw input (R code) [/C][/ROW]
[ROW][C]Raw Output[/C][C]view raw output of R engine [/C][/ROW]
[ROW][C]Computing time[/C][C]1 seconds[/C][/ROW]
[ROW][C]R Server[/C][C]'Gwilym Jenkins' @ jenkins.wessa.net[/C][/ROW]
[/TABLE]
Source: https://freestatistics.org/blog/index.php?pk=169174&T=0

Globally Unique Identifier (entire table): ba.freestatistics.org/blog/index.php?pk=169174&T=0

As an alternative you can also use a QR Code:  

The GUIDs for individual cells are displayed in the table below:

Summary of computational transaction
Raw Inputview raw input (R code)
Raw Outputview raw output of R engine
Computing time1 seconds
R Server'Gwilym Jenkins' @ jenkins.wessa.net


Standard Deviation-Mean Plot
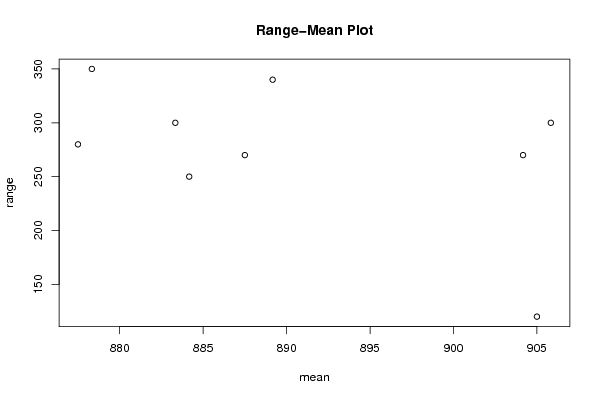
SectionMeanStandard DeviationRange
190542.9587540025842120
2884.16666666666777.1607923675482250
3877.592.1584603722405280
4905.83333333333390.900378370383300
5904.16666666666786.5981664023114270
6883.33333333333396.13752775282300
7878.333333333333104.083299973307350
8889.166666666667102.021239618686340
9887.583.0251878539387270

\begin{tabular}{lllllllll}
\hline
Standard Deviation-Mean Plot \tabularnewline
Section & Mean & Standard Deviation & Range \tabularnewline
1 & 905 & 42.9587540025842 & 120 \tabularnewline
2 & 884.166666666667 & 77.1607923675482 & 250 \tabularnewline
3 & 877.5 & 92.1584603722405 & 280 \tabularnewline
4 & 905.833333333333 & 90.900378370383 & 300 \tabularnewline
5 & 904.166666666667 & 86.5981664023114 & 270 \tabularnewline
6 & 883.333333333333 & 96.13752775282 & 300 \tabularnewline
7 & 878.333333333333 & 104.083299973307 & 350 \tabularnewline
8 & 889.166666666667 & 102.021239618686 & 340 \tabularnewline
9 & 887.5 & 83.0251878539387 & 270 \tabularnewline
\hline
\end{tabular}
%Source: https://freestatistics.org/blog/index.php?pk=169174&T=1

[TABLE]
[ROW][C]Standard Deviation-Mean Plot[/C][/ROW]
[ROW][C]Section[/C][C]Mean[/C][C]Standard Deviation[/C][C]Range[/C][/ROW]
[ROW][C]1[/C][C]905[/C][C]42.9587540025842[/C][C]120[/C][/ROW]
[ROW][C]2[/C][C]884.166666666667[/C][C]77.1607923675482[/C][C]250[/C][/ROW]
[ROW][C]3[/C][C]877.5[/C][C]92.1584603722405[/C][C]280[/C][/ROW]
[ROW][C]4[/C][C]905.833333333333[/C][C]90.900378370383[/C][C]300[/C][/ROW]
[ROW][C]5[/C][C]904.166666666667[/C][C]86.5981664023114[/C][C]270[/C][/ROW]
[ROW][C]6[/C][C]883.333333333333[/C][C]96.13752775282[/C][C]300[/C][/ROW]
[ROW][C]7[/C][C]878.333333333333[/C][C]104.083299973307[/C][C]350[/C][/ROW]
[ROW][C]8[/C][C]889.166666666667[/C][C]102.021239618686[/C][C]340[/C][/ROW]
[ROW][C]9[/C][C]887.5[/C][C]83.0251878539387[/C][C]270[/C][/ROW]
[/TABLE]
Source: https://freestatistics.org/blog/index.php?pk=169174&T=1

Globally Unique Identifier (entire table): ba.freestatistics.org/blog/index.php?pk=169174&T=1

As an alternative you can also use a QR Code:  

The GUIDs for individual cells are displayed in the table below:

Standard Deviation-Mean Plot
SectionMeanStandard DeviationRange
190542.9587540025842120
2884.16666666666777.1607923675482250
3877.592.1584603722405280
4905.83333333333390.900378370383300
5904.16666666666786.5981664023114270
6883.33333333333396.13752775282300
7878.333333333333104.083299973307350
8889.166666666667102.021239618686340
9887.583.0251878539387270


Regression: S.E.(k) = alpha + beta * Mean(k)
alpha823.049847745697
beta-0.827499042170612
S.D.0.517137450209238
T-STAT-1.60015299962476
p-value0.153597847849156

\begin{tabular}{lllllllll}
\hline
Regression: S.E.(k) = alpha + beta * Mean(k) \tabularnewline
alpha & 823.049847745697 \tabularnewline
beta & -0.827499042170612 \tabularnewline
S.D. & 0.517137450209238 \tabularnewline
T-STAT & -1.60015299962476 \tabularnewline
p-value & 0.153597847849156 \tabularnewline
\hline
\end{tabular}
%Source: https://freestatistics.org/blog/index.php?pk=169174&T=2

[TABLE]
[ROW][C]Regression: S.E.(k) = alpha + beta * Mean(k)[/C][/ROW]
[ROW][C]alpha[/C][C]823.049847745697[/C][/ROW]
[ROW][C]beta[/C][C]-0.827499042170612[/C][/ROW]
[ROW][C]S.D.[/C][C]0.517137450209238[/C][/ROW]
[ROW][C]T-STAT[/C][C]-1.60015299962476[/C][/ROW]
[ROW][C]p-value[/C][C]0.153597847849156[/C][/ROW]
[/TABLE]
Source: https://freestatistics.org/blog/index.php?pk=169174&T=2

Globally Unique Identifier (entire table): ba.freestatistics.org/blog/index.php?pk=169174&T=2

As an alternative you can also use a QR Code:  

The GUIDs for individual cells are displayed in the table below:

Regression: S.E.(k) = alpha + beta * Mean(k)
alpha823.049847745697
beta-0.827499042170612
S.D.0.517137450209238
T-STAT-1.60015299962476
p-value0.153597847849156


Regression: ln S.E.(k) = alpha + beta * ln Mean(k)
alpha76.8285917775368
beta-10.6599792892206
S.D.6.7804194624382
T-STAT-1.5721710652673
p-value0.159906974605227
Lambda11.6599792892206

\begin{tabular}{lllllllll}
\hline
Regression: ln S.E.(k) = alpha + beta * ln Mean(k) \tabularnewline
alpha & 76.8285917775368 \tabularnewline
beta & -10.6599792892206 \tabularnewline
S.D. & 6.7804194624382 \tabularnewline
T-STAT & -1.5721710652673 \tabularnewline
p-value & 0.159906974605227 \tabularnewline
Lambda & 11.6599792892206 \tabularnewline
\hline
\end{tabular}
%Source: https://freestatistics.org/blog/index.php?pk=169174&T=3

[TABLE]
[ROW][C]Regression: ln S.E.(k) = alpha + beta * ln Mean(k)[/C][/ROW]
[ROW][C]alpha[/C][C]76.8285917775368[/C][/ROW]
[ROW][C]beta[/C][C]-10.6599792892206[/C][/ROW]
[ROW][C]S.D.[/C][C]6.7804194624382[/C][/ROW]
[ROW][C]T-STAT[/C][C]-1.5721710652673[/C][/ROW]
[ROW][C]p-value[/C][C]0.159906974605227[/C][/ROW]
[ROW][C]Lambda[/C][C]11.6599792892206[/C][/ROW]
[/TABLE]
Source: https://freestatistics.org/blog/index.php?pk=169174&T=3

Globally Unique Identifier (entire table): ba.freestatistics.org/blog/index.php?pk=169174&T=3

As an alternative you can also use a QR Code:  

The GUIDs for individual cells are displayed in the table below:

Regression: ln S.E.(k) = alpha + beta * ln Mean(k)
alpha76.8285917775368
beta-10.6599792892206
S.D.6.7804194624382
T-STAT-1.5721710652673
p-value0.159906974605227
Lambda11.6599792892206


Parameters (Session):
par1 = 12 ;
Parameters (R input):
par1 = 12 ;
R code (references can be found in the software module):
par1 <- as.numeric(par1)
(n <- length(x))
(np <- floor(n / par1))
arr <- array(NA,dim=c(par1,np))
j <- 0
k <- 1
for (i in 1:(np*par1))
{
j = j + 1
arr[j,k] <- x[i]
if (j == par1) {
j = 0
k=k+1
}
}
arr
arr.mean <- array(NA,dim=np)
arr.sd <- array(NA,dim=np)
arr.range <- array(NA,dim=np)
for (j in 1:np)
{
arr.mean[j] <- mean(arr[,j],na.rm=TRUE)
arr.sd[j] <- sd(arr[,j],na.rm=TRUE)
arr.range[j] <- max(arr[,j],na.rm=TRUE) - min(arr[,j],na.rm=TRUE)
}
arr.mean
arr.sd
arr.range
(lm1 <- lm(arr.sd~arr.mean))
(lnlm1 <- lm(log(arr.sd)~log(arr.mean)))
(lm2 <- lm(arr.range~arr.mean))
bitmap(file='test1.png')
plot(arr.mean,arr.sd,main='Standard Deviation-Mean Plot',xlab='mean',ylab='standard deviation')
dev.off()
bitmap(file='test2.png')
plot(arr.mean,arr.range,main='Range-Mean Plot',xlab='mean',ylab='range')
dev.off()
load(file='createtable')
a<-table.start()
a<-table.row.start(a)
a<-table.element(a,'Standard Deviation-Mean Plot',4,TRUE)
a<-table.row.end(a)
a<-table.row.start(a)
a<-table.element(a,'Section',header=TRUE)
a<-table.element(a,'Mean',header=TRUE)
a<-table.element(a,'Standard Deviation',header=TRUE)
a<-table.element(a,'Range',header=TRUE)
a<-table.row.end(a)
for (j in 1:np) {
a<-table.row.start(a)
a<-table.element(a,j,header=TRUE)
a<-table.element(a,arr.mean[j])
a<-table.element(a,arr.sd[j] )
a<-table.element(a,arr.range[j] )
a<-table.row.end(a)
}
a<-table.end(a)
table.save(a,file='mytable.tab')
a<-table.start()
a<-table.row.start(a)
a<-table.element(a,'Regression: S.E.(k) = alpha + beta * Mean(k)',2,TRUE)
a<-table.row.end(a)
a<-table.row.start(a)
a<-table.element(a,'alpha',header=TRUE)
a<-table.element(a,lm1$coefficients[[1]])
a<-table.row.end(a)
a<-table.row.start(a)
a<-table.element(a,'beta',header=TRUE)
a<-table.element(a,lm1$coefficients[[2]])
a<-table.row.end(a)
a<-table.row.start(a)
a<-table.element(a,'S.D.',header=TRUE)
a<-table.element(a,summary(lm1)$coefficients[2,2])
a<-table.row.end(a)
a<-table.row.start(a)
a<-table.element(a,'T-STAT',header=TRUE)
a<-table.element(a,summary(lm1)$coefficients[2,3])
a<-table.row.end(a)
a<-table.row.start(a)
a<-table.element(a,'p-value',header=TRUE)
a<-table.element(a,summary(lm1)$coefficients[2,4])
a<-table.row.end(a)
a<-table.end(a)
table.save(a,file='mytable1.tab')
a<-table.start()
a<-table.row.start(a)
a<-table.element(a,'Regression: ln S.E.(k) = alpha + beta * ln Mean(k)',2,TRUE)
a<-table.row.end(a)
a<-table.row.start(a)
a<-table.element(a,'alpha',header=TRUE)
a<-table.element(a,lnlm1$coefficients[[1]])
a<-table.row.end(a)
a<-table.row.start(a)
a<-table.element(a,'beta',header=TRUE)
a<-table.element(a,lnlm1$coefficients[[2]])
a<-table.row.end(a)
a<-table.row.start(a)
a<-table.element(a,'S.D.',header=TRUE)
a<-table.element(a,summary(lnlm1)$coefficients[2,2])
a<-table.row.end(a)
a<-table.row.start(a)
a<-table.element(a,'T-STAT',header=TRUE)
a<-table.element(a,summary(lnlm1)$coefficients[2,3])
a<-table.row.end(a)
a<-table.row.start(a)
a<-table.element(a,'p-value',header=TRUE)
a<-table.element(a,summary(lnlm1)$coefficients[2,4])
a<-table.row.end(a)
a<-table.row.start(a)
a<-table.element(a,'Lambda',header=TRUE)
a<-table.element(a,1-lnlm1$coefficients[[2]])
a<-table.row.end(a)
a<-table.end(a)
table.save(a,file='mytable2.tab')