Free Statistics

of Irreproducible Research!

Author's title

Author*Unverified author*
R Software Modulerwasp_smp.wasp
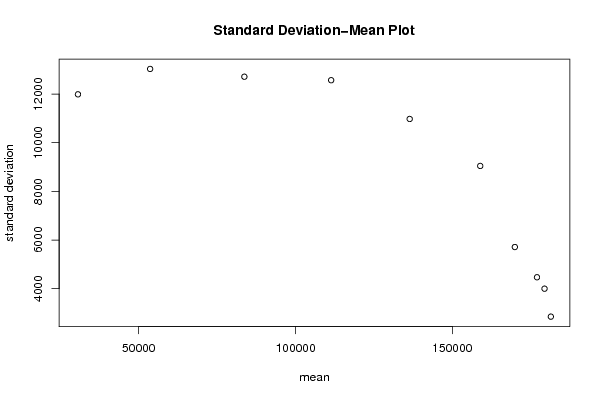
Title produced by softwareStandard Deviation-Mean Plot
Date of computationSat, 11 Aug 2012 09:57:33 -0400
Cite this page as followsStatistical Computations at FreeStatistics.org, Office for Research Development and Education, URL https://freestatistics.org/blog/index.php?v=date/2012/Aug/11/t134469347986epig4nofhhphu.htm/, Retrieved Mon, 06 May 2024 12:51:45 +0000
Statistical Computations at FreeStatistics.org, Office for Research Development and Education, URL https://freestatistics.org/blog/index.php?pk=169220, Retrieved Mon, 06 May 2024 12:51:45 +0000
QR Codes:

Original text written by user:
IsPrivate?No (this computation is public)
User-defined keywordsVan Puyenbroeck Willem
Estimated Impact144
Family? (F = Feedback message, R = changed R code, M = changed R Module, P = changed Parameters, D = changed Data)
-       [Standard Deviation-Mean Plot] [Tijdreeks 1 stap 26] [2012-08-11 13:57:33] [d94b10b2615af2e11b32dea0ad6a3c7b] [Current]
Feedback Forum

Post a new message
Dataseries X:
181896
181580
181234
180598
187123
186807
181896
178638
178954
178954
179269
179936
181580
179616
181580
179936
185158
187469
177656
175025
177305
176989
175025
175345
179269
178638
179269
179269
183545
184176
172398
172398
176989
174709
170785
172398
176327
174363
174047
169803
176007
177305
164545
164229
170785
167176
160967
163598
166509
167176
165212
161287
169456
169456
155078
154101
158025
150838
143616
145932
150838
146910
144283
138710
146247
146563
132190
131839
134470
126301
117465
121043
125950
120728
120412
115154
123670
125319
109266
105688
107968
99132
89981
92928
98470
91946
92928
89004
97172
98150
78524
77221
80799
71333
62817
65764
72950
64462
63799
57244
64462
66742
46448
46448
49391
41542
32706
37297
45466
36631
40244
35333
43186
45813
24853
23240
26502
18649
12444
15040


Summary of computational transaction
Raw Inputview raw input (R code)
Raw Outputview raw output of R engine
Computing time1 seconds
R Server'Herman Ole Andreas Wold' @ wold.wessa.net

\begin{tabular}{lllllllll}
\hline
Summary of computational transaction \tabularnewline
Raw Input & view raw input (R code)  \tabularnewline
Raw Output & view raw output of R engine  \tabularnewline
Computing time & 1 seconds \tabularnewline
R Server & 'Herman Ole Andreas Wold' @ wold.wessa.net \tabularnewline
\hline
\end{tabular}
%Source: https://freestatistics.org/blog/index.php?pk=169220&T=0

[TABLE]
[ROW][C]Summary of computational transaction[/C][/ROW]
[ROW][C]Raw Input[/C][C]view raw input (R code) [/C][/ROW]
[ROW][C]Raw Output[/C][C]view raw output of R engine [/C][/ROW]
[ROW][C]Computing time[/C][C]1 seconds[/C][/ROW]
[ROW][C]R Server[/C][C]'Herman Ole Andreas Wold' @ wold.wessa.net[/C][/ROW]
[/TABLE]
Source: https://freestatistics.org/blog/index.php?pk=169220&T=0

Globally Unique Identifier (entire table): ba.freestatistics.org/blog/index.php?pk=169220&T=0

As an alternative you can also use a QR Code:  

The GUIDs for individual cells are displayed in the table below:

Summary of computational transaction
Raw Inputview raw input (R code)
Raw Outputview raw output of R engine
Computing time1 seconds
R Server'Herman Ole Andreas Wold' @ wold.wessa.net


Standard Deviation-Mean Plot
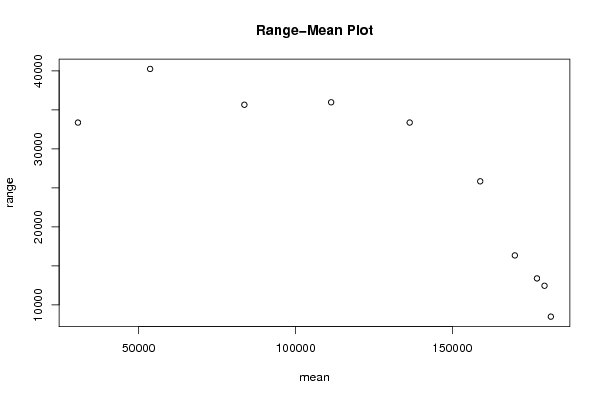
SectionMeanStandard DeviationRange
1181407.0833333332851.823992348298485
2179390.3333333334000.7807495613412444
3176986.9166666674470.797294327913391
4169929.3333333335713.65370022216338
5158890.59045.1121556944225840
6136404.91666666710976.241354177333373
7111349.66666666712568.848564702535969
883677.333333333312712.39776634235653
953624.2513031.961863922440244
1030616.7511989.350919765133369

\begin{tabular}{lllllllll}
\hline
Standard Deviation-Mean Plot \tabularnewline
Section & Mean & Standard Deviation & Range \tabularnewline
1 & 181407.083333333 & 2851.82399234829 & 8485 \tabularnewline
2 & 179390.333333333 & 4000.78074956134 & 12444 \tabularnewline
3 & 176986.916666667 & 4470.7972943279 & 13391 \tabularnewline
4 & 169929.333333333 & 5713.653700222 & 16338 \tabularnewline
5 & 158890.5 & 9045.11215569442 & 25840 \tabularnewline
6 & 136404.916666667 & 10976.2413541773 & 33373 \tabularnewline
7 & 111349.666666667 & 12568.8485647025 & 35969 \tabularnewline
8 & 83677.3333333333 & 12712.397766342 & 35653 \tabularnewline
9 & 53624.25 & 13031.9618639224 & 40244 \tabularnewline
10 & 30616.75 & 11989.3509197651 & 33369 \tabularnewline
\hline
\end{tabular}
%Source: https://freestatistics.org/blog/index.php?pk=169220&T=1

[TABLE]
[ROW][C]Standard Deviation-Mean Plot[/C][/ROW]
[ROW][C]Section[/C][C]Mean[/C][C]Standard Deviation[/C][C]Range[/C][/ROW]
[ROW][C]1[/C][C]181407.083333333[/C][C]2851.82399234829[/C][C]8485[/C][/ROW]
[ROW][C]2[/C][C]179390.333333333[/C][C]4000.78074956134[/C][C]12444[/C][/ROW]
[ROW][C]3[/C][C]176986.916666667[/C][C]4470.7972943279[/C][C]13391[/C][/ROW]
[ROW][C]4[/C][C]169929.333333333[/C][C]5713.653700222[/C][C]16338[/C][/ROW]
[ROW][C]5[/C][C]158890.5[/C][C]9045.11215569442[/C][C]25840[/C][/ROW]
[ROW][C]6[/C][C]136404.916666667[/C][C]10976.2413541773[/C][C]33373[/C][/ROW]
[ROW][C]7[/C][C]111349.666666667[/C][C]12568.8485647025[/C][C]35969[/C][/ROW]
[ROW][C]8[/C][C]83677.3333333333[/C][C]12712.397766342[/C][C]35653[/C][/ROW]
[ROW][C]9[/C][C]53624.25[/C][C]13031.9618639224[/C][C]40244[/C][/ROW]
[ROW][C]10[/C][C]30616.75[/C][C]11989.3509197651[/C][C]33369[/C][/ROW]
[/TABLE]
Source: https://freestatistics.org/blog/index.php?pk=169220&T=1

Globally Unique Identifier (entire table): ba.freestatistics.org/blog/index.php?pk=169220&T=1

As an alternative you can also use a QR Code:  

The GUIDs for individual cells are displayed in the table below:

Standard Deviation-Mean Plot
SectionMeanStandard DeviationRange
1181407.0833333332851.823992348298485
2179390.3333333334000.7807495613412444
3176986.9166666674470.797294327913391
4169929.3333333335713.65370022216338
5158890.59045.1121556944225840
6136404.91666666710976.241354177333373
7111349.66666666712568.848564702535969
883677.333333333312712.39776634235653
953624.2513031.961863922440244
1030616.7511989.350919765133369


Regression: S.E.(k) = alpha + beta * Mean(k)
alpha16729.7299912442
beta-0.0623393590904556
S.D.0.0134589047107074
T-STAT-4.63183003598061
p-value0.00168403022727226

\begin{tabular}{lllllllll}
\hline
Regression: S.E.(k) = alpha + beta * Mean(k) \tabularnewline
alpha & 16729.7299912442 \tabularnewline
beta & -0.0623393590904556 \tabularnewline
S.D. & 0.0134589047107074 \tabularnewline
T-STAT & -4.63183003598061 \tabularnewline
p-value & 0.00168403022727226 \tabularnewline
\hline
\end{tabular}
%Source: https://freestatistics.org/blog/index.php?pk=169220&T=2

[TABLE]
[ROW][C]Regression: S.E.(k) = alpha + beta * Mean(k)[/C][/ROW]
[ROW][C]alpha[/C][C]16729.7299912442[/C][/ROW]
[ROW][C]beta[/C][C]-0.0623393590904556[/C][/ROW]
[ROW][C]S.D.[/C][C]0.0134589047107074[/C][/ROW]
[ROW][C]T-STAT[/C][C]-4.63183003598061[/C][/ROW]
[ROW][C]p-value[/C][C]0.00168403022727226[/C][/ROW]
[/TABLE]
Source: https://freestatistics.org/blog/index.php?pk=169220&T=2

Globally Unique Identifier (entire table): ba.freestatistics.org/blog/index.php?pk=169220&T=2

As an alternative you can also use a QR Code:  

The GUIDs for individual cells are displayed in the table below:

Regression: S.E.(k) = alpha + beta * Mean(k)
alpha16729.7299912442
beta-0.0623393590904556
S.D.0.0134589047107074
T-STAT-4.63183003598061
p-value0.00168403022727226


Regression: ln S.E.(k) = alpha + beta * ln Mean(k)
alpha16.4893907265743
beta-0.648445226888153
S.D.0.240031778968445
T-STAT-2.70149740036464
p-value0.0270113309975439
Lambda1.64844522688815

\begin{tabular}{lllllllll}
\hline
Regression: ln S.E.(k) = alpha + beta * ln Mean(k) \tabularnewline
alpha & 16.4893907265743 \tabularnewline
beta & -0.648445226888153 \tabularnewline
S.D. & 0.240031778968445 \tabularnewline
T-STAT & -2.70149740036464 \tabularnewline
p-value & 0.0270113309975439 \tabularnewline
Lambda & 1.64844522688815 \tabularnewline
\hline
\end{tabular}
%Source: https://freestatistics.org/blog/index.php?pk=169220&T=3

[TABLE]
[ROW][C]Regression: ln S.E.(k) = alpha + beta * ln Mean(k)[/C][/ROW]
[ROW][C]alpha[/C][C]16.4893907265743[/C][/ROW]
[ROW][C]beta[/C][C]-0.648445226888153[/C][/ROW]
[ROW][C]S.D.[/C][C]0.240031778968445[/C][/ROW]
[ROW][C]T-STAT[/C][C]-2.70149740036464[/C][/ROW]
[ROW][C]p-value[/C][C]0.0270113309975439[/C][/ROW]
[ROW][C]Lambda[/C][C]1.64844522688815[/C][/ROW]
[/TABLE]
Source: https://freestatistics.org/blog/index.php?pk=169220&T=3

Globally Unique Identifier (entire table): ba.freestatistics.org/blog/index.php?pk=169220&T=3

As an alternative you can also use a QR Code:  

The GUIDs for individual cells are displayed in the table below:

Regression: ln S.E.(k) = alpha + beta * ln Mean(k)
alpha16.4893907265743
beta-0.648445226888153
S.D.0.240031778968445
T-STAT-2.70149740036464
p-value0.0270113309975439
Lambda1.64844522688815


Parameters (Session):
par1 = 12 ;
Parameters (R input):
par1 = 12 ;
R code (references can be found in the software module):
par1 <- as.numeric(par1)
(n <- length(x))
(np <- floor(n / par1))
arr <- array(NA,dim=c(par1,np))
j <- 0
k <- 1
for (i in 1:(np*par1))
{
j = j + 1
arr[j,k] <- x[i]
if (j == par1) {
j = 0
k=k+1
}
}
arr
arr.mean <- array(NA,dim=np)
arr.sd <- array(NA,dim=np)
arr.range <- array(NA,dim=np)
for (j in 1:np)
{
arr.mean[j] <- mean(arr[,j],na.rm=TRUE)
arr.sd[j] <- sd(arr[,j],na.rm=TRUE)
arr.range[j] <- max(arr[,j],na.rm=TRUE) - min(arr[,j],na.rm=TRUE)
}
arr.mean
arr.sd
arr.range
(lm1 <- lm(arr.sd~arr.mean))
(lnlm1 <- lm(log(arr.sd)~log(arr.mean)))
(lm2 <- lm(arr.range~arr.mean))
bitmap(file='test1.png')
plot(arr.mean,arr.sd,main='Standard Deviation-Mean Plot',xlab='mean',ylab='standard deviation')
dev.off()
bitmap(file='test2.png')
plot(arr.mean,arr.range,main='Range-Mean Plot',xlab='mean',ylab='range')
dev.off()
load(file='createtable')
a<-table.start()
a<-table.row.start(a)
a<-table.element(a,'Standard Deviation-Mean Plot',4,TRUE)
a<-table.row.end(a)
a<-table.row.start(a)
a<-table.element(a,'Section',header=TRUE)
a<-table.element(a,'Mean',header=TRUE)
a<-table.element(a,'Standard Deviation',header=TRUE)
a<-table.element(a,'Range',header=TRUE)
a<-table.row.end(a)
for (j in 1:np) {
a<-table.row.start(a)
a<-table.element(a,j,header=TRUE)
a<-table.element(a,arr.mean[j])
a<-table.element(a,arr.sd[j] )
a<-table.element(a,arr.range[j] )
a<-table.row.end(a)
}
a<-table.end(a)
table.save(a,file='mytable.tab')
a<-table.start()
a<-table.row.start(a)
a<-table.element(a,'Regression: S.E.(k) = alpha + beta * Mean(k)',2,TRUE)
a<-table.row.end(a)
a<-table.row.start(a)
a<-table.element(a,'alpha',header=TRUE)
a<-table.element(a,lm1$coefficients[[1]])
a<-table.row.end(a)
a<-table.row.start(a)
a<-table.element(a,'beta',header=TRUE)
a<-table.element(a,lm1$coefficients[[2]])
a<-table.row.end(a)
a<-table.row.start(a)
a<-table.element(a,'S.D.',header=TRUE)
a<-table.element(a,summary(lm1)$coefficients[2,2])
a<-table.row.end(a)
a<-table.row.start(a)
a<-table.element(a,'T-STAT',header=TRUE)
a<-table.element(a,summary(lm1)$coefficients[2,3])
a<-table.row.end(a)
a<-table.row.start(a)
a<-table.element(a,'p-value',header=TRUE)
a<-table.element(a,summary(lm1)$coefficients[2,4])
a<-table.row.end(a)
a<-table.end(a)
table.save(a,file='mytable1.tab')
a<-table.start()
a<-table.row.start(a)
a<-table.element(a,'Regression: ln S.E.(k) = alpha + beta * ln Mean(k)',2,TRUE)
a<-table.row.end(a)
a<-table.row.start(a)
a<-table.element(a,'alpha',header=TRUE)
a<-table.element(a,lnlm1$coefficients[[1]])
a<-table.row.end(a)
a<-table.row.start(a)
a<-table.element(a,'beta',header=TRUE)
a<-table.element(a,lnlm1$coefficients[[2]])
a<-table.row.end(a)
a<-table.row.start(a)
a<-table.element(a,'S.D.',header=TRUE)
a<-table.element(a,summary(lnlm1)$coefficients[2,2])
a<-table.row.end(a)
a<-table.row.start(a)
a<-table.element(a,'T-STAT',header=TRUE)
a<-table.element(a,summary(lnlm1)$coefficients[2,3])
a<-table.row.end(a)
a<-table.row.start(a)
a<-table.element(a,'p-value',header=TRUE)
a<-table.element(a,summary(lnlm1)$coefficients[2,4])
a<-table.row.end(a)
a<-table.row.start(a)
a<-table.element(a,'Lambda',header=TRUE)
a<-table.element(a,1-lnlm1$coefficients[[2]])
a<-table.row.end(a)
a<-table.end(a)
table.save(a,file='mytable2.tab')