Free Statistics

of Irreproducible Research!

Author's title

Author*The author of this computation has been verified*
R Software Modulerwasp_regression_trees1.wasp
Title produced by softwareRecursive Partitioning (Regression Trees)
Date of computationSun, 19 Aug 2012 08:34:28 -0400
Cite this page as followsStatistical Computations at FreeStatistics.org, Office for Research Development and Education, URL https://freestatistics.org/blog/index.php?v=date/2012/Aug/19/t1345379727711u3saiaca4nuk.htm/, Retrieved Sat, 27 Apr 2024 20:11:32 +0000
Statistical Computations at FreeStatistics.org, Office for Research Development and Education, URL https://freestatistics.org/blog/index.php?pk=169464, Retrieved Sat, 27 Apr 2024 20:11:32 +0000
QR Codes:

Original text written by user:
IsPrivate?No (this computation is public)
User-defined keywords
Estimated Impact206
Family? (F = Feedback message, R = changed R code, M = changed R Module, P = changed Parameters, D = changed Data)
-     [Kendall tau Correlation Matrix] [] [2010-12-05 17:44:33] [b98453cac15ba1066b407e146608df68]
- RMPD  [Recursive Partitioning (Regression Trees)] [] [2011-12-21 10:46:07] [2417ae1b112c0bd5f0a8e2d9469d5871]
- R P       [Recursive Partitioning (Regression Trees)] [Berekening 20] [2012-08-19 12:34:28] [0b94335bf72158573fe52322b9537409] [Current]
Feedback Forum

Post a new message
Dataseries X:
1772	158258	89	20465
1703	186930	57	33629
192	7215	18	1423
2294	129098	94	25629
3448	230587	134	54002
6813	508313	261	151036
1795	180745	56	33287
1680	185559	58	31172
1896	154581	43	28113
2917	290658	95	57803
1946	121844	75	49830
2148	184039	69	52143
1832	100324	98	21055
3059	209427	114	47007
1469	167592	57	28735
1565	154593	86	59147
1755	142018	56	78950
1234	77855	59	13497
2779	167047	87	46154
726	27997	24	53249
1048	73019	59	10726
2804	241082	99	83700
1760	195820	72	40400
2261	141899	53	33797
1848	145433	86	36205
1647	180241	31	30165
2081	202232	160	58534
1393	190230	91	44663
2741	354924	118	92556
2112	192399	44	40078
1684	182286	44	34711
1616	181590	45	31076
2227	133801	105	74608
3088	233686	123	58092
2388	219428	52	42009
1	0	1	0
2099	223044	63	36022
1669	100129	51	23333
2094	136733	47	53349
2153	249965	64	92596
2390	242379	71	49598
1701	145794	59	44093
983	96404	32	84205
2161	195891	78	63369
1276	117156	50	60132
1189	157787	94	37403
744	81293	31	24460
2231	224049	100	46456
2242	223789	87	66616
2638	160344	58	41554
658	48188	28	22346
1859	152206	68	30874
2489	294283	73	68701
2025	235223	78	35728
1911	195583	59	29010
1714	145942	54	23110
1851	208834	66	38844
980	93764	23	27084
1177	151985	66	35139
2809	190545	95	57476
1688	148922	60	33277
2097	132856	80	31141
1309	126107	60	61281
1243	112718	36	25820
1255	160930	34	23284
1293	99184	40	35378
2259	182022	69	74990
2897	138708	65	29653
1103	114408	38	64622
340	31970	15	4157
2791	225558	112	29245
1333	137011	71	50008
1441	113612	68	52338
1622	108641	70	13310
2649	162203	66	92901
1499	100098	44	10956
2302	174768	60	34241
2540	158459	97	75043
1000	80934	30	21152
1234	84971	71	42249
927	80545	68	42005
2176	287191	64	41152
956	62974	27	14399
1531	130982	38	28263
1013	75555	45	17215
1771	162154	54	48140
2613	226638	227	62897
1203	115019	110	22883
1303	105038	60	41622
1524	155537	52	40715
1829	153133	41	65897
2227	165577	76	76542
1233	151517	57	37477
1365	133686	58	53216
901	58128	38	40911
2319	245196	117	57021
1857	195576	70	73116
223	19349	12	3895
2390	225371	105	46609
1973	152796	76	29351
699	59117	28	2325
1062	91762	24	31747
1252	127987	52	32665
1154	113552	58	19249
823	85338	40	15292
596	27676	22	5842
1471	147984	47	33994
1130	122417	37	13018
0	0	0	0
1082	91529	32	98177
1134	107205	66	37941
1366	144664	44	31032
1452	136540	62	32683
869	76656	59	34545
78	3616	5	0
0	0	0	0
1127	183065	43	27525
1578	144636	83	66856
2018	156889	97	28549
919	113273	38	38610
778	43410	19	2781
1751	175774	72	41211
956	95401	41	22698
1875	118893	54	41194
731	60493	40	32689
285	19764	12	5752
1833	164062	55	26757
1147	132696	32	22527
1646	155367	54	44810
256	11796	9	0
98	10674	9	0
1403	142261	56	100674
41	6836	3	0
1786	154206	61	57786
42	5118	3	0
528	40248	16	5444
0	0	0	0
1072	122641	46	28470
1305	88837	38	61849
81	7131	4	0
261	9056	14	2179
934	76611	24	8019
1179	132697	50	39644
1147	100681	19	23494


Summary of computational transaction
Raw Inputview raw input (R code)
Raw Outputview raw output of R engine
Computing time3 seconds
R Server'AstonUniversity' @ aston.wessa.net

\begin{tabular}{lllllllll}
\hline
Summary of computational transaction \tabularnewline
Raw Input & view raw input (R code)  \tabularnewline
Raw Output & view raw output of R engine  \tabularnewline
Computing time & 3 seconds \tabularnewline
R Server & 'AstonUniversity' @ aston.wessa.net \tabularnewline
\hline
\end{tabular}
%Source: https://freestatistics.org/blog/index.php?pk=169464&T=0

[TABLE]
[ROW][C]Summary of computational transaction[/C][/ROW]
[ROW][C]Raw Input[/C][C]view raw input (R code) [/C][/ROW]
[ROW][C]Raw Output[/C][C]view raw output of R engine [/C][/ROW]
[ROW][C]Computing time[/C][C]3 seconds[/C][/ROW]
[ROW][C]R Server[/C][C]'AstonUniversity' @ aston.wessa.net[/C][/ROW]
[/TABLE]
Source: https://freestatistics.org/blog/index.php?pk=169464&T=0

Globally Unique Identifier (entire table): ba.freestatistics.org/blog/index.php?pk=169464&T=0

As an alternative you can also use a QR Code:  

The GUIDs for individual cells are displayed in the table below:

Summary of computational transaction
Raw Inputview raw input (R code)
Raw Outputview raw output of R engine
Computing time3 seconds
R Server'AstonUniversity' @ aston.wessa.net


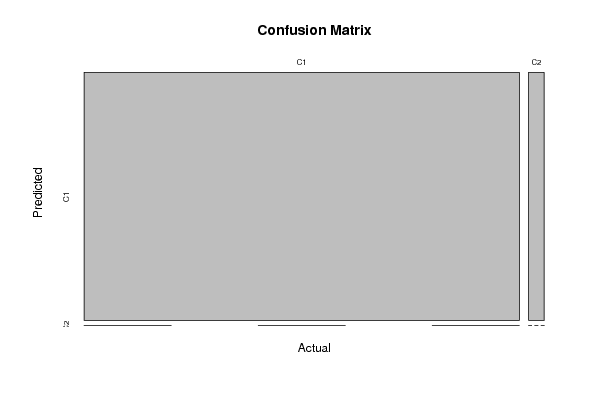
Confusion Matrix (predicted in columns / actuals in rows)
C1C2
C11390
C250

\begin{tabular}{lllllllll}
\hline
Confusion Matrix (predicted in columns / actuals in rows) \tabularnewline
 & C1 & C2 \tabularnewline
C1 & 139 & 0 \tabularnewline
C2 & 5 & 0 \tabularnewline
\hline
\end{tabular}
%Source: https://freestatistics.org/blog/index.php?pk=169464&T=1

[TABLE]
[ROW][C]Confusion Matrix (predicted in columns / actuals in rows)[/C][/ROW]
[ROW][C][/C][C]C1[/C][C]C2[/C][/ROW]
[ROW][C]C1[/C][C]139[/C][C]0[/C][/ROW]
[ROW][C]C2[/C][C]5[/C][C]0[/C][/ROW]
[/TABLE]
Source: https://freestatistics.org/blog/index.php?pk=169464&T=1

Globally Unique Identifier (entire table): ba.freestatistics.org/blog/index.php?pk=169464&T=1

As an alternative you can also use a QR Code:  

The GUIDs for individual cells are displayed in the table below:

Confusion Matrix (predicted in columns / actuals in rows)
C1C2
C11390
C250


Parameters (Session):
par1 = 2 ; par2 = equal ; par3 = 2 ; par4 = no ;
Parameters (R input):
par1 = 2 ; par2 = equal ; par3 = 2 ; par4 = no ;
R code (references can be found in the software module):
library(party)
library(Hmisc)
par1 <- as.numeric(par1)
par3 <- as.numeric(par3)
x <- data.frame(t(y))
is.data.frame(x)
x <- x[!is.na(x[,par1]),]
k <- length(x[1,])
n <- length(x[,1])
colnames(x)[par1]
x[,par1]
if (par2 == 'kmeans') {
cl <- kmeans(x[,par1], par3)
print(cl)
clm <- matrix(cbind(cl$centers,1:par3),ncol=2)
clm <- clm[sort.list(clm[,1]),]
for (i in 1:par3) {
cl$cluster[cl$cluster==clm[i,2]] <- paste('C',i,sep='')
}
cl$cluster <- as.factor(cl$cluster)
print(cl$cluster)
x[,par1] <- cl$cluster
}
if (par2 == 'quantiles') {
x[,par1] <- cut2(x[,par1],g=par3)
}
if (par2 == 'hclust') {
hc <- hclust(dist(x[,par1])^2, 'cen')
print(hc)
memb <- cutree(hc, k = par3)
dum <- c(mean(x[memb==1,par1]))
for (i in 2:par3) {
dum <- c(dum, mean(x[memb==i,par1]))
}
hcm <- matrix(cbind(dum,1:par3),ncol=2)
hcm <- hcm[sort.list(hcm[,1]),]
for (i in 1:par3) {
memb[memb==hcm[i,2]] <- paste('C',i,sep='')
}
memb <- as.factor(memb)
print(memb)
x[,par1] <- memb
}
if (par2=='equal') {
ed <- cut(as.numeric(x[,par1]),par3,labels=paste('C',1:par3,sep=''))
x[,par1] <- as.factor(ed)
}
table(x[,par1])
colnames(x)
colnames(x)[par1]
x[,par1]
if (par2 == 'none') {
m <- ctree(as.formula(paste(colnames(x)[par1],' ~ .',sep='')),data = x)
}
load(file='createtable')
if (par2 != 'none') {
m <- ctree(as.formula(paste('as.factor(',colnames(x)[par1],') ~ .',sep='')),data = x)
if (par4=='yes') {
a<-table.start()
a<-table.row.start(a)
a<-table.element(a,'10-Fold Cross Validation',3+2*par3,TRUE)
a<-table.row.end(a)
a<-table.row.start(a)
a<-table.element(a,'',1,TRUE)
a<-table.element(a,'Prediction (training)',par3+1,TRUE)
a<-table.element(a,'Prediction (testing)',par3+1,TRUE)
a<-table.row.end(a)
a<-table.row.start(a)
a<-table.element(a,'Actual',1,TRUE)
for (jjj in 1:par3) a<-table.element(a,paste('C',jjj,sep=''),1,TRUE)
a<-table.element(a,'CV',1,TRUE)
for (jjj in 1:par3) a<-table.element(a,paste('C',jjj,sep=''),1,TRUE)
a<-table.element(a,'CV',1,TRUE)
a<-table.row.end(a)
for (i in 1:10) {
ind <- sample(2, nrow(x), replace=T, prob=c(0.9,0.1))
m.ct <- ctree(as.formula(paste('as.factor(',colnames(x)[par1],') ~ .',sep='')),data =x[ind==1,])
if (i==1) {
m.ct.i.pred <- predict(m.ct, newdata=x[ind==1,])
m.ct.i.actu <- x[ind==1,par1]
m.ct.x.pred <- predict(m.ct, newdata=x[ind==2,])
m.ct.x.actu <- x[ind==2,par1]
} else {
m.ct.i.pred <- c(m.ct.i.pred,predict(m.ct, newdata=x[ind==1,]))
m.ct.i.actu <- c(m.ct.i.actu,x[ind==1,par1])
m.ct.x.pred <- c(m.ct.x.pred,predict(m.ct, newdata=x[ind==2,]))
m.ct.x.actu <- c(m.ct.x.actu,x[ind==2,par1])
}
}
print(m.ct.i.tab <- table(m.ct.i.actu,m.ct.i.pred))
numer <- 0
for (i in 1:par3) {
print(m.ct.i.tab[i,i] / sum(m.ct.i.tab[i,]))
numer <- numer + m.ct.i.tab[i,i]
}
print(m.ct.i.cp <- numer / sum(m.ct.i.tab))
print(m.ct.x.tab <- table(m.ct.x.actu,m.ct.x.pred))
numer <- 0
for (i in 1:par3) {
print(m.ct.x.tab[i,i] / sum(m.ct.x.tab[i,]))
numer <- numer + m.ct.x.tab[i,i]
}
print(m.ct.x.cp <- numer / sum(m.ct.x.tab))
for (i in 1:par3) {
a<-table.row.start(a)
a<-table.element(a,paste('C',i,sep=''),1,TRUE)
for (jjj in 1:par3) a<-table.element(a,m.ct.i.tab[i,jjj])
a<-table.element(a,round(m.ct.i.tab[i,i]/sum(m.ct.i.tab[i,]),4))
for (jjj in 1:par3) a<-table.element(a,m.ct.x.tab[i,jjj])
a<-table.element(a,round(m.ct.x.tab[i,i]/sum(m.ct.x.tab[i,]),4))
a<-table.row.end(a)
}
a<-table.row.start(a)
a<-table.element(a,'Overall',1,TRUE)
for (jjj in 1:par3) a<-table.element(a,'-')
a<-table.element(a,round(m.ct.i.cp,4))
for (jjj in 1:par3) a<-table.element(a,'-')
a<-table.element(a,round(m.ct.x.cp,4))
a<-table.row.end(a)
a<-table.end(a)
table.save(a,file='mytable3.tab')
}
}
m
bitmap(file='test1.png')
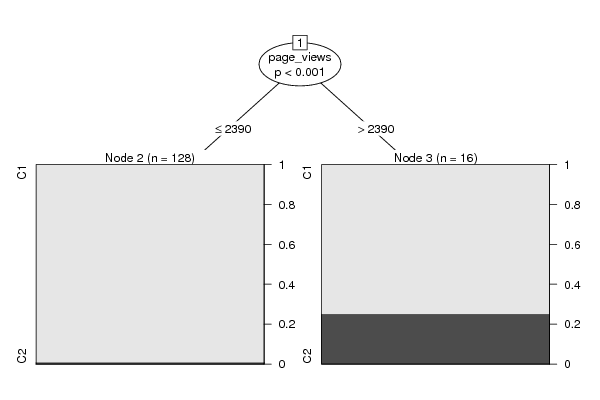
plot(m)
dev.off()
bitmap(file='test1a.png')
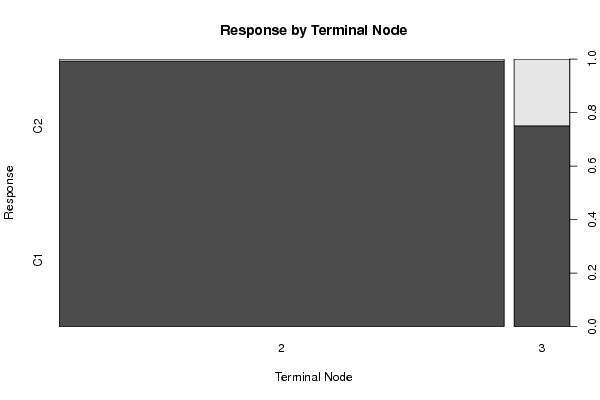
plot(x[,par1] ~ as.factor(where(m)),main='Response by Terminal Node',xlab='Terminal Node',ylab='Response')
dev.off()
if (par2 == 'none') {
forec <- predict(m)
result <- as.data.frame(cbind(x[,par1],forec,x[,par1]-forec))
colnames(result) <- c('Actuals','Forecasts','Residuals')
print(result)
}
if (par2 != 'none') {
print(cbind(as.factor(x[,par1]),predict(m)))
myt <- table(as.factor(x[,par1]),predict(m))
print(myt)
}
bitmap(file='test2.png')
if(par2=='none') {
op <- par(mfrow=c(2,2))
plot(density(result$Actuals),main='Kernel Density Plot of Actuals')
plot(density(result$Residuals),main='Kernel Density Plot of Residuals')
plot(result$Forecasts,result$Actuals,main='Actuals versus Predictions',xlab='Predictions',ylab='Actuals')
plot(density(result$Forecasts),main='Kernel Density Plot of Predictions')
par(op)
}
if(par2!='none') {
plot(myt,main='Confusion Matrix',xlab='Actual',ylab='Predicted')
}
dev.off()
if (par2 == 'none') {
detcoef <- cor(result$Forecasts,result$Actuals)
a<-table.start()
a<-table.row.start(a)
a<-table.element(a,'Goodness of Fit',2,TRUE)
a<-table.row.end(a)
a<-table.row.start(a)
a<-table.element(a,'Correlation',1,TRUE)
a<-table.element(a,round(detcoef,4))
a<-table.row.end(a)
a<-table.row.start(a)
a<-table.element(a,'R-squared',1,TRUE)
a<-table.element(a,round(detcoef*detcoef,4))
a<-table.row.end(a)
a<-table.row.start(a)
a<-table.element(a,'RMSE',1,TRUE)
a<-table.element(a,round(sqrt(mean((result$Residuals)^2)),4))
a<-table.row.end(a)
a<-table.end(a)
table.save(a,file='mytable1.tab')
a<-table.start()
a<-table.row.start(a)
a<-table.element(a,'Actuals, Predictions, and Residuals',4,TRUE)
a<-table.row.end(a)
a<-table.row.start(a)
a<-table.element(a,'#',header=TRUE)
a<-table.element(a,'Actuals',header=TRUE)
a<-table.element(a,'Forecasts',header=TRUE)
a<-table.element(a,'Residuals',header=TRUE)
a<-table.row.end(a)
for (i in 1:length(result$Actuals)) {
a<-table.row.start(a)
a<-table.element(a,i,header=TRUE)
a<-table.element(a,result$Actuals[i])
a<-table.element(a,result$Forecasts[i])
a<-table.element(a,result$Residuals[i])
a<-table.row.end(a)
}
a<-table.end(a)
table.save(a,file='mytable.tab')
}
if (par2 != 'none') {
a<-table.start()
a<-table.row.start(a)
a<-table.element(a,'Confusion Matrix (predicted in columns / actuals in rows)',par3+1,TRUE)
a<-table.row.end(a)
a<-table.row.start(a)
a<-table.element(a,'',1,TRUE)
for (i in 1:par3) {
a<-table.element(a,paste('C',i,sep=''),1,TRUE)
}
a<-table.row.end(a)
for (i in 1:par3) {
a<-table.row.start(a)
a<-table.element(a,paste('C',i,sep=''),1,TRUE)
for (j in 1:par3) {
a<-table.element(a,myt[i,j])
}
a<-table.row.end(a)
}
a<-table.end(a)
table.save(a,file='mytable2.tab')
}