Free Statistics

of Irreproducible Research!

Author's title

Author*The author of this computation has been verified*
R Software Modulerwasp_autocorrelation.wasp
Title produced by software(Partial) Autocorrelation Function
Date of computationThu, 30 Aug 2012 10:27:50 -0400
Cite this page as followsStatistical Computations at FreeStatistics.org, Office for Research Development and Education, URL https://freestatistics.org/blog/index.php?v=date/2012/Aug/30/t1346336889hdm9wni2x704rua.htm/, Retrieved Sun, 05 May 2024 10:39:13 +0000
Statistical Computations at FreeStatistics.org, Office for Research Development and Education, URL https://freestatistics.org/blog/index.php?pk=169602, Retrieved Sun, 05 May 2024 10:39:13 +0000
QR Codes:

Original text written by user:
IsPrivate?No (this computation is public)
User-defined keywords
Estimated Impact158
Family? (F = Feedback message, R = changed R code, M = changed R Module, P = changed Parameters, D = changed Data)
-     [Univariate Data Series] [] [2008-12-14 11:54:22] [d2d412c7f4d35ffbf5ee5ee89db327d4]
- RMP   [(Partial) Autocorrelation Function] [] [2011-12-06 20:17:24] [b98453cac15ba1066b407e146608df68]
- R PD      [(Partial) Autocorrelation Function] [ACF] [2012-08-30 14:27:50] [c53b4e73f301bc561a9fa0b8f84a7890] [Current]
Feedback Forum

Post a new message
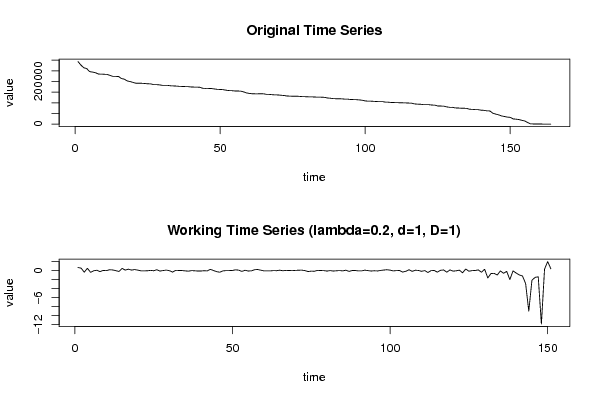
Dataseries X:
293403
277108
264020
260646
246100
244051
241329
234730
234509
233482
233406
228548
223914
223696
223004
213765
210554
202204
199512
195304
191467
191381
191276
190410
188967
188780
185139
185039
184217
181853
181379
181344
179562
178863
178140
176789
176460
175877
175568
174107
173587
173260
172684
167845
167131
167105
166790
164767
162810
162336
161678
158980
157250
156833
155383
154991
154730
151503
146455
143937
142339
142146
142141
142069
141933
139350
139144
137793
136911
136548
135171
134043
131876
131122
130539
130533
130232
129100
128655
128066
127619
127324
126683
126681
125971
125366
122433
121135
119291
118958
118807
118372
116900
116775
115199
114928
114397
113337
111664
108715
107342
107335
106539
105615
105410
105324
103012
102531
101324
100885
100672
99946
99768
99246
98599
98030
94763
93340
93125
91185
90961
90938
89318
88817
84944
84572
84256
80953
78800
78776
75812
75426
74398
74112
73567
69471
68948
67746
67507
65029
64320
61857
61499
50999
46660
43287
38214
35523
32750
31414
24188
22938
21054
17547
14688
7199
969
455
203
98
0
0
0
0


Summary of computational transaction
Raw Inputview raw input (R code)
Raw Outputview raw output of R engine
Computing time2 seconds
R Server'AstonUniversity' @ aston.wessa.net

\begin{tabular}{lllllllll}
\hline
Summary of computational transaction \tabularnewline
Raw Input & view raw input (R code)  \tabularnewline
Raw Output & view raw output of R engine  \tabularnewline
Computing time & 2 seconds \tabularnewline
R Server & 'AstonUniversity' @ aston.wessa.net \tabularnewline
\hline
\end{tabular}
%Source: https://freestatistics.org/blog/index.php?pk=169602&T=0

[TABLE]
[ROW][C]Summary of computational transaction[/C][/ROW]
[ROW][C]Raw Input[/C][C]view raw input (R code) [/C][/ROW]
[ROW][C]Raw Output[/C][C]view raw output of R engine [/C][/ROW]
[ROW][C]Computing time[/C][C]2 seconds[/C][/ROW]
[ROW][C]R Server[/C][C]'AstonUniversity' @ aston.wessa.net[/C][/ROW]
[/TABLE]
Source: https://freestatistics.org/blog/index.php?pk=169602&T=0

Globally Unique Identifier (entire table): ba.freestatistics.org/blog/index.php?pk=169602&T=0

As an alternative you can also use a QR Code:  

The GUIDs for individual cells are displayed in the table below:

Summary of computational transaction
Raw Inputview raw input (R code)
Raw Outputview raw output of R engine
Computing time2 seconds
R Server'AstonUniversity' @ aston.wessa.net


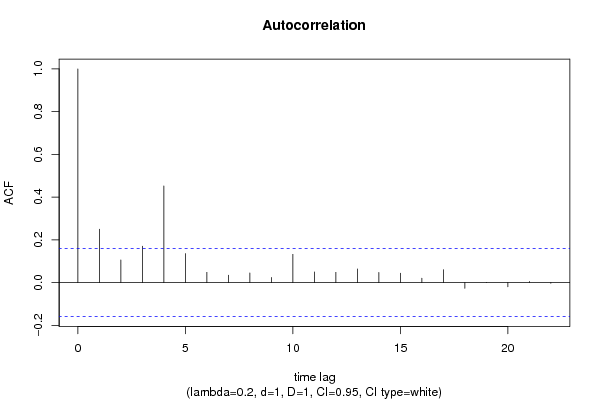
Autocorrelation Function
Time lag kACF(k)T-STATP-value
10.2500183.07230.00126
20.105851.30070.09767
30.1699852.08880.019201
40.4523985.55920
50.1357641.66830.048664
60.0479280.5890.278387
70.0347070.42650.335182
80.0446020.54810.292222
90.0241970.29730.383309
100.1321011.62330.053307
110.0497780.61170.270836
120.047960.58930.278256
130.0640290.78680.216317
140.0469350.57680.282484
150.0437930.53810.295639
160.0207790.25530.399403
170.060440.74270.22941
18-0.026296-0.32310.373519
19-0.000231-0.00280.498869
20-0.019624-0.24110.404887
210.0050050.06150.475521
22-0.00285-0.0350.486055

\begin{tabular}{lllllllll}
\hline
Autocorrelation Function \tabularnewline
Time lag k & ACF(k) & T-STAT & P-value \tabularnewline
1 & 0.250018 & 3.0723 & 0.00126 \tabularnewline
2 & 0.10585 & 1.3007 & 0.09767 \tabularnewline
3 & 0.169985 & 2.0888 & 0.019201 \tabularnewline
4 & 0.452398 & 5.5592 & 0 \tabularnewline
5 & 0.135764 & 1.6683 & 0.048664 \tabularnewline
6 & 0.047928 & 0.589 & 0.278387 \tabularnewline
7 & 0.034707 & 0.4265 & 0.335182 \tabularnewline
8 & 0.044602 & 0.5481 & 0.292222 \tabularnewline
9 & 0.024197 & 0.2973 & 0.383309 \tabularnewline
10 & 0.132101 & 1.6233 & 0.053307 \tabularnewline
11 & 0.049778 & 0.6117 & 0.270836 \tabularnewline
12 & 0.04796 & 0.5893 & 0.278256 \tabularnewline
13 & 0.064029 & 0.7868 & 0.216317 \tabularnewline
14 & 0.046935 & 0.5768 & 0.282484 \tabularnewline
15 & 0.043793 & 0.5381 & 0.295639 \tabularnewline
16 & 0.020779 & 0.2553 & 0.399403 \tabularnewline
17 & 0.06044 & 0.7427 & 0.22941 \tabularnewline
18 & -0.026296 & -0.3231 & 0.373519 \tabularnewline
19 & -0.000231 & -0.0028 & 0.498869 \tabularnewline
20 & -0.019624 & -0.2411 & 0.404887 \tabularnewline
21 & 0.005005 & 0.0615 & 0.475521 \tabularnewline
22 & -0.00285 & -0.035 & 0.486055 \tabularnewline
\hline
\end{tabular}
%Source: https://freestatistics.org/blog/index.php?pk=169602&T=1

[TABLE]
[ROW][C]Autocorrelation Function[/C][/ROW]
[ROW][C]Time lag k[/C][C]ACF(k)[/C][C]T-STAT[/C][C]P-value[/C][/ROW]
[ROW][C]1[/C][C]0.250018[/C][C]3.0723[/C][C]0.00126[/C][/ROW]
[ROW][C]2[/C][C]0.10585[/C][C]1.3007[/C][C]0.09767[/C][/ROW]
[ROW][C]3[/C][C]0.169985[/C][C]2.0888[/C][C]0.019201[/C][/ROW]
[ROW][C]4[/C][C]0.452398[/C][C]5.5592[/C][C]0[/C][/ROW]
[ROW][C]5[/C][C]0.135764[/C][C]1.6683[/C][C]0.048664[/C][/ROW]
[ROW][C]6[/C][C]0.047928[/C][C]0.589[/C][C]0.278387[/C][/ROW]
[ROW][C]7[/C][C]0.034707[/C][C]0.4265[/C][C]0.335182[/C][/ROW]
[ROW][C]8[/C][C]0.044602[/C][C]0.5481[/C][C]0.292222[/C][/ROW]
[ROW][C]9[/C][C]0.024197[/C][C]0.2973[/C][C]0.383309[/C][/ROW]
[ROW][C]10[/C][C]0.132101[/C][C]1.6233[/C][C]0.053307[/C][/ROW]
[ROW][C]11[/C][C]0.049778[/C][C]0.6117[/C][C]0.270836[/C][/ROW]
[ROW][C]12[/C][C]0.04796[/C][C]0.5893[/C][C]0.278256[/C][/ROW]
[ROW][C]13[/C][C]0.064029[/C][C]0.7868[/C][C]0.216317[/C][/ROW]
[ROW][C]14[/C][C]0.046935[/C][C]0.5768[/C][C]0.282484[/C][/ROW]
[ROW][C]15[/C][C]0.043793[/C][C]0.5381[/C][C]0.295639[/C][/ROW]
[ROW][C]16[/C][C]0.020779[/C][C]0.2553[/C][C]0.399403[/C][/ROW]
[ROW][C]17[/C][C]0.06044[/C][C]0.7427[/C][C]0.22941[/C][/ROW]
[ROW][C]18[/C][C]-0.026296[/C][C]-0.3231[/C][C]0.373519[/C][/ROW]
[ROW][C]19[/C][C]-0.000231[/C][C]-0.0028[/C][C]0.498869[/C][/ROW]
[ROW][C]20[/C][C]-0.019624[/C][C]-0.2411[/C][C]0.404887[/C][/ROW]
[ROW][C]21[/C][C]0.005005[/C][C]0.0615[/C][C]0.475521[/C][/ROW]
[ROW][C]22[/C][C]-0.00285[/C][C]-0.035[/C][C]0.486055[/C][/ROW]
[/TABLE]
Source: https://freestatistics.org/blog/index.php?pk=169602&T=1

Globally Unique Identifier (entire table): ba.freestatistics.org/blog/index.php?pk=169602&T=1

As an alternative you can also use a QR Code:  

The GUIDs for individual cells are displayed in the table below:

Autocorrelation Function
Time lag kACF(k)T-STATP-value
10.2500183.07230.00126
20.105851.30070.09767
30.1699852.08880.019201
40.4523985.55920
50.1357641.66830.048664
60.0479280.5890.278387
70.0347070.42650.335182
80.0446020.54810.292222
90.0241970.29730.383309
100.1321011.62330.053307
110.0497780.61170.270836
120.047960.58930.278256
130.0640290.78680.216317
140.0469350.57680.282484
150.0437930.53810.295639
160.0207790.25530.399403
170.060440.74270.22941
18-0.026296-0.32310.373519
19-0.000231-0.00280.498869
20-0.019624-0.24110.404887
210.0050050.06150.475521
22-0.00285-0.0350.486055


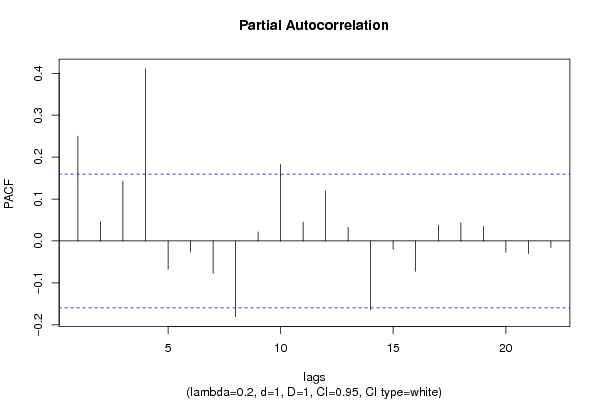
Partial Autocorrelation Function
Time lag kPACF(k)T-STATP-value
10.2500183.07230.00126
20.0462310.56810.285408
30.1423711.74950.04112
40.410345.04231e-06
5-0.067606-0.83080.203711
6-0.026348-0.32380.373279
7-0.07721-0.94880.172126
8-0.180625-2.21960.01397
90.0212450.26110.397199
100.1832472.25180.01289
110.0448270.55080.291278
120.1192811.46570.072398
130.0324720.3990.345221
14-0.164782-2.02490.022321
15-0.019824-0.24360.403934
16-0.07257-0.89180.18697
170.0377190.46350.321836
180.0435860.53560.296515
190.0342930.42140.337031
20-0.02696-0.33130.370442
21-0.030232-0.37150.355393
22-0.015352-0.18860.425312

\begin{tabular}{lllllllll}
\hline
Partial Autocorrelation Function \tabularnewline
Time lag k & PACF(k) & T-STAT & P-value \tabularnewline
1 & 0.250018 & 3.0723 & 0.00126 \tabularnewline
2 & 0.046231 & 0.5681 & 0.285408 \tabularnewline
3 & 0.142371 & 1.7495 & 0.04112 \tabularnewline
4 & 0.41034 & 5.0423 & 1e-06 \tabularnewline
5 & -0.067606 & -0.8308 & 0.203711 \tabularnewline
6 & -0.026348 & -0.3238 & 0.373279 \tabularnewline
7 & -0.07721 & -0.9488 & 0.172126 \tabularnewline
8 & -0.180625 & -2.2196 & 0.01397 \tabularnewline
9 & 0.021245 & 0.2611 & 0.397199 \tabularnewline
10 & 0.183247 & 2.2518 & 0.01289 \tabularnewline
11 & 0.044827 & 0.5508 & 0.291278 \tabularnewline
12 & 0.119281 & 1.4657 & 0.072398 \tabularnewline
13 & 0.032472 & 0.399 & 0.345221 \tabularnewline
14 & -0.164782 & -2.0249 & 0.022321 \tabularnewline
15 & -0.019824 & -0.2436 & 0.403934 \tabularnewline
16 & -0.07257 & -0.8918 & 0.18697 \tabularnewline
17 & 0.037719 & 0.4635 & 0.321836 \tabularnewline
18 & 0.043586 & 0.5356 & 0.296515 \tabularnewline
19 & 0.034293 & 0.4214 & 0.337031 \tabularnewline
20 & -0.02696 & -0.3313 & 0.370442 \tabularnewline
21 & -0.030232 & -0.3715 & 0.355393 \tabularnewline
22 & -0.015352 & -0.1886 & 0.425312 \tabularnewline
\hline
\end{tabular}
%Source: https://freestatistics.org/blog/index.php?pk=169602&T=2

[TABLE]
[ROW][C]Partial Autocorrelation Function[/C][/ROW]
[ROW][C]Time lag k[/C][C]PACF(k)[/C][C]T-STAT[/C][C]P-value[/C][/ROW]
[ROW][C]1[/C][C]0.250018[/C][C]3.0723[/C][C]0.00126[/C][/ROW]
[ROW][C]2[/C][C]0.046231[/C][C]0.5681[/C][C]0.285408[/C][/ROW]
[ROW][C]3[/C][C]0.142371[/C][C]1.7495[/C][C]0.04112[/C][/ROW]
[ROW][C]4[/C][C]0.41034[/C][C]5.0423[/C][C]1e-06[/C][/ROW]
[ROW][C]5[/C][C]-0.067606[/C][C]-0.8308[/C][C]0.203711[/C][/ROW]
[ROW][C]6[/C][C]-0.026348[/C][C]-0.3238[/C][C]0.373279[/C][/ROW]
[ROW][C]7[/C][C]-0.07721[/C][C]-0.9488[/C][C]0.172126[/C][/ROW]
[ROW][C]8[/C][C]-0.180625[/C][C]-2.2196[/C][C]0.01397[/C][/ROW]
[ROW][C]9[/C][C]0.021245[/C][C]0.2611[/C][C]0.397199[/C][/ROW]
[ROW][C]10[/C][C]0.183247[/C][C]2.2518[/C][C]0.01289[/C][/ROW]
[ROW][C]11[/C][C]0.044827[/C][C]0.5508[/C][C]0.291278[/C][/ROW]
[ROW][C]12[/C][C]0.119281[/C][C]1.4657[/C][C]0.072398[/C][/ROW]
[ROW][C]13[/C][C]0.032472[/C][C]0.399[/C][C]0.345221[/C][/ROW]
[ROW][C]14[/C][C]-0.164782[/C][C]-2.0249[/C][C]0.022321[/C][/ROW]
[ROW][C]15[/C][C]-0.019824[/C][C]-0.2436[/C][C]0.403934[/C][/ROW]
[ROW][C]16[/C][C]-0.07257[/C][C]-0.8918[/C][C]0.18697[/C][/ROW]
[ROW][C]17[/C][C]0.037719[/C][C]0.4635[/C][C]0.321836[/C][/ROW]
[ROW][C]18[/C][C]0.043586[/C][C]0.5356[/C][C]0.296515[/C][/ROW]
[ROW][C]19[/C][C]0.034293[/C][C]0.4214[/C][C]0.337031[/C][/ROW]
[ROW][C]20[/C][C]-0.02696[/C][C]-0.3313[/C][C]0.370442[/C][/ROW]
[ROW][C]21[/C][C]-0.030232[/C][C]-0.3715[/C][C]0.355393[/C][/ROW]
[ROW][C]22[/C][C]-0.015352[/C][C]-0.1886[/C][C]0.425312[/C][/ROW]
[/TABLE]
Source: https://freestatistics.org/blog/index.php?pk=169602&T=2

Globally Unique Identifier (entire table): ba.freestatistics.org/blog/index.php?pk=169602&T=2

As an alternative you can also use a QR Code:  

The GUIDs for individual cells are displayed in the table below:

Partial Autocorrelation Function
Time lag kPACF(k)T-STATP-value
10.2500183.07230.00126
20.0462310.56810.285408
30.1423711.74950.04112
40.410345.04231e-06
5-0.067606-0.83080.203711
6-0.026348-0.32380.373279
7-0.07721-0.94880.172126
8-0.180625-2.21960.01397
90.0212450.26110.397199
100.1832472.25180.01289
110.0448270.55080.291278
120.1192811.46570.072398
130.0324720.3990.345221
14-0.164782-2.02490.022321
15-0.019824-0.24360.403934
16-0.07257-0.89180.18697
170.0377190.46350.321836
180.0435860.53560.296515
190.0342930.42140.337031
20-0.02696-0.33130.370442
21-0.030232-0.37150.355393
22-0.015352-0.18860.425312


Parameters (Session):
par1 = 8 ; par2 = 0 ;
Parameters (R input):
par1 = Default ; par2 = 0.2 ; par3 = 1 ; par4 = 1 ; par5 = 12 ; par6 = White Noise ; par7 = 0.95 ; par8 = ;
R code (references can be found in the software module):
par8 <- ''
par7 <- '0.95'
par6 <- 'White Noise'
par5 <- '12'
par4 <- '1'
par3 <- '1'
par2 <- '0.2'
par1 <- 'Default'
if (par1 == 'Default') {
par1 = 10*log10(length(x))
} else {
par1 <- as.numeric(par1)
}
par2 <- as.numeric(par2)
par3 <- as.numeric(par3)
par4 <- as.numeric(par4)
par5 <- as.numeric(par5)
if (par6 == 'White Noise') par6 <- 'white' else par6 <- 'ma'
par7 <- as.numeric(par7)
if (par8 != '') par8 <- as.numeric(par8)
ox <- x
if (par8 == '') {
if (par2 == 0) {
x <- log(x)
} else {
x <- (x ^ par2 - 1) / par2
}
} else {
x <- log(x,base=par8)
}
if (par3 > 0) x <- diff(x,lag=1,difference=par3)
if (par4 > 0) x <- diff(x,lag=par5,difference=par4)
bitmap(file='picts.png')
op <- par(mfrow=c(2,1))
plot(ox,type='l',main='Original Time Series',xlab='time',ylab='value')
if (par8=='') {
mytitle <- paste('Working Time Series (lambda=',par2,', d=',par3,', D=',par4,')',sep='')
mysub <- paste('(lambda=',par2,', d=',par3,', D=',par4,', CI=', par7, ', CI type=',par6,')',sep='')
} else {
mytitle <- paste('Working Time Series (base=',par8,', d=',par3,', D=',par4,')',sep='')
mysub <- paste('(base=',par8,', d=',par3,', D=',par4,', CI=', par7, ', CI type=',par6,')',sep='')
}
plot(x,type='l', main=mytitle,xlab='time',ylab='value')
par(op)
dev.off()
bitmap(file='pic1.png')
racf <- acf(x, par1, main='Autocorrelation', xlab='time lag', ylab='ACF', ci.type=par6, ci=par7, sub=mysub)
dev.off()
bitmap(file='pic2.png')
rpacf <- pacf(x,par1,main='Partial Autocorrelation',xlab='lags',ylab='PACF',sub=mysub)
dev.off()
(myacf <- c(racf$acf))
(mypacf <- c(rpacf$acf))
lengthx <- length(x)
sqrtn <- sqrt(lengthx)
load(file='createtable')
a<-table.start()
a<-table.row.start(a)
a<-table.element(a,'Autocorrelation Function',4,TRUE)
a<-table.row.end(a)
a<-table.row.start(a)
a<-table.element(a,'Time lag k',header=TRUE)
a<-table.element(a,hyperlink('basics.htm','ACF(k)','click here for more information about the Autocorrelation Function'),header=TRUE)
a<-table.element(a,'T-STAT',header=TRUE)
a<-table.element(a,'P-value',header=TRUE)
a<-table.row.end(a)
for (i in 2:(par1+1)) {
a<-table.row.start(a)
a<-table.element(a,i-1,header=TRUE)
a<-table.element(a,round(myacf[i],6))
mytstat <- myacf[i]*sqrtn
a<-table.element(a,round(mytstat,4))
a<-table.element(a,round(1-pt(abs(mytstat),lengthx),6))
a<-table.row.end(a)
}
a<-table.end(a)
table.save(a,file='mytable.tab')
a<-table.start()
a<-table.row.start(a)
a<-table.element(a,'Partial Autocorrelation Function',4,TRUE)
a<-table.row.end(a)
a<-table.row.start(a)
a<-table.element(a,'Time lag k',header=TRUE)
a<-table.element(a,hyperlink('basics.htm','PACF(k)','click here for more information about the Partial Autocorrelation Function'),header=TRUE)
a<-table.element(a,'T-STAT',header=TRUE)
a<-table.element(a,'P-value',header=TRUE)
a<-table.row.end(a)
for (i in 1:par1) {
a<-table.row.start(a)
a<-table.element(a,i,header=TRUE)
a<-table.element(a,round(mypacf[i],6))
mytstat <- mypacf[i]*sqrtn
a<-table.element(a,round(mytstat,4))
a<-table.element(a,round(1-pt(abs(mytstat),lengthx),6))
a<-table.row.end(a)
}
a<-table.end(a)
table.save(a,file='mytable1.tab')