Free Statistics

of Irreproducible Research!

Author's title

Author*The author of this computation has been verified*
R Software Modulerwasp_histogram.wasp
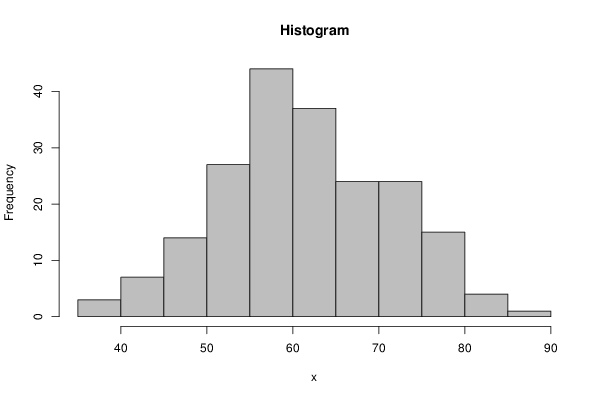
Title produced by softwareHistogram
Date of computationWed, 12 Dec 2012 10:30:49 -0500
Cite this page as followsStatistical Computations at FreeStatistics.org, Office for Research Development and Education, URL https://freestatistics.org/blog/index.php?v=date/2012/Dec/12/t1355326291w9dq30amvv5cd6g.htm/, Retrieved Sun, 28 Apr 2024 21:03:12 +0000
Statistical Computations at FreeStatistics.org, Office for Research Development and Education, URL https://freestatistics.org/blog/index.php?pk=198935, Retrieved Sun, 28 Apr 2024 21:03:12 +0000
QR Codes:

Original text written by user:
IsPrivate?No (this computation is public)
User-defined keywords
Estimated Impact89
Family? (F = Feedback message, R = changed R code, M = changed R Module, P = changed Parameters, D = changed Data)
-     [Testing Mean with unknown Variance - Critical Value] [] [2010-10-25 13:12:27] [b98453cac15ba1066b407e146608df68]
- RMPD    [Histogram] [Histogram_Groep1:...] [2012-12-12 15:30:49] [5f6cd87c5735ffe37dbfae854ce1e663] [Current]
Feedback Forum

Post a new message
Dataseries X:
50,4687229
80,82533683
46,11492629
59,11183295
72,57189979
59,18400135
71,06095624
65,38152563
59,06958692
66,20129867
64,6858986
72,99797532
60,71624982
68,0568725
42,09837031
56,82115686
47,58671609
51,96638782
71,44862836
70,18029252
72,87608029
67,17250259
67,32770786
58,66613507
58,14931471
63,95264124
55,63866595
49,66304702
70,27449343
63,95677944
76,92992555
50,09332896
74,06788215
72,53151822
61,36475364
54,81988198
76,63588591
62,71780891
59,3726874
74,96728146
51,1909299
62,24285941
51,90497419
57,82769464
60,81138296
64,81263669
46,29716629
64,36722303
82,22550393
44,18275027
62,13708518
70,71637143
67,0072474
60,61504579
58,48374728
65,47104264
57,33533969
67,10439281
50,60519258
60,46795776
72,09243692
63,17402282
52,75707978
57,13026
48,45360096
57,51405539
56,96485702
64,44140369
63,21266498
53,39395345
59,42939439
52,74016318
75,54781193
63,56022838
56,23114491
59,68363227
63,16115347
83,27105904
71,85585461
67,79816673
52,05899712
58,53171175
75,44358383
50,09583007
46,05449036
71,43243935
57,17168748
37,94311639
62,46701575
44,37488102
67,3127012
64,26477982
59,76398612
51,54076704
68,66564278
58,09325573
69,39005531
63,04396508
58,98579972
48,70616764
59,93229949
74,1465307
62,18641389
65,70894372
63,64593689
56,21225015
77,00091161
70,11756012
72,3081918
65,06672677
65,57707835
47,85015123
70,24473022
58,38229314
79,52794264
72,24157131
65,7116381
60,64035248
65,81821951
54,76731318
59,41330771
59,22928282
62,45281626
57,18284016
60,30947831
45,11430022
70,24473022
88,43953553
47,27662387
61,80945108
78,78115654
57,17886112
64,57773695
60,65950871
54,70405783
49,32157723
53,39204351
47,40954652
49,20588951
56,45851858
76,55103006
51,25839167
63,56267265
65,58511601
80,29364623
38,56139089
37,31792973
55,7360501
42,23347575
62,58232831
55,28505441
50,05201516
60,16179911
69,16070348
58,13919658
63,74175215
55,76535856
55,62771791
55,08490873
59,70582394
44,22799763
51,16271283
56,72202193
55,31069079
68,60566161
57,29726596
72,20605554
75,10943548
67,24887741
50,66803866
55,12801878
45,47073119
76,89477358
54,25049282
60,30336196
54,4675551
66,14852524
44,90011421
63,87748287
75,95508365
76,89477358
63,32159971
70,49220373
69,96933522
51,29531716
70,21116987
54,80675115
61,18196795
71,59271505
59,77239895
75,34849616
75,00725375
69,59289537
54,91760718
57,6282993
76,15489964
44,17738425
53,37205736
57,88874447
50,36945155


Summary of computational transaction
Raw Inputview raw input (R code)
Raw Outputview raw output of R engine
Computing time2 seconds
R Server'George Udny Yule' @ yule.wessa.net

\begin{tabular}{lllllllll}
\hline
Summary of computational transaction \tabularnewline
Raw Input & view raw input (R code)  \tabularnewline
Raw Output & view raw output of R engine  \tabularnewline
Computing time & 2 seconds \tabularnewline
R Server & 'George Udny Yule' @ yule.wessa.net \tabularnewline
\hline
\end{tabular}
%Source: https://freestatistics.org/blog/index.php?pk=198935&T=0

[TABLE]
[ROW][C]Summary of computational transaction[/C][/ROW]
[ROW][C]Raw Input[/C][C]view raw input (R code) [/C][/ROW]
[ROW][C]Raw Output[/C][C]view raw output of R engine [/C][/ROW]
[ROW][C]Computing time[/C][C]2 seconds[/C][/ROW]
[ROW][C]R Server[/C][C]'George Udny Yule' @ yule.wessa.net[/C][/ROW]
[/TABLE]
Source: https://freestatistics.org/blog/index.php?pk=198935&T=0

Globally Unique Identifier (entire table): ba.freestatistics.org/blog/index.php?pk=198935&T=0

As an alternative you can also use a QR Code:  

The GUIDs for individual cells are displayed in the table below:

Summary of computational transaction
Raw Inputview raw input (R code)
Raw Outputview raw output of R engine
Computing time2 seconds
R Server'George Udny Yule' @ yule.wessa.net


Frequency Table (Histogram)
BinsMidpointAbs. FrequencyRel. FrequencyCumul. Rel. Freq.Density
[35,40[37.530.0150.0150.003
[40,45[42.570.0350.050.007
[45,50[47.5140.070.120.014
[50,55[52.5270.1350.2550.027
[55,60[57.5440.220.4750.044
[60,65[62.5370.1850.660.037
[65,70[67.5240.120.780.024
[70,75[72.5240.120.90.024
[75,80[77.5150.0750.9750.015
[80,85[82.540.020.9950.004
[85,90]87.510.00510.001

\begin{tabular}{lllllllll}
\hline
Frequency Table (Histogram) \tabularnewline
Bins & Midpoint & Abs. Frequency & Rel. Frequency & Cumul. Rel. Freq. & Density \tabularnewline
[35,40[ & 37.5 & 3 & 0.015 & 0.015 & 0.003 \tabularnewline
[40,45[ & 42.5 & 7 & 0.035 & 0.05 & 0.007 \tabularnewline
[45,50[ & 47.5 & 14 & 0.07 & 0.12 & 0.014 \tabularnewline
[50,55[ & 52.5 & 27 & 0.135 & 0.255 & 0.027 \tabularnewline
[55,60[ & 57.5 & 44 & 0.22 & 0.475 & 0.044 \tabularnewline
[60,65[ & 62.5 & 37 & 0.185 & 0.66 & 0.037 \tabularnewline
[65,70[ & 67.5 & 24 & 0.12 & 0.78 & 0.024 \tabularnewline
[70,75[ & 72.5 & 24 & 0.12 & 0.9 & 0.024 \tabularnewline
[75,80[ & 77.5 & 15 & 0.075 & 0.975 & 0.015 \tabularnewline
[80,85[ & 82.5 & 4 & 0.02 & 0.995 & 0.004 \tabularnewline
[85,90] & 87.5 & 1 & 0.005 & 1 & 0.001 \tabularnewline
\hline
\end{tabular}
%Source: https://freestatistics.org/blog/index.php?pk=198935&T=1

[TABLE]
[ROW][C]Frequency Table (Histogram)[/C][/ROW]
[ROW][C]Bins[/C][C]Midpoint[/C][C]Abs. Frequency[/C][C]Rel. Frequency[/C][C]Cumul. Rel. Freq.[/C][C]Density[/C][/ROW]
[ROW][C][35,40[[/C][C]37.5[/C][C]3[/C][C]0.015[/C][C]0.015[/C][C]0.003[/C][/ROW]
[ROW][C][40,45[[/C][C]42.5[/C][C]7[/C][C]0.035[/C][C]0.05[/C][C]0.007[/C][/ROW]
[ROW][C][45,50[[/C][C]47.5[/C][C]14[/C][C]0.07[/C][C]0.12[/C][C]0.014[/C][/ROW]
[ROW][C][50,55[[/C][C]52.5[/C][C]27[/C][C]0.135[/C][C]0.255[/C][C]0.027[/C][/ROW]
[ROW][C][55,60[[/C][C]57.5[/C][C]44[/C][C]0.22[/C][C]0.475[/C][C]0.044[/C][/ROW]
[ROW][C][60,65[[/C][C]62.5[/C][C]37[/C][C]0.185[/C][C]0.66[/C][C]0.037[/C][/ROW]
[ROW][C][65,70[[/C][C]67.5[/C][C]24[/C][C]0.12[/C][C]0.78[/C][C]0.024[/C][/ROW]
[ROW][C][70,75[[/C][C]72.5[/C][C]24[/C][C]0.12[/C][C]0.9[/C][C]0.024[/C][/ROW]
[ROW][C][75,80[[/C][C]77.5[/C][C]15[/C][C]0.075[/C][C]0.975[/C][C]0.015[/C][/ROW]
[ROW][C][80,85[[/C][C]82.5[/C][C]4[/C][C]0.02[/C][C]0.995[/C][C]0.004[/C][/ROW]
[ROW][C][85,90][/C][C]87.5[/C][C]1[/C][C]0.005[/C][C]1[/C][C]0.001[/C][/ROW]
[/TABLE]
Source: https://freestatistics.org/blog/index.php?pk=198935&T=1

Globally Unique Identifier (entire table): ba.freestatistics.org/blog/index.php?pk=198935&T=1

As an alternative you can also use a QR Code:  

The GUIDs for individual cells are displayed in the table below:

Frequency Table (Histogram)
BinsMidpointAbs. FrequencyRel. FrequencyCumul. Rel. Freq.Density
[35,40[37.530.0150.0150.003
[40,45[42.570.0350.050.007
[45,50[47.5140.070.120.014
[50,55[52.5270.1350.2550.027
[55,60[57.5440.220.4750.044
[60,65[62.5370.1850.660.037
[65,70[67.5240.120.780.024
[70,75[72.5240.120.90.024
[75,80[77.5150.0750.9750.015
[80,85[82.540.020.9950.004
[85,90]87.510.00510.001


Parameters (Session):
par2 = grey ; par3 = FALSE ; par4 = Unknown ;
Parameters (R input):
par1 = ; par2 = grey ; par3 = FALSE ; par4 = Unknown ;
R code (references can be found in the software module):
par1 <- as.numeric(par1)
if (par3 == 'TRUE') par3 <- TRUE
if (par3 == 'FALSE') par3 <- FALSE
if (par4 == 'Unknown') par1 <- as.numeric(par1)
if (par4 == 'Interval/Ratio') par1 <- as.numeric(par1)
if (par4 == '3-point Likert') par1 <- c(1:3 - 0.5, 3.5)
if (par4 == '4-point Likert') par1 <- c(1:4 - 0.5, 4.5)
if (par4 == '5-point Likert') par1 <- c(1:5 - 0.5, 5.5)
if (par4 == '6-point Likert') par1 <- c(1:6 - 0.5, 6.5)
if (par4 == '7-point Likert') par1 <- c(1:7 - 0.5, 7.5)
if (par4 == '8-point Likert') par1 <- c(1:8 - 0.5, 8.5)
if (par4 == '9-point Likert') par1 <- c(1:9 - 0.5, 9.5)
if (par4 == '10-point Likert') par1 <- c(1:10 - 0.5, 10.5)
bitmap(file='test1.png')
if(is.numeric(x[1])) {
if (is.na(par1)) {
myhist<-hist(x,col=par2,main=main,xlab=xlab,right=par3)
} else {
if (par1 < 0) par1 <- 3
if (par1 > 50) par1 <- 50
myhist<-hist(x,breaks=par1,col=par2,main=main,xlab=xlab,right=par3)
}
} else {
plot(mytab <- table(x),col=par2,main='Frequency Plot',xlab=xlab,ylab='Absolute Frequency')
}
dev.off()
if(is.numeric(x[1])) {
myhist
n <- length(x)
load(file='createtable')
a<-table.start()
a<-table.row.start(a)
a<-table.element(a,hyperlink('histogram.htm','Frequency Table (Histogram)',''),6,TRUE)
a<-table.row.end(a)
a<-table.row.start(a)
a<-table.element(a,'Bins',header=TRUE)
a<-table.element(a,'Midpoint',header=TRUE)
a<-table.element(a,'Abs. Frequency',header=TRUE)
a<-table.element(a,'Rel. Frequency',header=TRUE)
a<-table.element(a,'Cumul. Rel. Freq.',header=TRUE)
a<-table.element(a,'Density',header=TRUE)
a<-table.row.end(a)
crf <- 0
if (par3 == FALSE) mybracket <- '[' else mybracket <- ']'
mynumrows <- (length(myhist$breaks)-1)
for (i in 1:mynumrows) {
a<-table.row.start(a)
if (i == 1)
dum <- paste('[',myhist$breaks[i],sep='')
else
dum <- paste(mybracket,myhist$breaks[i],sep='')
dum <- paste(dum,myhist$breaks[i+1],sep=',')
if (i==mynumrows)
dum <- paste(dum,']',sep='')
else
dum <- paste(dum,mybracket,sep='')
a<-table.element(a,dum,header=TRUE)
a<-table.element(a,myhist$mids[i])
a<-table.element(a,myhist$counts[i])
rf <- myhist$counts[i]/n
crf <- crf + rf
a<-table.element(a,round(rf,6))
a<-table.element(a,round(crf,6))
a<-table.element(a,round(myhist$density[i],6))
a<-table.row.end(a)
}
a<-table.end(a)
table.save(a,file='mytable.tab')
} else {
mytab
reltab <- mytab / sum(mytab)
n <- length(mytab)
load(file='createtable')
a<-table.start()
a<-table.row.start(a)
a<-table.element(a,'Frequency Table (Categorical Data)',3,TRUE)
a<-table.row.end(a)
a<-table.row.start(a)
a<-table.element(a,'Category',header=TRUE)
a<-table.element(a,'Abs. Frequency',header=TRUE)
a<-table.element(a,'Rel. Frequency',header=TRUE)
a<-table.row.end(a)
for (i in 1:n) {
a<-table.row.start(a)
a<-table.element(a,labels(mytab)$x[i],header=TRUE)
a<-table.element(a,mytab[i])
a<-table.element(a,round(reltab[i],4))
a<-table.row.end(a)
}
a<-table.end(a)
table.save(a,file='mytable1.tab')
}