Free Statistics
of Irreproducible Research!
Description of Statistical Computation | |||||||||||||||||||||||||||||||||||||||||||||||||||||||||||||||||||||||||||||||||||||||||||||||||||||||||||||||||||||||||||||||||||||||||||||||||||||||||
|---|---|---|---|---|---|---|---|---|---|---|---|---|---|---|---|---|---|---|---|---|---|---|---|---|---|---|---|---|---|---|---|---|---|---|---|---|---|---|---|---|---|---|---|---|---|---|---|---|---|---|---|---|---|---|---|---|---|---|---|---|---|---|---|---|---|---|---|---|---|---|---|---|---|---|---|---|---|---|---|---|---|---|---|---|---|---|---|---|---|---|---|---|---|---|---|---|---|---|---|---|---|---|---|---|---|---|---|---|---|---|---|---|---|---|---|---|---|---|---|---|---|---|---|---|---|---|---|---|---|---|---|---|---|---|---|---|---|---|---|---|---|---|---|---|---|---|---|---|---|---|---|---|---|
| Author's title | |||||||||||||||||||||||||||||||||||||||||||||||||||||||||||||||||||||||||||||||||||||||||||||||||||||||||||||||||||||||||||||||||||||||||||||||||||||||||
| Author | *The author of this computation has been verified* | ||||||||||||||||||||||||||||||||||||||||||||||||||||||||||||||||||||||||||||||||||||||||||||||||||||||||||||||||||||||||||||||||||||||||||||||||||||||||
| R Software Module | rwasp_histogram.wasp | ||||||||||||||||||||||||||||||||||||||||||||||||||||||||||||||||||||||||||||||||||||||||||||||||||||||||||||||||||||||||||||||||||||||||||||||||||||||||
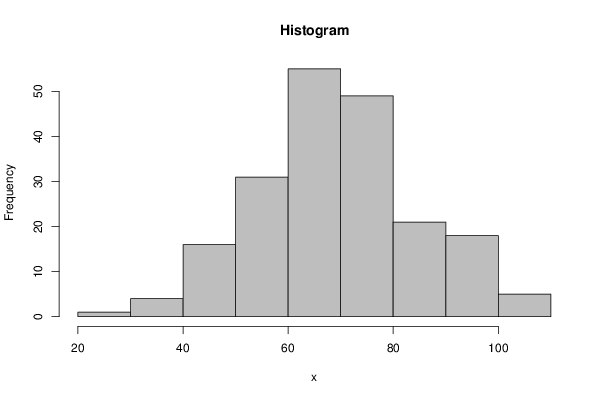
| Title produced by software | Histogram | ||||||||||||||||||||||||||||||||||||||||||||||||||||||||||||||||||||||||||||||||||||||||||||||||||||||||||||||||||||||||||||||||||||||||||||||||||||||||
| Date of computation | Wed, 12 Dec 2012 10:33:07 -0500 | ||||||||||||||||||||||||||||||||||||||||||||||||||||||||||||||||||||||||||||||||||||||||||||||||||||||||||||||||||||||||||||||||||||||||||||||||||||||||
| Cite this page as follows | Statistical Computations at FreeStatistics.org, Office for Research Development and Education, URL https://freestatistics.org/blog/index.php?v=date/2012/Dec/12/t1355326415mpdk8jdcskinohv.htm/, Retrieved Mon, 29 Apr 2024 04:17:33 +0000 | ||||||||||||||||||||||||||||||||||||||||||||||||||||||||||||||||||||||||||||||||||||||||||||||||||||||||||||||||||||||||||||||||||||||||||||||||||||||||
| Statistical Computations at FreeStatistics.org, Office for Research Development and Education, URL https://freestatistics.org/blog/index.php?pk=198936, Retrieved Mon, 29 Apr 2024 04:17:33 +0000 | |||||||||||||||||||||||||||||||||||||||||||||||||||||||||||||||||||||||||||||||||||||||||||||||||||||||||||||||||||||||||||||||||||||||||||||||||||||||||
| QR Codes: | |||||||||||||||||||||||||||||||||||||||||||||||||||||||||||||||||||||||||||||||||||||||||||||||||||||||||||||||||||||||||||||||||||||||||||||||||||||||||
|
| |||||||||||||||||||||||||||||||||||||||||||||||||||||||||||||||||||||||||||||||||||||||||||||||||||||||||||||||||||||||||||||||||||||||||||||||||||||||||
| Original text written by user: | |||||||||||||||||||||||||||||||||||||||||||||||||||||||||||||||||||||||||||||||||||||||||||||||||||||||||||||||||||||||||||||||||||||||||||||||||||||||||
| IsPrivate? | No (this computation is public) | ||||||||||||||||||||||||||||||||||||||||||||||||||||||||||||||||||||||||||||||||||||||||||||||||||||||||||||||||||||||||||||||||||||||||||||||||||||||||
| User-defined keywords | |||||||||||||||||||||||||||||||||||||||||||||||||||||||||||||||||||||||||||||||||||||||||||||||||||||||||||||||||||||||||||||||||||||||||||||||||||||||||
| Estimated Impact | 86 | ||||||||||||||||||||||||||||||||||||||||||||||||||||||||||||||||||||||||||||||||||||||||||||||||||||||||||||||||||||||||||||||||||||||||||||||||||||||||
Tree of Dependent Computations | |||||||||||||||||||||||||||||||||||||||||||||||||||||||||||||||||||||||||||||||||||||||||||||||||||||||||||||||||||||||||||||||||||||||||||||||||||||||||
| Family? (F = Feedback message, R = changed R code, M = changed R Module, P = changed Parameters, D = changed Data) | |||||||||||||||||||||||||||||||||||||||||||||||||||||||||||||||||||||||||||||||||||||||||||||||||||||||||||||||||||||||||||||||||||||||||||||||||||||||||
| - [Testing Mean with unknown Variance - Critical Value] [] [2010-10-25 13:12:27] [b98453cac15ba1066b407e146608df68] - RMPD [Histogram] [Histogram_Groep2:...] [2012-12-12 15:33:07] [5f6cd87c5735ffe37dbfae854ce1e663] [Current] - RMPD [Univariate Explorative Data Analysis] [Univariate EDA _G...] [2012-12-12 15:42:05] [f4325a5733446a4ce20d70c276c6a563] - RMP [Univariate Explorative Data Analysis] [Univariate EDA _G...] [2012-12-12 15:45:33] [f4325a5733446a4ce20d70c276c6a563] | |||||||||||||||||||||||||||||||||||||||||||||||||||||||||||||||||||||||||||||||||||||||||||||||||||||||||||||||||||||||||||||||||||||||||||||||||||||||||
| Feedback Forum | |||||||||||||||||||||||||||||||||||||||||||||||||||||||||||||||||||||||||||||||||||||||||||||||||||||||||||||||||||||||||||||||||||||||||||||||||||||||||
Post a new message | |||||||||||||||||||||||||||||||||||||||||||||||||||||||||||||||||||||||||||||||||||||||||||||||||||||||||||||||||||||||||||||||||||||||||||||||||||||||||
Dataset | |||||||||||||||||||||||||||||||||||||||||||||||||||||||||||||||||||||||||||||||||||||||||||||||||||||||||||||||||||||||||||||||||||||||||||||||||||||||||
| Dataseries X: | |||||||||||||||||||||||||||||||||||||||||||||||||||||||||||||||||||||||||||||||||||||||||||||||||||||||||||||||||||||||||||||||||||||||||||||||||||||||||
71,2850137 51,54016794 46,14902441 67,20296273 70,25647751 79,00062105 49,02089035 61,75876724 66,04816594 77,10834911 50,66480202 62,03758421 42,99810275 60,90026677 63,90814764 89,60429472 48,16319137 102,2152118 72,29179022 78,68118377 74,67784957 54,89432755 56,27814648 75,20973344 99,61523933 69,50133542 89,71261554 76,22043217 60,33511244 76,59757688 90,83361323 93,59054179 68,44063723 96,65537977 63,0184913 45,37877334 78,07757488 92,60685505 26,17181412 42,27109816 59,48912889 57,68145701 71,86890929 60,85057425 97,62822078 67,7813161 66,14905164 77,19835498 96,96717729 65,55050749 85,41174015 61,81741259 91,21355465 58,00810772 51,80162493 77,29376666 86,04604449 30,66235326 47,4785465 67,2134674 44,63874024 73,0812771 84,32222234 89,59617748 71,88971399 70,7203198 86,11128937 77,94128709 61,46492655 74,12674694 77,4673153 98,36136446 104,4100044 71,57435238 35,34634192 87,06073363 43,63452167 51,72229425 56,27289415 73,9447059 69,75157152 77,76625484 89,20423074 44,30668373 61,18825826 63,35310576 54,49262648 71,78335426 92,01047664 50,45484517 48,63249064 91,76095677 81,45305077 57,53942236 97,27310857 53,64761495 34,59246177 67,30681566 98,95931175 78,66624532 69,31989123 61,78010057 80,99156179 69,82844656 78,80628477 77,45693001 79,22002528 73,95659185 109,7070835 62,25473744 87,41379947 63,83205704 87,42508857 71,08358336 55,13999344 88,15294581 57,10480895 60,0609339 62,36466124 67,5432047 82,01402711 58,20452447 84,14047119 79,73560645 97,10107765 60,25446868 66,38458803 75,7358875 47,55617187 59,68912678 59,87868821 73,58234615 47,09205672 92,58543645 75,20606704 75,85212092 72,00775503 72,19895355 59,43183073 52,70939159 51,70783329 67,77551807 68,56173076 58,86232788 64,7414949 65,60683364 64,51269446 88,86542123 78,01267106 53,75528776 64,98364787 58,5592274 47,45017026 78,86088856 69,53003567 74,14224814 75,67052325 87,26608616 35,41209839 50,75920757 103,6577614 67,42451564 72,07840571 101,0205451 63,28213107 88,4256578 69,10961037 53,86623474 74,98845338 95,9200533 64,30359026 59,81375029 56,92285317 64,56419459 77,32089802 60,32240794 58,86232788 77,01605813 69,83992325 62,07586825 64,91806193 71,68170118 90,59248345 67,75346851 67,1328748 87,81860419 70,40797659 66,97728299 66,08261305 73,41490249 67,22980419 83,12080258 47,18373379 64,37874294 43,10185336 77,18418391 50,99457343 91,39288426 60,07094402 63,02616516 | |||||||||||||||||||||||||||||||||||||||||||||||||||||||||||||||||||||||||||||||||||||||||||||||||||||||||||||||||||||||||||||||||||||||||||||||||||||||||
Tables (Output of Computation) | |||||||||||||||||||||||||||||||||||||||||||||||||||||||||||||||||||||||||||||||||||||||||||||||||||||||||||||||||||||||||||||||||||||||||||||||||||||||||
| |||||||||||||||||||||||||||||||||||||||||||||||||||||||||||||||||||||||||||||||||||||||||||||||||||||||||||||||||||||||||||||||||||||||||||||||||||||||||
Figures (Output of Computation) | |||||||||||||||||||||||||||||||||||||||||||||||||||||||||||||||||||||||||||||||||||||||||||||||||||||||||||||||||||||||||||||||||||||||||||||||||||||||||
Input Parameters & R Code | |||||||||||||||||||||||||||||||||||||||||||||||||||||||||||||||||||||||||||||||||||||||||||||||||||||||||||||||||||||||||||||||||||||||||||||||||||||||||
| Parameters (Session): | |||||||||||||||||||||||||||||||||||||||||||||||||||||||||||||||||||||||||||||||||||||||||||||||||||||||||||||||||||||||||||||||||||||||||||||||||||||||||
| par2 = grey ; par3 = FALSE ; par4 = Unknown ; | |||||||||||||||||||||||||||||||||||||||||||||||||||||||||||||||||||||||||||||||||||||||||||||||||||||||||||||||||||||||||||||||||||||||||||||||||||||||||
| Parameters (R input): | |||||||||||||||||||||||||||||||||||||||||||||||||||||||||||||||||||||||||||||||||||||||||||||||||||||||||||||||||||||||||||||||||||||||||||||||||||||||||
| par1 = ; par2 = grey ; par3 = FALSE ; par4 = Unknown ; | |||||||||||||||||||||||||||||||||||||||||||||||||||||||||||||||||||||||||||||||||||||||||||||||||||||||||||||||||||||||||||||||||||||||||||||||||||||||||
| R code (references can be found in the software module): | |||||||||||||||||||||||||||||||||||||||||||||||||||||||||||||||||||||||||||||||||||||||||||||||||||||||||||||||||||||||||||||||||||||||||||||||||||||||||
par1 <- as.numeric(par1) | |||||||||||||||||||||||||||||||||||||||||||||||||||||||||||||||||||||||||||||||||||||||||||||||||||||||||||||||||||||||||||||||||||||||||||||||||||||||||


