Free Statistics
of Irreproducible Research!
Description of Statistical Computation | |||||||||||||||||||||||||||||||||
|---|---|---|---|---|---|---|---|---|---|---|---|---|---|---|---|---|---|---|---|---|---|---|---|---|---|---|---|---|---|---|---|---|---|
| Author's title | |||||||||||||||||||||||||||||||||
| Author | *The author of this computation has been verified* | ||||||||||||||||||||||||||||||||
| R Software Module | rwasp_meanversusmedian.wasp | ||||||||||||||||||||||||||||||||
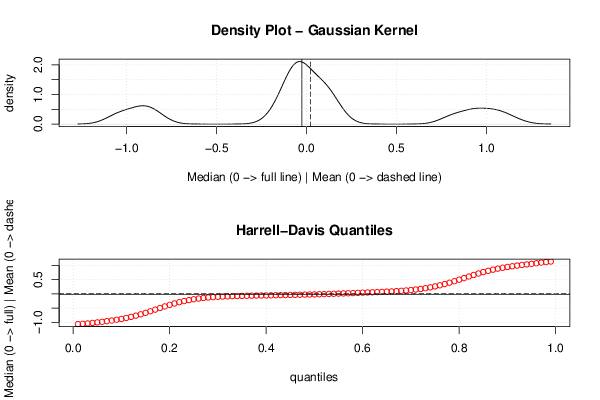
| Title produced by software | Mean versus Median | ||||||||||||||||||||||||||||||||
| Date of computation | Wed, 19 Dec 2012 08:11:05 -0500 | ||||||||||||||||||||||||||||||||
| Cite this page as follows | Statistical Computations at FreeStatistics.org, Office for Research Development and Education, URL https://freestatistics.org/blog/index.php?v=date/2012/Dec/19/t1355922683xu3bv3tok1p1sx2.htm/, Retrieved Sat, 04 May 2024 01:50:54 +0000 | ||||||||||||||||||||||||||||||||
| Statistical Computations at FreeStatistics.org, Office for Research Development and Education, URL https://freestatistics.org/blog/index.php?pk=201906, Retrieved Sat, 04 May 2024 01:50:54 +0000 | |||||||||||||||||||||||||||||||||
| QR Codes: | |||||||||||||||||||||||||||||||||
|
| |||||||||||||||||||||||||||||||||
| Original text written by user: | |||||||||||||||||||||||||||||||||
| IsPrivate? | No (this computation is public) | ||||||||||||||||||||||||||||||||
| User-defined keywords | |||||||||||||||||||||||||||||||||
| Estimated Impact | 95 | ||||||||||||||||||||||||||||||||
Tree of Dependent Computations | |||||||||||||||||||||||||||||||||
| Family? (F = Feedback message, R = changed R code, M = changed R Module, P = changed Parameters, D = changed Data) | |||||||||||||||||||||||||||||||||
| - [Kendall tau Correlation Matrix] [Paper, Pearson Co...] [2011-12-18 12:42:54] [75512e061a94450f738c2449abbaac12] - P [Kendall tau Correlation Matrix] [Paper, Kendall's ...] [2011-12-19 10:46:53] [75512e061a94450f738c2449abbaac12] - RMP [Multiple Regression] [Paper, 3.3 Meervo...] [2011-12-19 15:22:52] [75512e061a94450f738c2449abbaac12] - RMPD [Mean versus Median] [Median versus Mean] [2012-12-19 13:11:05] [2d2e1459719df4dac57978867f50cb50] [Current] | |||||||||||||||||||||||||||||||||
| Feedback Forum | |||||||||||||||||||||||||||||||||
Post a new message | |||||||||||||||||||||||||||||||||
Dataset | |||||||||||||||||||||||||||||||||
| Dataseries X: | |||||||||||||||||||||||||||||||||
-0.0978339145409005 -0.061114984344326 -0.0346093482386506 -0.0192416848531983 -0.0423084780434488 0.922761802213626 -0.0579480403827707 0.11091600750011 1.14938260868304 0.163933298824692 -0.898036159496104 1.07519675583866 0.0880897236152704 -0.909086321425183 0.0896636455027791 -0.930564533713409 1.05384702751967 0.0230424193807341 0.0209175154204943 0.132184006131612 -0.839163087386618 -0.843015656408399 0.0824985068397358 1.02338935670594 -0.0416444545493731 -0.082250730037493 -0.132797645703873 -0.157137593340795 -0.16101317240676 0.805593138018239 0.81818376139633 -0.0273179264105021 -0.985587097700198 0.0281131587591395 -0.023854757619615 -0.0517582730630412 -0.0741218066337642 0.933956133102586 -0.0666187538781284 -0.075469878230393 -1.0612646597867 0.940460644783808 -1.04691226728023 0.0743705357178721 0.122437652291408 0.150153852791857 | |||||||||||||||||||||||||||||||||
Tables (Output of Computation) | |||||||||||||||||||||||||||||||||
| |||||||||||||||||||||||||||||||||
Figures (Output of Computation) | |||||||||||||||||||||||||||||||||
Input Parameters & R Code | |||||||||||||||||||||||||||||||||
| Parameters (Session): | |||||||||||||||||||||||||||||||||
| Parameters (R input): | |||||||||||||||||||||||||||||||||
| R code (references can be found in the software module): | |||||||||||||||||||||||||||||||||
library(Hmisc) | |||||||||||||||||||||||||||||||||


