Free Statistics
of Irreproducible Research!
Description of Statistical Computation | |||||||||||||||||||||||||||||||||||||||||
|---|---|---|---|---|---|---|---|---|---|---|---|---|---|---|---|---|---|---|---|---|---|---|---|---|---|---|---|---|---|---|---|---|---|---|---|---|---|---|---|---|---|
| Author's title | |||||||||||||||||||||||||||||||||||||||||
| Author | *Unverified author* | ||||||||||||||||||||||||||||||||||||||||
| R Software Module | rwasp_univariatedataseries.wasp | ||||||||||||||||||||||||||||||||||||||||
| Title produced by software | Univariate Data Series | ||||||||||||||||||||||||||||||||||||||||
| Date of computation | Thu, 09 Feb 2012 15:20:44 -0500 | ||||||||||||||||||||||||||||||||||||||||
| Cite this page as follows | Statistical Computations at FreeStatistics.org, Office for Research Development and Education, URL https://freestatistics.org/blog/index.php?v=date/2012/Feb/09/t13288189092bi9ypxpi7tpapp.htm/, Retrieved Fri, 03 May 2024 08:59:15 +0000 | ||||||||||||||||||||||||||||||||||||||||
| Statistical Computations at FreeStatistics.org, Office for Research Development and Education, URL https://freestatistics.org/blog/index.php?pk=162052, Retrieved Fri, 03 May 2024 08:59:15 +0000 | |||||||||||||||||||||||||||||||||||||||||
| QR Codes: | |||||||||||||||||||||||||||||||||||||||||
|
| |||||||||||||||||||||||||||||||||||||||||
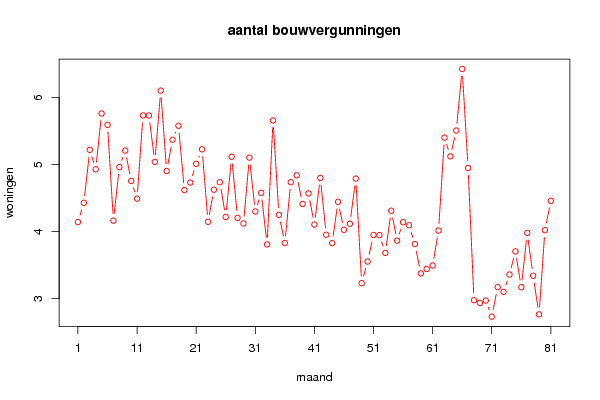
| Original text written by user: | Deze reeks geeft het aantal bouwvergunningen weer die zijn toegekend in Belgi� voor de nieuwbouw van residenti�le woningen van 01/2005-09/2011 | ||||||||||||||||||||||||||||||||||||||||
| IsPrivate? | No (this computation is public) | ||||||||||||||||||||||||||||||||||||||||
| User-defined keywords | |||||||||||||||||||||||||||||||||||||||||
| Estimated Impact | 91 | ||||||||||||||||||||||||||||||||||||||||
Tree of Dependent Computations | |||||||||||||||||||||||||||||||||||||||||
| Family? (F = Feedback message, R = changed R code, M = changed R Module, P = changed Parameters, D = changed Data) | |||||||||||||||||||||||||||||||||||||||||
| - [Univariate Data Series] [Aantal bouwvergun...] [2012-02-09 20:20:44] [abc5d27992aad9340ff76ee686cd681b] [Current] | |||||||||||||||||||||||||||||||||||||||||
| Feedback Forum | |||||||||||||||||||||||||||||||||||||||||
Post a new message | |||||||||||||||||||||||||||||||||||||||||
Dataset | |||||||||||||||||||||||||||||||||||||||||
| Dataseries X: | |||||||||||||||||||||||||||||||||||||||||
4.143 4.429 5.219 4.929 5.761 5.592 4.163 4.962 5.208 4.755 4.491 5.732 5.731 5.040 6.102 4.904 5.369 5.578 4.619 4.731 5.011 5.227 4.146 4.625 4.736 4.219 5.116 4.205 4.121 5.103 4.300 4.578 3.809 5.657 4.249 3.830 4.736 4.840 4.412 4.570 4.105 4.801 3.953 3.828 4.444 4.027 4.118 4.791 3.232 3.554 3.950 3.948 3.683 4.311 3.865 4.140 4.095 3.814 3.377 3.443 3.494 4.015 5.401 5.122 5.507 6.425 4.948 2.977 2.937 2.972 2.732 3.172 3.102 3.360 3.705 3.171 3.980 3.342 2.766 4.022 4.459 | |||||||||||||||||||||||||||||||||||||||||
Tables (Output of Computation) | |||||||||||||||||||||||||||||||||||||||||
| |||||||||||||||||||||||||||||||||||||||||
Figures (Output of Computation) | |||||||||||||||||||||||||||||||||||||||||
Input Parameters & R Code | |||||||||||||||||||||||||||||||||||||||||
| Parameters (Session): | |||||||||||||||||||||||||||||||||||||||||
| par1 = Aantal woningen ; par2 = http://statbel.fgov.be/nl/modules/publications/statistiques/economie/Bouwvergunningen.jsp ; par3 = Deze reeks geeft het aantal bouwvergunningen weer die zijn toegekend in Belgi� voor de nieuwbouw van residenti�le woningen van 01/2005-09/2011 ; par4 = No season ; | |||||||||||||||||||||||||||||||||||||||||
| Parameters (R input): | |||||||||||||||||||||||||||||||||||||||||
| par1 = Aantal woningen ; par2 = http://statbel.fgov.be/nl/modules/publications/statistiques/economie/Bouwvergunningen.jsp ; par3 = Deze reeks geeft het aantal bouwvergunningen weer die zijn toegekend in Belgi� voor de nieuwbouw van residenti�le woningen van 01/2005-09/2011 ; par4 = No season ; | |||||||||||||||||||||||||||||||||||||||||
| R code (references can be found in the software module): | |||||||||||||||||||||||||||||||||||||||||
if (par4 != 'No season') { | |||||||||||||||||||||||||||||||||||||||||