Free Statistics

of Irreproducible Research!

Author's title

Author*Unverified author*
R Software Modulerwasp_autocorrelation.wasp
Title produced by software(Partial) Autocorrelation Function
Date of computationTue, 31 Jul 2012 08:31:37 -0400
Cite this page as followsStatistical Computations at FreeStatistics.org, Office for Research Development and Education, URL https://freestatistics.org/blog/index.php?v=date/2012/Jul/31/t134373866097dwatig7djbv9f.htm/, Retrieved Mon, 29 Apr 2024 09:19:28 +0000
Statistical Computations at FreeStatistics.org, Office for Research Development and Education, URL https://freestatistics.org/blog/index.php?pk=168953, Retrieved Mon, 29 Apr 2024 09:19:28 +0000
QR Codes:

Original text written by user:
IsPrivate?No (this computation is public)
User-defined keywordsyasmien naciri
Estimated Impact188
Family? (F = Feedback message, R = changed R code, M = changed R Module, P = changed Parameters, D = changed Data)
-       [(Partial) Autocorrelation Function] [] [2012-07-31 12:31:37] [d06e8713ea83045a022ab0926c74dd0b] [Current]
Feedback Forum

Post a new message
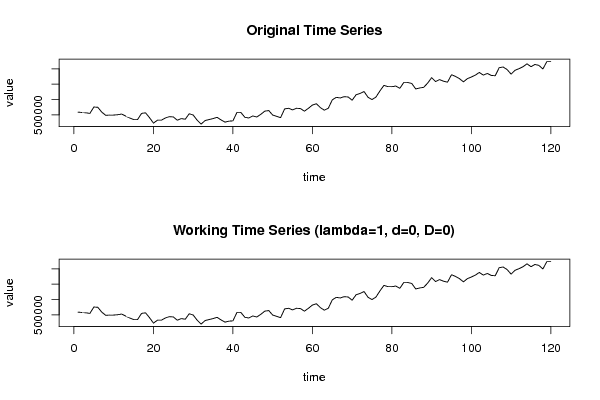
Dataseries X:
588264
577918
567562
546859
756344
745987
588264
483527
493873
493873
504229
526055
462824
399492
347630
347630
546859
567562
409838
231412
325803
325803
399492
442021
431664
325803
378790
357986
536412
493873
325803
200263
315447
347630
378790
420195
336150
263595
294755
305101
577918
577918
420195
399492
462824
431664
515709
620447
641250
493873
452367
409838
694135
714939
661953
714939
704481
620447
714939
819676
862205
735641
651596
714939
987746
1071790
1051088
1092483
1082137
977399
1155825
1198354
1260562
1071790
998102
1082137
1282389
1460814
1418286
1418286
1439089
1366423
1555307
1555307
1523124
1344597
1376780
1397583
1534503
1712929
1586355
1649698
1596712
1565653
1807421
1754435
1680746
1576009
1680746
1733732
1796963
1880998
1796963
1848826
1785585
1775239
2037699
2059525
1975491
1828123
1953664
2006549
2069882
2164273
2069882
2143570
2111388
1996193
2237951
2237951


Summary of computational transaction
Raw Inputview raw input (R code)
Raw Outputview raw output of R engine
Computing time1 seconds
R Server'Gwilym Jenkins' @ jenkins.wessa.net

\begin{tabular}{lllllllll}
\hline
Summary of computational transaction \tabularnewline
Raw Input & view raw input (R code)  \tabularnewline
Raw Output & view raw output of R engine  \tabularnewline
Computing time & 1 seconds \tabularnewline
R Server & 'Gwilym Jenkins' @ jenkins.wessa.net \tabularnewline
\hline
\end{tabular}
%Source: https://freestatistics.org/blog/index.php?pk=168953&T=0

[TABLE]
[ROW][C]Summary of computational transaction[/C][/ROW]
[ROW][C]Raw Input[/C][C]view raw input (R code) [/C][/ROW]
[ROW][C]Raw Output[/C][C]view raw output of R engine [/C][/ROW]
[ROW][C]Computing time[/C][C]1 seconds[/C][/ROW]
[ROW][C]R Server[/C][C]'Gwilym Jenkins' @ jenkins.wessa.net[/C][/ROW]
[/TABLE]
Source: https://freestatistics.org/blog/index.php?pk=168953&T=0

Globally Unique Identifier (entire table): ba.freestatistics.org/blog/index.php?pk=168953&T=0

As an alternative you can also use a QR Code:  

The GUIDs for individual cells are displayed in the table below:

Summary of computational transaction
Raw Inputview raw input (R code)
Raw Outputview raw output of R engine
Computing time1 seconds
R Server'Gwilym Jenkins' @ jenkins.wessa.net


Autocorrelation Function
Time lag kACF(k)T-STATP-value
10.96641610.58660
20.93166410.20590
30.9118279.98860
40.897329.82970
50.8876429.72360
60.87389.5720
70.8465199.27320
80.8150948.92890
90.7876128.62790
100.7708828.44460
110.7656468.38720
120.7542098.26190
130.7157997.84120
140.6767157.4130
150.651227.13380
160.6321686.92510
170.6163016.75120
180.5978136.54870
190.5669496.21060
200.5316125.82350
210.5009315.48740
220.4807965.26690
230.4693095.1411e-06
240.4525534.95751e-06
250.4153184.54966e-06
260.3763064.12223.5e-05
270.3494663.82820.000103
280.3253723.56430.000262
290.3052183.34350.000552
300.2849243.12120.001128
310.2507742.74710.00347
320.2151352.35670.010029
330.1853012.02990.022291
340.1656221.81430.036065
350.1521.66510.049253
360.1311671.43690.07668
370.0956121.04740.148515
380.0595880.65270.257583
390.0318970.34940.363694
400.0038540.04220.483196
41-0.016649-0.18240.427797
42-0.03591-0.39340.347372
43-0.066429-0.72770.234109
44-0.098184-1.07550.142144
45-0.123796-1.35610.088803
46-0.13845-1.51660.065993
47-0.149949-1.64260.051541
48-0.167092-1.83040.034836

\begin{tabular}{lllllllll}
\hline
Autocorrelation Function \tabularnewline
Time lag k & ACF(k) & T-STAT & P-value \tabularnewline
1 & 0.966416 & 10.5866 & 0 \tabularnewline
2 & 0.931664 & 10.2059 & 0 \tabularnewline
3 & 0.911827 & 9.9886 & 0 \tabularnewline
4 & 0.89732 & 9.8297 & 0 \tabularnewline
5 & 0.887642 & 9.7236 & 0 \tabularnewline
6 & 0.8738 & 9.572 & 0 \tabularnewline
7 & 0.846519 & 9.2732 & 0 \tabularnewline
8 & 0.815094 & 8.9289 & 0 \tabularnewline
9 & 0.787612 & 8.6279 & 0 \tabularnewline
10 & 0.770882 & 8.4446 & 0 \tabularnewline
11 & 0.765646 & 8.3872 & 0 \tabularnewline
12 & 0.754209 & 8.2619 & 0 \tabularnewline
13 & 0.715799 & 7.8412 & 0 \tabularnewline
14 & 0.676715 & 7.413 & 0 \tabularnewline
15 & 0.65122 & 7.1338 & 0 \tabularnewline
16 & 0.632168 & 6.9251 & 0 \tabularnewline
17 & 0.616301 & 6.7512 & 0 \tabularnewline
18 & 0.597813 & 6.5487 & 0 \tabularnewline
19 & 0.566949 & 6.2106 & 0 \tabularnewline
20 & 0.531612 & 5.8235 & 0 \tabularnewline
21 & 0.500931 & 5.4874 & 0 \tabularnewline
22 & 0.480796 & 5.2669 & 0 \tabularnewline
23 & 0.469309 & 5.141 & 1e-06 \tabularnewline
24 & 0.452553 & 4.9575 & 1e-06 \tabularnewline
25 & 0.415318 & 4.5496 & 6e-06 \tabularnewline
26 & 0.376306 & 4.1222 & 3.5e-05 \tabularnewline
27 & 0.349466 & 3.8282 & 0.000103 \tabularnewline
28 & 0.325372 & 3.5643 & 0.000262 \tabularnewline
29 & 0.305218 & 3.3435 & 0.000552 \tabularnewline
30 & 0.284924 & 3.1212 & 0.001128 \tabularnewline
31 & 0.250774 & 2.7471 & 0.00347 \tabularnewline
32 & 0.215135 & 2.3567 & 0.010029 \tabularnewline
33 & 0.185301 & 2.0299 & 0.022291 \tabularnewline
34 & 0.165622 & 1.8143 & 0.036065 \tabularnewline
35 & 0.152 & 1.6651 & 0.049253 \tabularnewline
36 & 0.131167 & 1.4369 & 0.07668 \tabularnewline
37 & 0.095612 & 1.0474 & 0.148515 \tabularnewline
38 & 0.059588 & 0.6527 & 0.257583 \tabularnewline
39 & 0.031897 & 0.3494 & 0.363694 \tabularnewline
40 & 0.003854 & 0.0422 & 0.483196 \tabularnewline
41 & -0.016649 & -0.1824 & 0.427797 \tabularnewline
42 & -0.03591 & -0.3934 & 0.347372 \tabularnewline
43 & -0.066429 & -0.7277 & 0.234109 \tabularnewline
44 & -0.098184 & -1.0755 & 0.142144 \tabularnewline
45 & -0.123796 & -1.3561 & 0.088803 \tabularnewline
46 & -0.13845 & -1.5166 & 0.065993 \tabularnewline
47 & -0.149949 & -1.6426 & 0.051541 \tabularnewline
48 & -0.167092 & -1.8304 & 0.034836 \tabularnewline
\hline
\end{tabular}
%Source: https://freestatistics.org/blog/index.php?pk=168953&T=1

[TABLE]
[ROW][C]Autocorrelation Function[/C][/ROW]
[ROW][C]Time lag k[/C][C]ACF(k)[/C][C]T-STAT[/C][C]P-value[/C][/ROW]
[ROW][C]1[/C][C]0.966416[/C][C]10.5866[/C][C]0[/C][/ROW]
[ROW][C]2[/C][C]0.931664[/C][C]10.2059[/C][C]0[/C][/ROW]
[ROW][C]3[/C][C]0.911827[/C][C]9.9886[/C][C]0[/C][/ROW]
[ROW][C]4[/C][C]0.89732[/C][C]9.8297[/C][C]0[/C][/ROW]
[ROW][C]5[/C][C]0.887642[/C][C]9.7236[/C][C]0[/C][/ROW]
[ROW][C]6[/C][C]0.8738[/C][C]9.572[/C][C]0[/C][/ROW]
[ROW][C]7[/C][C]0.846519[/C][C]9.2732[/C][C]0[/C][/ROW]
[ROW][C]8[/C][C]0.815094[/C][C]8.9289[/C][C]0[/C][/ROW]
[ROW][C]9[/C][C]0.787612[/C][C]8.6279[/C][C]0[/C][/ROW]
[ROW][C]10[/C][C]0.770882[/C][C]8.4446[/C][C]0[/C][/ROW]
[ROW][C]11[/C][C]0.765646[/C][C]8.3872[/C][C]0[/C][/ROW]
[ROW][C]12[/C][C]0.754209[/C][C]8.2619[/C][C]0[/C][/ROW]
[ROW][C]13[/C][C]0.715799[/C][C]7.8412[/C][C]0[/C][/ROW]
[ROW][C]14[/C][C]0.676715[/C][C]7.413[/C][C]0[/C][/ROW]
[ROW][C]15[/C][C]0.65122[/C][C]7.1338[/C][C]0[/C][/ROW]
[ROW][C]16[/C][C]0.632168[/C][C]6.9251[/C][C]0[/C][/ROW]
[ROW][C]17[/C][C]0.616301[/C][C]6.7512[/C][C]0[/C][/ROW]
[ROW][C]18[/C][C]0.597813[/C][C]6.5487[/C][C]0[/C][/ROW]
[ROW][C]19[/C][C]0.566949[/C][C]6.2106[/C][C]0[/C][/ROW]
[ROW][C]20[/C][C]0.531612[/C][C]5.8235[/C][C]0[/C][/ROW]
[ROW][C]21[/C][C]0.500931[/C][C]5.4874[/C][C]0[/C][/ROW]
[ROW][C]22[/C][C]0.480796[/C][C]5.2669[/C][C]0[/C][/ROW]
[ROW][C]23[/C][C]0.469309[/C][C]5.141[/C][C]1e-06[/C][/ROW]
[ROW][C]24[/C][C]0.452553[/C][C]4.9575[/C][C]1e-06[/C][/ROW]
[ROW][C]25[/C][C]0.415318[/C][C]4.5496[/C][C]6e-06[/C][/ROW]
[ROW][C]26[/C][C]0.376306[/C][C]4.1222[/C][C]3.5e-05[/C][/ROW]
[ROW][C]27[/C][C]0.349466[/C][C]3.8282[/C][C]0.000103[/C][/ROW]
[ROW][C]28[/C][C]0.325372[/C][C]3.5643[/C][C]0.000262[/C][/ROW]
[ROW][C]29[/C][C]0.305218[/C][C]3.3435[/C][C]0.000552[/C][/ROW]
[ROW][C]30[/C][C]0.284924[/C][C]3.1212[/C][C]0.001128[/C][/ROW]
[ROW][C]31[/C][C]0.250774[/C][C]2.7471[/C][C]0.00347[/C][/ROW]
[ROW][C]32[/C][C]0.215135[/C][C]2.3567[/C][C]0.010029[/C][/ROW]
[ROW][C]33[/C][C]0.185301[/C][C]2.0299[/C][C]0.022291[/C][/ROW]
[ROW][C]34[/C][C]0.165622[/C][C]1.8143[/C][C]0.036065[/C][/ROW]
[ROW][C]35[/C][C]0.152[/C][C]1.6651[/C][C]0.049253[/C][/ROW]
[ROW][C]36[/C][C]0.131167[/C][C]1.4369[/C][C]0.07668[/C][/ROW]
[ROW][C]37[/C][C]0.095612[/C][C]1.0474[/C][C]0.148515[/C][/ROW]
[ROW][C]38[/C][C]0.059588[/C][C]0.6527[/C][C]0.257583[/C][/ROW]
[ROW][C]39[/C][C]0.031897[/C][C]0.3494[/C][C]0.363694[/C][/ROW]
[ROW][C]40[/C][C]0.003854[/C][C]0.0422[/C][C]0.483196[/C][/ROW]
[ROW][C]41[/C][C]-0.016649[/C][C]-0.1824[/C][C]0.427797[/C][/ROW]
[ROW][C]42[/C][C]-0.03591[/C][C]-0.3934[/C][C]0.347372[/C][/ROW]
[ROW][C]43[/C][C]-0.066429[/C][C]-0.7277[/C][C]0.234109[/C][/ROW]
[ROW][C]44[/C][C]-0.098184[/C][C]-1.0755[/C][C]0.142144[/C][/ROW]
[ROW][C]45[/C][C]-0.123796[/C][C]-1.3561[/C][C]0.088803[/C][/ROW]
[ROW][C]46[/C][C]-0.13845[/C][C]-1.5166[/C][C]0.065993[/C][/ROW]
[ROW][C]47[/C][C]-0.149949[/C][C]-1.6426[/C][C]0.051541[/C][/ROW]
[ROW][C]48[/C][C]-0.167092[/C][C]-1.8304[/C][C]0.034836[/C][/ROW]
[/TABLE]
Source: https://freestatistics.org/blog/index.php?pk=168953&T=1

Globally Unique Identifier (entire table): ba.freestatistics.org/blog/index.php?pk=168953&T=1

As an alternative you can also use a QR Code:  

The GUIDs for individual cells are displayed in the table below:

Autocorrelation Function
Time lag kACF(k)T-STATP-value
10.96641610.58660
20.93166410.20590
30.9118279.98860
40.897329.82970
50.8876429.72360
60.87389.5720
70.8465199.27320
80.8150948.92890
90.7876128.62790
100.7708828.44460
110.7656468.38720
120.7542098.26190
130.7157997.84120
140.6767157.4130
150.651227.13380
160.6321686.92510
170.6163016.75120
180.5978136.54870
190.5669496.21060
200.5316125.82350
210.5009315.48740
220.4807965.26690
230.4693095.1411e-06
240.4525534.95751e-06
250.4153184.54966e-06
260.3763064.12223.5e-05
270.3494663.82820.000103
280.3253723.56430.000262
290.3052183.34350.000552
300.2849243.12120.001128
310.2507742.74710.00347
320.2151352.35670.010029
330.1853012.02990.022291
340.1656221.81430.036065
350.1521.66510.049253
360.1311671.43690.07668
370.0956121.04740.148515
380.0595880.65270.257583
390.0318970.34940.363694
400.0038540.04220.483196
41-0.016649-0.18240.427797
42-0.03591-0.39340.347372
43-0.066429-0.72770.234109
44-0.098184-1.07550.142144
45-0.123796-1.35610.088803
46-0.13845-1.51660.065993
47-0.149949-1.64260.051541
48-0.167092-1.83040.034836


Partial Autocorrelation Function
Time lag kPACF(k)T-STATP-value
10.96641610.58660
2-0.034753-0.38070.352051
30.2084162.28310.012093
40.0637660.69850.243103
50.1173941.2860.100461
6-0.037905-0.41520.339357
7-0.169765-1.85970.03269
8-0.089851-0.98430.163481
9-0.040233-0.44070.3301
100.0960831.05250.147334
110.1583771.73490.04266
12-0.025331-0.27750.390941
13-0.334452-3.66370.000186
14-0.030768-0.3370.368335
150.0643410.70480.241145
160.0199830.21890.41355
17-0.002383-0.02610.489608
180.0077450.08480.466264
19-0.062072-0.680.248918
20-0.037212-0.40760.342131
21-0.031932-0.34980.363554
220.0104110.1140.454696
230.0313090.3430.366108
240.0166030.18190.427995
25-0.133461-1.4620.073179
26-0.049394-0.54110.294727
270.0187310.20520.418885
28-0.07422-0.8130.208903
290.0054350.05950.476313
300.017240.18880.425265
31-0.079187-0.86750.193713
320.0277990.30450.380627
33-0.018735-0.20520.418871
340.0269840.29560.384026
35-0.021643-0.23710.406496
36-0.042848-0.46940.319825
37-0.054525-0.59730.27572
38-0.031964-0.35010.363421
39-0.030207-0.33090.370648
40-0.122958-1.34690.09027
410.0512340.56120.287839
420.0200830.220.413124
43-0.002534-0.02780.488952
440.0059010.06460.474281
45-0.015459-0.16930.432904
460.0582520.63810.262306
47-0.040549-0.44420.328854
48-0.009777-0.10710.457442

\begin{tabular}{lllllllll}
\hline
Partial Autocorrelation Function \tabularnewline
Time lag k & PACF(k) & T-STAT & P-value \tabularnewline
1 & 0.966416 & 10.5866 & 0 \tabularnewline
2 & -0.034753 & -0.3807 & 0.352051 \tabularnewline
3 & 0.208416 & 2.2831 & 0.012093 \tabularnewline
4 & 0.063766 & 0.6985 & 0.243103 \tabularnewline
5 & 0.117394 & 1.286 & 0.100461 \tabularnewline
6 & -0.037905 & -0.4152 & 0.339357 \tabularnewline
7 & -0.169765 & -1.8597 & 0.03269 \tabularnewline
8 & -0.089851 & -0.9843 & 0.163481 \tabularnewline
9 & -0.040233 & -0.4407 & 0.3301 \tabularnewline
10 & 0.096083 & 1.0525 & 0.147334 \tabularnewline
11 & 0.158377 & 1.7349 & 0.04266 \tabularnewline
12 & -0.025331 & -0.2775 & 0.390941 \tabularnewline
13 & -0.334452 & -3.6637 & 0.000186 \tabularnewline
14 & -0.030768 & -0.337 & 0.368335 \tabularnewline
15 & 0.064341 & 0.7048 & 0.241145 \tabularnewline
16 & 0.019983 & 0.2189 & 0.41355 \tabularnewline
17 & -0.002383 & -0.0261 & 0.489608 \tabularnewline
18 & 0.007745 & 0.0848 & 0.466264 \tabularnewline
19 & -0.062072 & -0.68 & 0.248918 \tabularnewline
20 & -0.037212 & -0.4076 & 0.342131 \tabularnewline
21 & -0.031932 & -0.3498 & 0.363554 \tabularnewline
22 & 0.010411 & 0.114 & 0.454696 \tabularnewline
23 & 0.031309 & 0.343 & 0.366108 \tabularnewline
24 & 0.016603 & 0.1819 & 0.427995 \tabularnewline
25 & -0.133461 & -1.462 & 0.073179 \tabularnewline
26 & -0.049394 & -0.5411 & 0.294727 \tabularnewline
27 & 0.018731 & 0.2052 & 0.418885 \tabularnewline
28 & -0.07422 & -0.813 & 0.208903 \tabularnewline
29 & 0.005435 & 0.0595 & 0.476313 \tabularnewline
30 & 0.01724 & 0.1888 & 0.425265 \tabularnewline
31 & -0.079187 & -0.8675 & 0.193713 \tabularnewline
32 & 0.027799 & 0.3045 & 0.380627 \tabularnewline
33 & -0.018735 & -0.2052 & 0.418871 \tabularnewline
34 & 0.026984 & 0.2956 & 0.384026 \tabularnewline
35 & -0.021643 & -0.2371 & 0.406496 \tabularnewline
36 & -0.042848 & -0.4694 & 0.319825 \tabularnewline
37 & -0.054525 & -0.5973 & 0.27572 \tabularnewline
38 & -0.031964 & -0.3501 & 0.363421 \tabularnewline
39 & -0.030207 & -0.3309 & 0.370648 \tabularnewline
40 & -0.122958 & -1.3469 & 0.09027 \tabularnewline
41 & 0.051234 & 0.5612 & 0.287839 \tabularnewline
42 & 0.020083 & 0.22 & 0.413124 \tabularnewline
43 & -0.002534 & -0.0278 & 0.488952 \tabularnewline
44 & 0.005901 & 0.0646 & 0.474281 \tabularnewline
45 & -0.015459 & -0.1693 & 0.432904 \tabularnewline
46 & 0.058252 & 0.6381 & 0.262306 \tabularnewline
47 & -0.040549 & -0.4442 & 0.328854 \tabularnewline
48 & -0.009777 & -0.1071 & 0.457442 \tabularnewline
\hline
\end{tabular}
%Source: https://freestatistics.org/blog/index.php?pk=168953&T=2

[TABLE]
[ROW][C]Partial Autocorrelation Function[/C][/ROW]
[ROW][C]Time lag k[/C][C]PACF(k)[/C][C]T-STAT[/C][C]P-value[/C][/ROW]
[ROW][C]1[/C][C]0.966416[/C][C]10.5866[/C][C]0[/C][/ROW]
[ROW][C]2[/C][C]-0.034753[/C][C]-0.3807[/C][C]0.352051[/C][/ROW]
[ROW][C]3[/C][C]0.208416[/C][C]2.2831[/C][C]0.012093[/C][/ROW]
[ROW][C]4[/C][C]0.063766[/C][C]0.6985[/C][C]0.243103[/C][/ROW]
[ROW][C]5[/C][C]0.117394[/C][C]1.286[/C][C]0.100461[/C][/ROW]
[ROW][C]6[/C][C]-0.037905[/C][C]-0.4152[/C][C]0.339357[/C][/ROW]
[ROW][C]7[/C][C]-0.169765[/C][C]-1.8597[/C][C]0.03269[/C][/ROW]
[ROW][C]8[/C][C]-0.089851[/C][C]-0.9843[/C][C]0.163481[/C][/ROW]
[ROW][C]9[/C][C]-0.040233[/C][C]-0.4407[/C][C]0.3301[/C][/ROW]
[ROW][C]10[/C][C]0.096083[/C][C]1.0525[/C][C]0.147334[/C][/ROW]
[ROW][C]11[/C][C]0.158377[/C][C]1.7349[/C][C]0.04266[/C][/ROW]
[ROW][C]12[/C][C]-0.025331[/C][C]-0.2775[/C][C]0.390941[/C][/ROW]
[ROW][C]13[/C][C]-0.334452[/C][C]-3.6637[/C][C]0.000186[/C][/ROW]
[ROW][C]14[/C][C]-0.030768[/C][C]-0.337[/C][C]0.368335[/C][/ROW]
[ROW][C]15[/C][C]0.064341[/C][C]0.7048[/C][C]0.241145[/C][/ROW]
[ROW][C]16[/C][C]0.019983[/C][C]0.2189[/C][C]0.41355[/C][/ROW]
[ROW][C]17[/C][C]-0.002383[/C][C]-0.0261[/C][C]0.489608[/C][/ROW]
[ROW][C]18[/C][C]0.007745[/C][C]0.0848[/C][C]0.466264[/C][/ROW]
[ROW][C]19[/C][C]-0.062072[/C][C]-0.68[/C][C]0.248918[/C][/ROW]
[ROW][C]20[/C][C]-0.037212[/C][C]-0.4076[/C][C]0.342131[/C][/ROW]
[ROW][C]21[/C][C]-0.031932[/C][C]-0.3498[/C][C]0.363554[/C][/ROW]
[ROW][C]22[/C][C]0.010411[/C][C]0.114[/C][C]0.454696[/C][/ROW]
[ROW][C]23[/C][C]0.031309[/C][C]0.343[/C][C]0.366108[/C][/ROW]
[ROW][C]24[/C][C]0.016603[/C][C]0.1819[/C][C]0.427995[/C][/ROW]
[ROW][C]25[/C][C]-0.133461[/C][C]-1.462[/C][C]0.073179[/C][/ROW]
[ROW][C]26[/C][C]-0.049394[/C][C]-0.5411[/C][C]0.294727[/C][/ROW]
[ROW][C]27[/C][C]0.018731[/C][C]0.2052[/C][C]0.418885[/C][/ROW]
[ROW][C]28[/C][C]-0.07422[/C][C]-0.813[/C][C]0.208903[/C][/ROW]
[ROW][C]29[/C][C]0.005435[/C][C]0.0595[/C][C]0.476313[/C][/ROW]
[ROW][C]30[/C][C]0.01724[/C][C]0.1888[/C][C]0.425265[/C][/ROW]
[ROW][C]31[/C][C]-0.079187[/C][C]-0.8675[/C][C]0.193713[/C][/ROW]
[ROW][C]32[/C][C]0.027799[/C][C]0.3045[/C][C]0.380627[/C][/ROW]
[ROW][C]33[/C][C]-0.018735[/C][C]-0.2052[/C][C]0.418871[/C][/ROW]
[ROW][C]34[/C][C]0.026984[/C][C]0.2956[/C][C]0.384026[/C][/ROW]
[ROW][C]35[/C][C]-0.021643[/C][C]-0.2371[/C][C]0.406496[/C][/ROW]
[ROW][C]36[/C][C]-0.042848[/C][C]-0.4694[/C][C]0.319825[/C][/ROW]
[ROW][C]37[/C][C]-0.054525[/C][C]-0.5973[/C][C]0.27572[/C][/ROW]
[ROW][C]38[/C][C]-0.031964[/C][C]-0.3501[/C][C]0.363421[/C][/ROW]
[ROW][C]39[/C][C]-0.030207[/C][C]-0.3309[/C][C]0.370648[/C][/ROW]
[ROW][C]40[/C][C]-0.122958[/C][C]-1.3469[/C][C]0.09027[/C][/ROW]
[ROW][C]41[/C][C]0.051234[/C][C]0.5612[/C][C]0.287839[/C][/ROW]
[ROW][C]42[/C][C]0.020083[/C][C]0.22[/C][C]0.413124[/C][/ROW]
[ROW][C]43[/C][C]-0.002534[/C][C]-0.0278[/C][C]0.488952[/C][/ROW]
[ROW][C]44[/C][C]0.005901[/C][C]0.0646[/C][C]0.474281[/C][/ROW]
[ROW][C]45[/C][C]-0.015459[/C][C]-0.1693[/C][C]0.432904[/C][/ROW]
[ROW][C]46[/C][C]0.058252[/C][C]0.6381[/C][C]0.262306[/C][/ROW]
[ROW][C]47[/C][C]-0.040549[/C][C]-0.4442[/C][C]0.328854[/C][/ROW]
[ROW][C]48[/C][C]-0.009777[/C][C]-0.1071[/C][C]0.457442[/C][/ROW]
[/TABLE]
Source: https://freestatistics.org/blog/index.php?pk=168953&T=2

Globally Unique Identifier (entire table): ba.freestatistics.org/blog/index.php?pk=168953&T=2

As an alternative you can also use a QR Code:  

The GUIDs for individual cells are displayed in the table below:

Partial Autocorrelation Function
Time lag kPACF(k)T-STATP-value
10.96641610.58660
2-0.034753-0.38070.352051
30.2084162.28310.012093
40.0637660.69850.243103
50.1173941.2860.100461
6-0.037905-0.41520.339357
7-0.169765-1.85970.03269
8-0.089851-0.98430.163481
9-0.040233-0.44070.3301
100.0960831.05250.147334
110.1583771.73490.04266
12-0.025331-0.27750.390941
13-0.334452-3.66370.000186
14-0.030768-0.3370.368335
150.0643410.70480.241145
160.0199830.21890.41355
17-0.002383-0.02610.489608
180.0077450.08480.466264
19-0.062072-0.680.248918
20-0.037212-0.40760.342131
21-0.031932-0.34980.363554
220.0104110.1140.454696
230.0313090.3430.366108
240.0166030.18190.427995
25-0.133461-1.4620.073179
26-0.049394-0.54110.294727
270.0187310.20520.418885
28-0.07422-0.8130.208903
290.0054350.05950.476313
300.017240.18880.425265
31-0.079187-0.86750.193713
320.0277990.30450.380627
33-0.018735-0.20520.418871
340.0269840.29560.384026
35-0.021643-0.23710.406496
36-0.042848-0.46940.319825
37-0.054525-0.59730.27572
38-0.031964-0.35010.363421
39-0.030207-0.33090.370648
40-0.122958-1.34690.09027
410.0512340.56120.287839
420.0200830.220.413124
43-0.002534-0.02780.488952
440.0059010.06460.474281
45-0.015459-0.16930.432904
460.0582520.63810.262306
47-0.040549-0.44420.328854
48-0.009777-0.10710.457442


Parameters (Session):
par1 = 48 ; par2 = 1 ; par3 = 0 ; par4 = 0 ; par5 = 12 ; par6 = White Noise ; par7 = 0.95 ;
Parameters (R input):
par1 = 48 ; par2 = 1 ; par3 = 0 ; par4 = 0 ; par5 = 12 ; par6 = White Noise ; par7 = 0.95 ; par8 = ;
R code (references can be found in the software module):
if (par1 == 'Default') {
par1 = 10*log10(length(x))
} else {
par1 <- as.numeric(par1)
}
par2 <- as.numeric(par2)
par3 <- as.numeric(par3)
par4 <- as.numeric(par4)
par5 <- as.numeric(par5)
if (par6 == 'White Noise') par6 <- 'white' else par6 <- 'ma'
par7 <- as.numeric(par7)
if (par8 != '') par8 <- as.numeric(par8)
ox <- x
if (par8 == '') {
if (par2 == 0) {
x <- log(x)
} else {
x <- (x ^ par2 - 1) / par2
}
} else {
x <- log(x,base=par8)
}
if (par3 > 0) x <- diff(x,lag=1,difference=par3)
if (par4 > 0) x <- diff(x,lag=par5,difference=par4)
bitmap(file='picts.png')
op <- par(mfrow=c(2,1))
plot(ox,type='l',main='Original Time Series',xlab='time',ylab='value')
if (par8=='') {
mytitle <- paste('Working Time Series (lambda=',par2,', d=',par3,', D=',par4,')',sep='')
mysub <- paste('(lambda=',par2,', d=',par3,', D=',par4,', CI=', par7, ', CI type=',par6,')',sep='')
} else {
mytitle <- paste('Working Time Series (base=',par8,', d=',par3,', D=',par4,')',sep='')
mysub <- paste('(base=',par8,', d=',par3,', D=',par4,', CI=', par7, ', CI type=',par6,')',sep='')
}
plot(x,type='l', main=mytitle,xlab='time',ylab='value')
par(op)
dev.off()
bitmap(file='pic1.png')
racf <- acf(x, par1, main='Autocorrelation', xlab='time lag', ylab='ACF', ci.type=par6, ci=par7, sub=mysub)
dev.off()
bitmap(file='pic2.png')
rpacf <- pacf(x,par1,main='Partial Autocorrelation',xlab='lags',ylab='PACF',sub=mysub)
dev.off()
(myacf <- c(racf$acf))
(mypacf <- c(rpacf$acf))
lengthx <- length(x)
sqrtn <- sqrt(lengthx)
load(file='createtable')
a<-table.start()
a<-table.row.start(a)
a<-table.element(a,'Autocorrelation Function',4,TRUE)
a<-table.row.end(a)
a<-table.row.start(a)
a<-table.element(a,'Time lag k',header=TRUE)
a<-table.element(a,hyperlink('basics.htm','ACF(k)','click here for more information about the Autocorrelation Function'),header=TRUE)
a<-table.element(a,'T-STAT',header=TRUE)
a<-table.element(a,'P-value',header=TRUE)
a<-table.row.end(a)
for (i in 2:(par1+1)) {
a<-table.row.start(a)
a<-table.element(a,i-1,header=TRUE)
a<-table.element(a,round(myacf[i],6))
mytstat <- myacf[i]*sqrtn
a<-table.element(a,round(mytstat,4))
a<-table.element(a,round(1-pt(abs(mytstat),lengthx),6))
a<-table.row.end(a)
}
a<-table.end(a)
table.save(a,file='mytable.tab')
a<-table.start()
a<-table.row.start(a)
a<-table.element(a,'Partial Autocorrelation Function',4,TRUE)
a<-table.row.end(a)
a<-table.row.start(a)
a<-table.element(a,'Time lag k',header=TRUE)
a<-table.element(a,hyperlink('basics.htm','PACF(k)','click here for more information about the Partial Autocorrelation Function'),header=TRUE)
a<-table.element(a,'T-STAT',header=TRUE)
a<-table.element(a,'P-value',header=TRUE)
a<-table.row.end(a)
for (i in 1:par1) {
a<-table.row.start(a)
a<-table.element(a,i,header=TRUE)
a<-table.element(a,round(mypacf[i],6))
mytstat <- mypacf[i]*sqrtn
a<-table.element(a,round(mytstat,4))
a<-table.element(a,round(1-pt(abs(mytstat),lengthx),6))
a<-table.row.end(a)
}
a<-table.end(a)
table.save(a,file='mytable1.tab')