Free Statistics
of Irreproducible Research!
Description of Statistical Computation | |||||||||||||||||||||||||||||||||||||
|---|---|---|---|---|---|---|---|---|---|---|---|---|---|---|---|---|---|---|---|---|---|---|---|---|---|---|---|---|---|---|---|---|---|---|---|---|---|
| Author's title | |||||||||||||||||||||||||||||||||||||
| Author | *Unverified author* | ||||||||||||||||||||||||||||||||||||
| R Software Module | rwasp_spearman.wasp | ||||||||||||||||||||||||||||||||||||
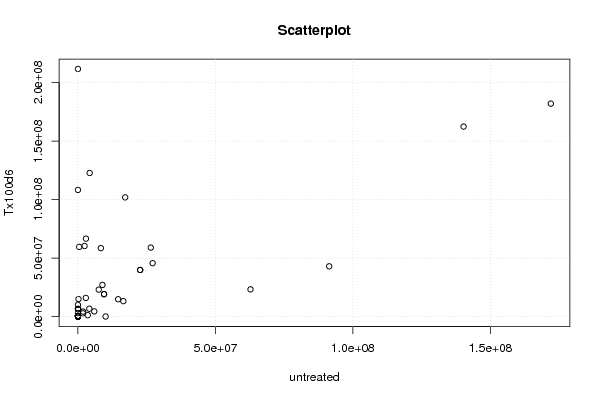
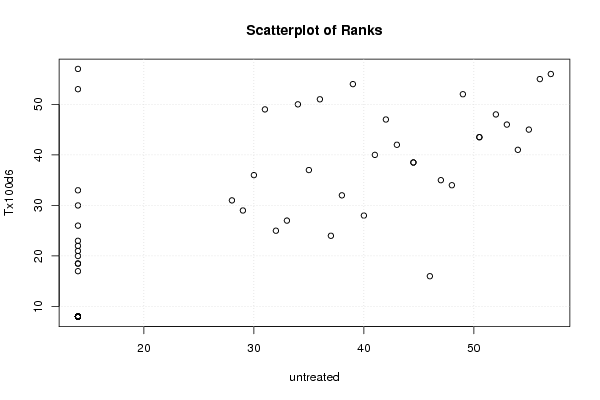
| Title produced by software | Spearman Rank Correlation | ||||||||||||||||||||||||||||||||||||
| Date of computation | Mon, 12 Mar 2012 20:51:41 -0400 | ||||||||||||||||||||||||||||||||||||
| Cite this page as follows | Statistical Computations at FreeStatistics.org, Office for Research Development and Education, URL https://freestatistics.org/blog/index.php?v=date/2012/Mar/12/t1331600108bcleitm9n0qpqww.htm/, Retrieved Sun, 28 Apr 2024 21:40:58 +0000 | ||||||||||||||||||||||||||||||||||||
| Statistical Computations at FreeStatistics.org, Office for Research Development and Education, URL https://freestatistics.org/blog/index.php?pk=163952, Retrieved Sun, 28 Apr 2024 21:40:58 +0000 | |||||||||||||||||||||||||||||||||||||
| QR Codes: | |||||||||||||||||||||||||||||||||||||
|
| |||||||||||||||||||||||||||||||||||||
| Original text written by user: | |||||||||||||||||||||||||||||||||||||
| IsPrivate? | No (this computation is public) | ||||||||||||||||||||||||||||||||||||
| User-defined keywords | |||||||||||||||||||||||||||||||||||||
| Estimated Impact | 165 | ||||||||||||||||||||||||||||||||||||
Tree of Dependent Computations | |||||||||||||||||||||||||||||||||||||
| Family? (F = Feedback message, R = changed R code, M = changed R Module, P = changed Parameters, D = changed Data) | |||||||||||||||||||||||||||||||||||||
| - [Spearman Rank Correlation] [MAPK related genes ] [2012-03-13 00:51:41] [d41d8cd98f00b204e9800998ecf8427e] [Current] | |||||||||||||||||||||||||||||||||||||
| Feedback Forum | |||||||||||||||||||||||||||||||||||||
Post a new message | |||||||||||||||||||||||||||||||||||||
Dataset | |||||||||||||||||||||||||||||||||||||
| Dataseries X: | |||||||||||||||||||||||||||||||||||||
0 0 0 5937098.5 0 2898816.667 0 10064966.67 0 124928.1667 4265127.767 62745103.33 0 1880150 0 7562716.667 4120556 193585.3167 0 27151993.33 0 0 0 0 171967373.3 17171995.87 16492062.5 0 456315 14617078.17 0 0 22624366.67 22624366.67 9495636.65 9495636.65 0 0 0 91366125 0 0 0 0 8310883.333 140240103.3 2405900 0 0 1805566.667 3577851.667 0 26480560.33 0 8906686.667 370.065 2.86E+06 | |||||||||||||||||||||||||||||||||||||
| Dataseries Y: | |||||||||||||||||||||||||||||||||||||
644315.634 0 0 4490672.84 0 66628420 211617800 117626.2 556163.93 6495448.6 122740176.4 23317800 0 4292881.6 0 23086774.2 6762189.4 15008680.6 0 45678360 0 0 0 9994940 181996860 101934426 13249210 0 59603333 14884118 402161.4 402161.4 39875028 39875028 19180988 19180988 0 0 0 42999682 772028.5383 120559.8 0 6618272 58547600 162395540 60372804 3055546 108263626 2861663.969 1241558.42 565354.2 58999216 0 27111222 6722324 1.60E+07 | |||||||||||||||||||||||||||||||||||||
Tables (Output of Computation) | |||||||||||||||||||||||||||||||||||||
| |||||||||||||||||||||||||||||||||||||
Figures (Output of Computation) | |||||||||||||||||||||||||||||||||||||
Input Parameters & R Code | |||||||||||||||||||||||||||||||||||||
| Parameters (Session): | |||||||||||||||||||||||||||||||||||||
| Parameters (R input): | |||||||||||||||||||||||||||||||||||||
| R code (references can be found in the software module): | |||||||||||||||||||||||||||||||||||||
k <- cor.test(x,y,method='spearman') | |||||||||||||||||||||||||||||||||||||