Free Statistics

of Irreproducible Research!

Author's title

Author*Unverified author*
R Software Modulerwasp_autocorrelation.wasp
Title produced by software(Partial) Autocorrelation Function
Date of computationMon, 26 Mar 2012 03:51:30 -0400
Cite this page as followsStatistical Computations at FreeStatistics.org, Office for Research Development and Education, URL https://freestatistics.org/blog/index.php?v=date/2012/Mar/26/t13327483426xav95k4opn8z3g.htm/, Retrieved Thu, 02 May 2024 02:58:07 +0000
Statistical Computations at FreeStatistics.org, Office for Research Development and Education, URL https://freestatistics.org/blog/index.php?pk=164079, Retrieved Thu, 02 May 2024 02:58:07 +0000
QR Codes:

Original text written by user:
IsPrivate?No (this computation is public)
User-defined keywords
Estimated Impact124
Family? (F = Feedback message, R = changed R code, M = changed R Module, P = changed Parameters, D = changed Data)
-       [(Partial) Autocorrelation Function] [Autocorrelatie we...] [2012-03-26 07:51:30] [d08a5fa9e4c562ec79e796d78c067f4f] [Current]
Feedback Forum

Post a new message
Dataseries X:
593
590
580
574
573
573
620
626
620
588
566
557
561
549
532
526
511
499
555
565
542
527
510
514
517
508
493
490
469
478
528
534
518
506
502
516
528
533
536
537
524
536
587
597
581
564
558
575
580
575
563
552
537
545
601
604
586
564
549
551


Summary of computational transaction
Raw Inputview raw input (R code)
Raw Outputview raw output of R engine
Computing time2 seconds
R Server'Gwilym Jenkins' @ jenkins.wessa.net

\begin{tabular}{lllllllll}
\hline
Summary of computational transaction \tabularnewline
Raw Input & view raw input (R code)  \tabularnewline
Raw Output & view raw output of R engine  \tabularnewline
Computing time & 2 seconds \tabularnewline
R Server & 'Gwilym Jenkins' @ jenkins.wessa.net \tabularnewline
\hline
\end{tabular}
%Source: https://freestatistics.org/blog/index.php?pk=164079&T=0

[TABLE]
[ROW][C]Summary of computational transaction[/C][/ROW]
[ROW][C]Raw Input[/C][C]view raw input (R code) [/C][/ROW]
[ROW][C]Raw Output[/C][C]view raw output of R engine [/C][/ROW]
[ROW][C]Computing time[/C][C]2 seconds[/C][/ROW]
[ROW][C]R Server[/C][C]'Gwilym Jenkins' @ jenkins.wessa.net[/C][/ROW]
[/TABLE]
Source: https://freestatistics.org/blog/index.php?pk=164079&T=0

Globally Unique Identifier (entire table): ba.freestatistics.org/blog/index.php?pk=164079&T=0

As an alternative you can also use a QR Code:  

The GUIDs for individual cells are displayed in the table below:

Summary of computational transaction
Raw Inputview raw input (R code)
Raw Outputview raw output of R engine
Computing time2 seconds
R Server'Gwilym Jenkins' @ jenkins.wessa.net


Autocorrelation Function
Time lag kACF(k)T-STATP-value
10.2653232.0380.023021
2-0.317061-2.43540.008958
3-0.353078-2.7120.004374
4-0.207978-1.59750.057747
50.1245510.95670.171312
60.3060122.35050.011055
70.1321361.0150.157136
8-0.154811-1.18910.119576
9-0.316786-2.43330.009006
10-0.303923-2.33450.011497
110.2222121.70680.046555
120.7119765.46880
130.1323511.01660.156746
14-0.301451-2.31550.012041
15-0.262099-2.01320.02433
16-0.166479-1.27870.102996
170.116390.8940.187475
180.1996691.53370.065226
190.0518330.39810.345984
20-0.16606-1.27550.10356
21-0.272464-2.09280.020337
22-0.239-1.83580.035714
230.1864271.4320.078714
240.4950443.80250.000171
250.0552850.42470.336317
26-0.235276-1.80720.037916
27-0.223029-1.71310.045971
28-0.144458-1.10960.135836
290.0767540.58960.27887
300.1365541.04890.149252
310.0440450.33830.368164
32-0.110844-0.85140.198992
33-0.182544-1.40210.083055
34-0.126351-0.97050.167874
350.1668471.28160.102503
360.348612.67770.004793
370.0252470.19390.423451
38-0.134073-1.02980.153646
39-0.131276-1.00840.158701
40-0.076444-0.58720.279664
410.0687840.52830.299622
420.0849970.65290.258187
430.0170620.13110.448089
44-0.076324-0.58630.279971
45-0.114459-0.87920.191437
46-0.030381-0.23340.408144
470.0901450.69240.245696
480.1796931.38020.086359

\begin{tabular}{lllllllll}
\hline
Autocorrelation Function \tabularnewline
Time lag k & ACF(k) & T-STAT & P-value \tabularnewline
1 & 0.265323 & 2.038 & 0.023021 \tabularnewline
2 & -0.317061 & -2.4354 & 0.008958 \tabularnewline
3 & -0.353078 & -2.712 & 0.004374 \tabularnewline
4 & -0.207978 & -1.5975 & 0.057747 \tabularnewline
5 & 0.124551 & 0.9567 & 0.171312 \tabularnewline
6 & 0.306012 & 2.3505 & 0.011055 \tabularnewline
7 & 0.132136 & 1.015 & 0.157136 \tabularnewline
8 & -0.154811 & -1.1891 & 0.119576 \tabularnewline
9 & -0.316786 & -2.4333 & 0.009006 \tabularnewline
10 & -0.303923 & -2.3345 & 0.011497 \tabularnewline
11 & 0.222212 & 1.7068 & 0.046555 \tabularnewline
12 & 0.711976 & 5.4688 & 0 \tabularnewline
13 & 0.132351 & 1.0166 & 0.156746 \tabularnewline
14 & -0.301451 & -2.3155 & 0.012041 \tabularnewline
15 & -0.262099 & -2.0132 & 0.02433 \tabularnewline
16 & -0.166479 & -1.2787 & 0.102996 \tabularnewline
17 & 0.11639 & 0.894 & 0.187475 \tabularnewline
18 & 0.199669 & 1.5337 & 0.065226 \tabularnewline
19 & 0.051833 & 0.3981 & 0.345984 \tabularnewline
20 & -0.16606 & -1.2755 & 0.10356 \tabularnewline
21 & -0.272464 & -2.0928 & 0.020337 \tabularnewline
22 & -0.239 & -1.8358 & 0.035714 \tabularnewline
23 & 0.186427 & 1.432 & 0.078714 \tabularnewline
24 & 0.495044 & 3.8025 & 0.000171 \tabularnewline
25 & 0.055285 & 0.4247 & 0.336317 \tabularnewline
26 & -0.235276 & -1.8072 & 0.037916 \tabularnewline
27 & -0.223029 & -1.7131 & 0.045971 \tabularnewline
28 & -0.144458 & -1.1096 & 0.135836 \tabularnewline
29 & 0.076754 & 0.5896 & 0.27887 \tabularnewline
30 & 0.136554 & 1.0489 & 0.149252 \tabularnewline
31 & 0.044045 & 0.3383 & 0.368164 \tabularnewline
32 & -0.110844 & -0.8514 & 0.198992 \tabularnewline
33 & -0.182544 & -1.4021 & 0.083055 \tabularnewline
34 & -0.126351 & -0.9705 & 0.167874 \tabularnewline
35 & 0.166847 & 1.2816 & 0.102503 \tabularnewline
36 & 0.34861 & 2.6777 & 0.004793 \tabularnewline
37 & 0.025247 & 0.1939 & 0.423451 \tabularnewline
38 & -0.134073 & -1.0298 & 0.153646 \tabularnewline
39 & -0.131276 & -1.0084 & 0.158701 \tabularnewline
40 & -0.076444 & -0.5872 & 0.279664 \tabularnewline
41 & 0.068784 & 0.5283 & 0.299622 \tabularnewline
42 & 0.084997 & 0.6529 & 0.258187 \tabularnewline
43 & 0.017062 & 0.1311 & 0.448089 \tabularnewline
44 & -0.076324 & -0.5863 & 0.279971 \tabularnewline
45 & -0.114459 & -0.8792 & 0.191437 \tabularnewline
46 & -0.030381 & -0.2334 & 0.408144 \tabularnewline
47 & 0.090145 & 0.6924 & 0.245696 \tabularnewline
48 & 0.179693 & 1.3802 & 0.086359 \tabularnewline
\hline
\end{tabular}
%Source: https://freestatistics.org/blog/index.php?pk=164079&T=1

[TABLE]
[ROW][C]Autocorrelation Function[/C][/ROW]
[ROW][C]Time lag k[/C][C]ACF(k)[/C][C]T-STAT[/C][C]P-value[/C][/ROW]
[ROW][C]1[/C][C]0.265323[/C][C]2.038[/C][C]0.023021[/C][/ROW]
[ROW][C]2[/C][C]-0.317061[/C][C]-2.4354[/C][C]0.008958[/C][/ROW]
[ROW][C]3[/C][C]-0.353078[/C][C]-2.712[/C][C]0.004374[/C][/ROW]
[ROW][C]4[/C][C]-0.207978[/C][C]-1.5975[/C][C]0.057747[/C][/ROW]
[ROW][C]5[/C][C]0.124551[/C][C]0.9567[/C][C]0.171312[/C][/ROW]
[ROW][C]6[/C][C]0.306012[/C][C]2.3505[/C][C]0.011055[/C][/ROW]
[ROW][C]7[/C][C]0.132136[/C][C]1.015[/C][C]0.157136[/C][/ROW]
[ROW][C]8[/C][C]-0.154811[/C][C]-1.1891[/C][C]0.119576[/C][/ROW]
[ROW][C]9[/C][C]-0.316786[/C][C]-2.4333[/C][C]0.009006[/C][/ROW]
[ROW][C]10[/C][C]-0.303923[/C][C]-2.3345[/C][C]0.011497[/C][/ROW]
[ROW][C]11[/C][C]0.222212[/C][C]1.7068[/C][C]0.046555[/C][/ROW]
[ROW][C]12[/C][C]0.711976[/C][C]5.4688[/C][C]0[/C][/ROW]
[ROW][C]13[/C][C]0.132351[/C][C]1.0166[/C][C]0.156746[/C][/ROW]
[ROW][C]14[/C][C]-0.301451[/C][C]-2.3155[/C][C]0.012041[/C][/ROW]
[ROW][C]15[/C][C]-0.262099[/C][C]-2.0132[/C][C]0.02433[/C][/ROW]
[ROW][C]16[/C][C]-0.166479[/C][C]-1.2787[/C][C]0.102996[/C][/ROW]
[ROW][C]17[/C][C]0.11639[/C][C]0.894[/C][C]0.187475[/C][/ROW]
[ROW][C]18[/C][C]0.199669[/C][C]1.5337[/C][C]0.065226[/C][/ROW]
[ROW][C]19[/C][C]0.051833[/C][C]0.3981[/C][C]0.345984[/C][/ROW]
[ROW][C]20[/C][C]-0.16606[/C][C]-1.2755[/C][C]0.10356[/C][/ROW]
[ROW][C]21[/C][C]-0.272464[/C][C]-2.0928[/C][C]0.020337[/C][/ROW]
[ROW][C]22[/C][C]-0.239[/C][C]-1.8358[/C][C]0.035714[/C][/ROW]
[ROW][C]23[/C][C]0.186427[/C][C]1.432[/C][C]0.078714[/C][/ROW]
[ROW][C]24[/C][C]0.495044[/C][C]3.8025[/C][C]0.000171[/C][/ROW]
[ROW][C]25[/C][C]0.055285[/C][C]0.4247[/C][C]0.336317[/C][/ROW]
[ROW][C]26[/C][C]-0.235276[/C][C]-1.8072[/C][C]0.037916[/C][/ROW]
[ROW][C]27[/C][C]-0.223029[/C][C]-1.7131[/C][C]0.045971[/C][/ROW]
[ROW][C]28[/C][C]-0.144458[/C][C]-1.1096[/C][C]0.135836[/C][/ROW]
[ROW][C]29[/C][C]0.076754[/C][C]0.5896[/C][C]0.27887[/C][/ROW]
[ROW][C]30[/C][C]0.136554[/C][C]1.0489[/C][C]0.149252[/C][/ROW]
[ROW][C]31[/C][C]0.044045[/C][C]0.3383[/C][C]0.368164[/C][/ROW]
[ROW][C]32[/C][C]-0.110844[/C][C]-0.8514[/C][C]0.198992[/C][/ROW]
[ROW][C]33[/C][C]-0.182544[/C][C]-1.4021[/C][C]0.083055[/C][/ROW]
[ROW][C]34[/C][C]-0.126351[/C][C]-0.9705[/C][C]0.167874[/C][/ROW]
[ROW][C]35[/C][C]0.166847[/C][C]1.2816[/C][C]0.102503[/C][/ROW]
[ROW][C]36[/C][C]0.34861[/C][C]2.6777[/C][C]0.004793[/C][/ROW]
[ROW][C]37[/C][C]0.025247[/C][C]0.1939[/C][C]0.423451[/C][/ROW]
[ROW][C]38[/C][C]-0.134073[/C][C]-1.0298[/C][C]0.153646[/C][/ROW]
[ROW][C]39[/C][C]-0.131276[/C][C]-1.0084[/C][C]0.158701[/C][/ROW]
[ROW][C]40[/C][C]-0.076444[/C][C]-0.5872[/C][C]0.279664[/C][/ROW]
[ROW][C]41[/C][C]0.068784[/C][C]0.5283[/C][C]0.299622[/C][/ROW]
[ROW][C]42[/C][C]0.084997[/C][C]0.6529[/C][C]0.258187[/C][/ROW]
[ROW][C]43[/C][C]0.017062[/C][C]0.1311[/C][C]0.448089[/C][/ROW]
[ROW][C]44[/C][C]-0.076324[/C][C]-0.5863[/C][C]0.279971[/C][/ROW]
[ROW][C]45[/C][C]-0.114459[/C][C]-0.8792[/C][C]0.191437[/C][/ROW]
[ROW][C]46[/C][C]-0.030381[/C][C]-0.2334[/C][C]0.408144[/C][/ROW]
[ROW][C]47[/C][C]0.090145[/C][C]0.6924[/C][C]0.245696[/C][/ROW]
[ROW][C]48[/C][C]0.179693[/C][C]1.3802[/C][C]0.086359[/C][/ROW]
[/TABLE]
Source: https://freestatistics.org/blog/index.php?pk=164079&T=1

Globally Unique Identifier (entire table): ba.freestatistics.org/blog/index.php?pk=164079&T=1

As an alternative you can also use a QR Code:  

The GUIDs for individual cells are displayed in the table below:

Autocorrelation Function
Time lag kACF(k)T-STATP-value
10.2653232.0380.023021
2-0.317061-2.43540.008958
3-0.353078-2.7120.004374
4-0.207978-1.59750.057747
50.1245510.95670.171312
60.3060122.35050.011055
70.1321361.0150.157136
8-0.154811-1.18910.119576
9-0.316786-2.43330.009006
10-0.303923-2.33450.011497
110.2222121.70680.046555
120.7119765.46880
130.1323511.01660.156746
14-0.301451-2.31550.012041
15-0.262099-2.01320.02433
16-0.166479-1.27870.102996
170.116390.8940.187475
180.1996691.53370.065226
190.0518330.39810.345984
20-0.16606-1.27550.10356
21-0.272464-2.09280.020337
22-0.239-1.83580.035714
230.1864271.4320.078714
240.4950443.80250.000171
250.0552850.42470.336317
26-0.235276-1.80720.037916
27-0.223029-1.71310.045971
28-0.144458-1.10960.135836
290.0767540.58960.27887
300.1365541.04890.149252
310.0440450.33830.368164
32-0.110844-0.85140.198992
33-0.182544-1.40210.083055
34-0.126351-0.97050.167874
350.1668471.28160.102503
360.348612.67770.004793
370.0252470.19390.423451
38-0.134073-1.02980.153646
39-0.131276-1.00840.158701
40-0.076444-0.58720.279664
410.0687840.52830.299622
420.0849970.65290.258187
430.0170620.13110.448089
44-0.076324-0.58630.279971
45-0.114459-0.87920.191437
46-0.030381-0.23340.408144
470.0901450.69240.245696
480.1796931.38020.086359


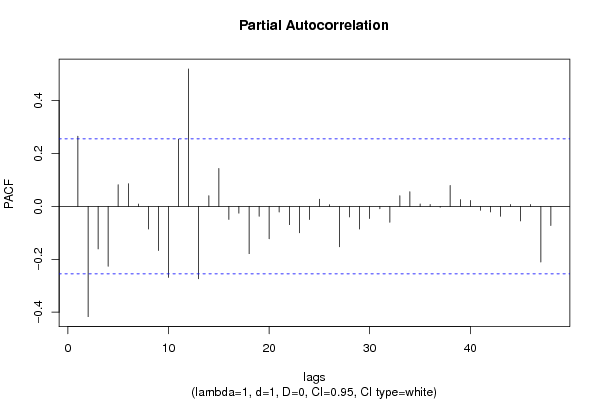
Partial Autocorrelation Function
Time lag kPACF(k)T-STATP-value
10.2653232.0380.023021
2-0.416799-3.20150.001102
3-0.16053-1.23310.111223
4-0.226243-1.73780.043731
50.082010.62990.265585
60.0857230.65840.256405
70.0088290.06780.473079
8-0.085202-0.65440.257683
9-0.167014-1.28290.102279
10-0.268292-2.06080.02187
110.2537831.94930.028007
120.5197653.99249.2e-05
13-0.273837-2.10340.019853
140.0406690.31240.377925
150.1434171.10160.137553
16-0.049171-0.37770.353508
17-0.025435-0.19540.422886
18-0.178619-1.3720.08763
19-0.037115-0.28510.388288
20-0.122269-0.93920.175737
21-0.02095-0.16090.436353
22-0.068939-0.52950.299213
23-0.099849-0.7670.223084
24-0.049188-0.37780.35346
250.0273770.21030.417086
260.0063860.0490.480523
27-0.152795-1.17360.122628
28-0.039645-0.30450.380903
29-0.085181-0.65430.257735
30-0.045913-0.35270.362798
31-0.008543-0.06560.47395
32-0.05978-0.45920.323896
330.0401210.30820.379516
340.0556340.42730.335345
350.009120.07010.472194
360.0072180.05540.477985
37-0.002962-0.02280.490962
380.0788650.60580.273494
390.0256030.19670.422385
400.0225580.17330.431515
41-0.01483-0.11390.454847
42-0.020623-0.15840.437339
43-0.037228-0.2860.387959
440.0072870.0560.477777
45-0.054661-0.41990.338057
460.0069640.05350.47876
47-0.210384-1.6160.055716
48-0.071977-0.55290.291221

\begin{tabular}{lllllllll}
\hline
Partial Autocorrelation Function \tabularnewline
Time lag k & PACF(k) & T-STAT & P-value \tabularnewline
1 & 0.265323 & 2.038 & 0.023021 \tabularnewline
2 & -0.416799 & -3.2015 & 0.001102 \tabularnewline
3 & -0.16053 & -1.2331 & 0.111223 \tabularnewline
4 & -0.226243 & -1.7378 & 0.043731 \tabularnewline
5 & 0.08201 & 0.6299 & 0.265585 \tabularnewline
6 & 0.085723 & 0.6584 & 0.256405 \tabularnewline
7 & 0.008829 & 0.0678 & 0.473079 \tabularnewline
8 & -0.085202 & -0.6544 & 0.257683 \tabularnewline
9 & -0.167014 & -1.2829 & 0.102279 \tabularnewline
10 & -0.268292 & -2.0608 & 0.02187 \tabularnewline
11 & 0.253783 & 1.9493 & 0.028007 \tabularnewline
12 & 0.519765 & 3.9924 & 9.2e-05 \tabularnewline
13 & -0.273837 & -2.1034 & 0.019853 \tabularnewline
14 & 0.040669 & 0.3124 & 0.377925 \tabularnewline
15 & 0.143417 & 1.1016 & 0.137553 \tabularnewline
16 & -0.049171 & -0.3777 & 0.353508 \tabularnewline
17 & -0.025435 & -0.1954 & 0.422886 \tabularnewline
18 & -0.178619 & -1.372 & 0.08763 \tabularnewline
19 & -0.037115 & -0.2851 & 0.388288 \tabularnewline
20 & -0.122269 & -0.9392 & 0.175737 \tabularnewline
21 & -0.02095 & -0.1609 & 0.436353 \tabularnewline
22 & -0.068939 & -0.5295 & 0.299213 \tabularnewline
23 & -0.099849 & -0.767 & 0.223084 \tabularnewline
24 & -0.049188 & -0.3778 & 0.35346 \tabularnewline
25 & 0.027377 & 0.2103 & 0.417086 \tabularnewline
26 & 0.006386 & 0.049 & 0.480523 \tabularnewline
27 & -0.152795 & -1.1736 & 0.122628 \tabularnewline
28 & -0.039645 & -0.3045 & 0.380903 \tabularnewline
29 & -0.085181 & -0.6543 & 0.257735 \tabularnewline
30 & -0.045913 & -0.3527 & 0.362798 \tabularnewline
31 & -0.008543 & -0.0656 & 0.47395 \tabularnewline
32 & -0.05978 & -0.4592 & 0.323896 \tabularnewline
33 & 0.040121 & 0.3082 & 0.379516 \tabularnewline
34 & 0.055634 & 0.4273 & 0.335345 \tabularnewline
35 & 0.00912 & 0.0701 & 0.472194 \tabularnewline
36 & 0.007218 & 0.0554 & 0.477985 \tabularnewline
37 & -0.002962 & -0.0228 & 0.490962 \tabularnewline
38 & 0.078865 & 0.6058 & 0.273494 \tabularnewline
39 & 0.025603 & 0.1967 & 0.422385 \tabularnewline
40 & 0.022558 & 0.1733 & 0.431515 \tabularnewline
41 & -0.01483 & -0.1139 & 0.454847 \tabularnewline
42 & -0.020623 & -0.1584 & 0.437339 \tabularnewline
43 & -0.037228 & -0.286 & 0.387959 \tabularnewline
44 & 0.007287 & 0.056 & 0.477777 \tabularnewline
45 & -0.054661 & -0.4199 & 0.338057 \tabularnewline
46 & 0.006964 & 0.0535 & 0.47876 \tabularnewline
47 & -0.210384 & -1.616 & 0.055716 \tabularnewline
48 & -0.071977 & -0.5529 & 0.291221 \tabularnewline
\hline
\end{tabular}
%Source: https://freestatistics.org/blog/index.php?pk=164079&T=2

[TABLE]
[ROW][C]Partial Autocorrelation Function[/C][/ROW]
[ROW][C]Time lag k[/C][C]PACF(k)[/C][C]T-STAT[/C][C]P-value[/C][/ROW]
[ROW][C]1[/C][C]0.265323[/C][C]2.038[/C][C]0.023021[/C][/ROW]
[ROW][C]2[/C][C]-0.416799[/C][C]-3.2015[/C][C]0.001102[/C][/ROW]
[ROW][C]3[/C][C]-0.16053[/C][C]-1.2331[/C][C]0.111223[/C][/ROW]
[ROW][C]4[/C][C]-0.226243[/C][C]-1.7378[/C][C]0.043731[/C][/ROW]
[ROW][C]5[/C][C]0.08201[/C][C]0.6299[/C][C]0.265585[/C][/ROW]
[ROW][C]6[/C][C]0.085723[/C][C]0.6584[/C][C]0.256405[/C][/ROW]
[ROW][C]7[/C][C]0.008829[/C][C]0.0678[/C][C]0.473079[/C][/ROW]
[ROW][C]8[/C][C]-0.085202[/C][C]-0.6544[/C][C]0.257683[/C][/ROW]
[ROW][C]9[/C][C]-0.167014[/C][C]-1.2829[/C][C]0.102279[/C][/ROW]
[ROW][C]10[/C][C]-0.268292[/C][C]-2.0608[/C][C]0.02187[/C][/ROW]
[ROW][C]11[/C][C]0.253783[/C][C]1.9493[/C][C]0.028007[/C][/ROW]
[ROW][C]12[/C][C]0.519765[/C][C]3.9924[/C][C]9.2e-05[/C][/ROW]
[ROW][C]13[/C][C]-0.273837[/C][C]-2.1034[/C][C]0.019853[/C][/ROW]
[ROW][C]14[/C][C]0.040669[/C][C]0.3124[/C][C]0.377925[/C][/ROW]
[ROW][C]15[/C][C]0.143417[/C][C]1.1016[/C][C]0.137553[/C][/ROW]
[ROW][C]16[/C][C]-0.049171[/C][C]-0.3777[/C][C]0.353508[/C][/ROW]
[ROW][C]17[/C][C]-0.025435[/C][C]-0.1954[/C][C]0.422886[/C][/ROW]
[ROW][C]18[/C][C]-0.178619[/C][C]-1.372[/C][C]0.08763[/C][/ROW]
[ROW][C]19[/C][C]-0.037115[/C][C]-0.2851[/C][C]0.388288[/C][/ROW]
[ROW][C]20[/C][C]-0.122269[/C][C]-0.9392[/C][C]0.175737[/C][/ROW]
[ROW][C]21[/C][C]-0.02095[/C][C]-0.1609[/C][C]0.436353[/C][/ROW]
[ROW][C]22[/C][C]-0.068939[/C][C]-0.5295[/C][C]0.299213[/C][/ROW]
[ROW][C]23[/C][C]-0.099849[/C][C]-0.767[/C][C]0.223084[/C][/ROW]
[ROW][C]24[/C][C]-0.049188[/C][C]-0.3778[/C][C]0.35346[/C][/ROW]
[ROW][C]25[/C][C]0.027377[/C][C]0.2103[/C][C]0.417086[/C][/ROW]
[ROW][C]26[/C][C]0.006386[/C][C]0.049[/C][C]0.480523[/C][/ROW]
[ROW][C]27[/C][C]-0.152795[/C][C]-1.1736[/C][C]0.122628[/C][/ROW]
[ROW][C]28[/C][C]-0.039645[/C][C]-0.3045[/C][C]0.380903[/C][/ROW]
[ROW][C]29[/C][C]-0.085181[/C][C]-0.6543[/C][C]0.257735[/C][/ROW]
[ROW][C]30[/C][C]-0.045913[/C][C]-0.3527[/C][C]0.362798[/C][/ROW]
[ROW][C]31[/C][C]-0.008543[/C][C]-0.0656[/C][C]0.47395[/C][/ROW]
[ROW][C]32[/C][C]-0.05978[/C][C]-0.4592[/C][C]0.323896[/C][/ROW]
[ROW][C]33[/C][C]0.040121[/C][C]0.3082[/C][C]0.379516[/C][/ROW]
[ROW][C]34[/C][C]0.055634[/C][C]0.4273[/C][C]0.335345[/C][/ROW]
[ROW][C]35[/C][C]0.00912[/C][C]0.0701[/C][C]0.472194[/C][/ROW]
[ROW][C]36[/C][C]0.007218[/C][C]0.0554[/C][C]0.477985[/C][/ROW]
[ROW][C]37[/C][C]-0.002962[/C][C]-0.0228[/C][C]0.490962[/C][/ROW]
[ROW][C]38[/C][C]0.078865[/C][C]0.6058[/C][C]0.273494[/C][/ROW]
[ROW][C]39[/C][C]0.025603[/C][C]0.1967[/C][C]0.422385[/C][/ROW]
[ROW][C]40[/C][C]0.022558[/C][C]0.1733[/C][C]0.431515[/C][/ROW]
[ROW][C]41[/C][C]-0.01483[/C][C]-0.1139[/C][C]0.454847[/C][/ROW]
[ROW][C]42[/C][C]-0.020623[/C][C]-0.1584[/C][C]0.437339[/C][/ROW]
[ROW][C]43[/C][C]-0.037228[/C][C]-0.286[/C][C]0.387959[/C][/ROW]
[ROW][C]44[/C][C]0.007287[/C][C]0.056[/C][C]0.477777[/C][/ROW]
[ROW][C]45[/C][C]-0.054661[/C][C]-0.4199[/C][C]0.338057[/C][/ROW]
[ROW][C]46[/C][C]0.006964[/C][C]0.0535[/C][C]0.47876[/C][/ROW]
[ROW][C]47[/C][C]-0.210384[/C][C]-1.616[/C][C]0.055716[/C][/ROW]
[ROW][C]48[/C][C]-0.071977[/C][C]-0.5529[/C][C]0.291221[/C][/ROW]
[/TABLE]
Source: https://freestatistics.org/blog/index.php?pk=164079&T=2

Globally Unique Identifier (entire table): ba.freestatistics.org/blog/index.php?pk=164079&T=2

As an alternative you can also use a QR Code:  

The GUIDs for individual cells are displayed in the table below:

Partial Autocorrelation Function
Time lag kPACF(k)T-STATP-value
10.2653232.0380.023021
2-0.416799-3.20150.001102
3-0.16053-1.23310.111223
4-0.226243-1.73780.043731
50.082010.62990.265585
60.0857230.65840.256405
70.0088290.06780.473079
8-0.085202-0.65440.257683
9-0.167014-1.28290.102279
10-0.268292-2.06080.02187
110.2537831.94930.028007
120.5197653.99249.2e-05
13-0.273837-2.10340.019853
140.0406690.31240.377925
150.1434171.10160.137553
16-0.049171-0.37770.353508
17-0.025435-0.19540.422886
18-0.178619-1.3720.08763
19-0.037115-0.28510.388288
20-0.122269-0.93920.175737
21-0.02095-0.16090.436353
22-0.068939-0.52950.299213
23-0.099849-0.7670.223084
24-0.049188-0.37780.35346
250.0273770.21030.417086
260.0063860.0490.480523
27-0.152795-1.17360.122628
28-0.039645-0.30450.380903
29-0.085181-0.65430.257735
30-0.045913-0.35270.362798
31-0.008543-0.06560.47395
32-0.05978-0.45920.323896
330.0401210.30820.379516
340.0556340.42730.335345
350.009120.07010.472194
360.0072180.05540.477985
37-0.002962-0.02280.490962
380.0788650.60580.273494
390.0256030.19670.422385
400.0225580.17330.431515
41-0.01483-0.11390.454847
42-0.020623-0.15840.437339
43-0.037228-0.2860.387959
440.0072870.0560.477777
45-0.054661-0.41990.338057
460.0069640.05350.47876
47-0.210384-1.6160.055716
48-0.071977-0.55290.291221


Parameters (Session):
par1 = 48 ; par2 = 1 ; par3 = 1 ; par4 = 0 ; par5 = 12 ; par6 = White Noise ; par7 = 0.95 ;
Parameters (R input):
par1 = 48 ; par2 = 1 ; par3 = 1 ; par4 = 0 ; par5 = 12 ; par6 = White Noise ; par7 = 0.95 ; par8 = ;
R code (references can be found in the software module):
if (par1 == 'Default') {
par1 = 10*log10(length(x))
} else {
par1 <- as.numeric(par1)
}
par2 <- as.numeric(par2)
par3 <- as.numeric(par3)
par4 <- as.numeric(par4)
par5 <- as.numeric(par5)
if (par6 == 'White Noise') par6 <- 'white' else par6 <- 'ma'
par7 <- as.numeric(par7)
if (par8 != '') par8 <- as.numeric(par8)
ox <- x
if (par8 == '') {
if (par2 == 0) {
x <- log(x)
} else {
x <- (x ^ par2 - 1) / par2
}
} else {
x <- log(x,base=par8)
}
if (par3 > 0) x <- diff(x,lag=1,difference=par3)
if (par4 > 0) x <- diff(x,lag=par5,difference=par4)
bitmap(file='picts.png')
op <- par(mfrow=c(2,1))
plot(ox,type='l',main='Original Time Series',xlab='time',ylab='value')
if (par8=='') {
mytitle <- paste('Working Time Series (lambda=',par2,', d=',par3,', D=',par4,')',sep='')
mysub <- paste('(lambda=',par2,', d=',par3,', D=',par4,', CI=', par7, ', CI type=',par6,')',sep='')
} else {
mytitle <- paste('Working Time Series (base=',par8,', d=',par3,', D=',par4,')',sep='')
mysub <- paste('(base=',par8,', d=',par3,', D=',par4,', CI=', par7, ', CI type=',par6,')',sep='')
}
plot(x,type='l', main=mytitle,xlab='time',ylab='value')
par(op)
dev.off()
bitmap(file='pic1.png')
racf <- acf(x, par1, main='Autocorrelation', xlab='time lag', ylab='ACF', ci.type=par6, ci=par7, sub=mysub)
dev.off()
bitmap(file='pic2.png')
rpacf <- pacf(x,par1,main='Partial Autocorrelation',xlab='lags',ylab='PACF',sub=mysub)
dev.off()
(myacf <- c(racf$acf))
(mypacf <- c(rpacf$acf))
lengthx <- length(x)
sqrtn <- sqrt(lengthx)
load(file='createtable')
a<-table.start()
a<-table.row.start(a)
a<-table.element(a,'Autocorrelation Function',4,TRUE)
a<-table.row.end(a)
a<-table.row.start(a)
a<-table.element(a,'Time lag k',header=TRUE)
a<-table.element(a,hyperlink('basics.htm','ACF(k)','click here for more information about the Autocorrelation Function'),header=TRUE)
a<-table.element(a,'T-STAT',header=TRUE)
a<-table.element(a,'P-value',header=TRUE)
a<-table.row.end(a)
for (i in 2:(par1+1)) {
a<-table.row.start(a)
a<-table.element(a,i-1,header=TRUE)
a<-table.element(a,round(myacf[i],6))
mytstat <- myacf[i]*sqrtn
a<-table.element(a,round(mytstat,4))
a<-table.element(a,round(1-pt(abs(mytstat),lengthx),6))
a<-table.row.end(a)
}
a<-table.end(a)
table.save(a,file='mytable.tab')
a<-table.start()
a<-table.row.start(a)
a<-table.element(a,'Partial Autocorrelation Function',4,TRUE)
a<-table.row.end(a)
a<-table.row.start(a)
a<-table.element(a,'Time lag k',header=TRUE)
a<-table.element(a,hyperlink('basics.htm','PACF(k)','click here for more information about the Partial Autocorrelation Function'),header=TRUE)
a<-table.element(a,'T-STAT',header=TRUE)
a<-table.element(a,'P-value',header=TRUE)
a<-table.row.end(a)
for (i in 1:par1) {
a<-table.row.start(a)
a<-table.element(a,i,header=TRUE)
a<-table.element(a,round(mypacf[i],6))
mytstat <- mypacf[i]*sqrtn
a<-table.element(a,round(mytstat,4))
a<-table.element(a,round(1-pt(abs(mytstat),lengthx),6))
a<-table.row.end(a)
}
a<-table.end(a)
table.save(a,file='mytable1.tab')