Free Statistics

of Irreproducible Research!

Author's title

Author*Unverified author*
R Software Modulerwasp_autocorrelation.wasp
Title produced by software(Partial) Autocorrelation Function
Date of computationMon, 26 Mar 2012 03:57:55 -0400
Cite this page as followsStatistical Computations at FreeStatistics.org, Office for Research Development and Education, URL https://freestatistics.org/blog/index.php?v=date/2012/Mar/26/t1332748765igauum5kkrsmb3e.htm/, Retrieved Thu, 02 May 2024 00:56:05 +0000
Statistical Computations at FreeStatistics.org, Office for Research Development and Education, URL https://freestatistics.org/blog/index.php?pk=164085, Retrieved Thu, 02 May 2024 00:56:05 +0000
QR Codes:

Original text written by user:
IsPrivate?No (this computation is public)
User-defined keywords
Estimated Impact116
Family? (F = Feedback message, R = changed R code, M = changed R Module, P = changed Parameters, D = changed Data)
-       [(Partial) Autocorrelation Function] [import belgië aut...] [2012-03-26 07:57:55] [0557341c9fb01f967ad344d41189c66a] [Current]
Feedback Forum

Post a new message
Dataseries X:
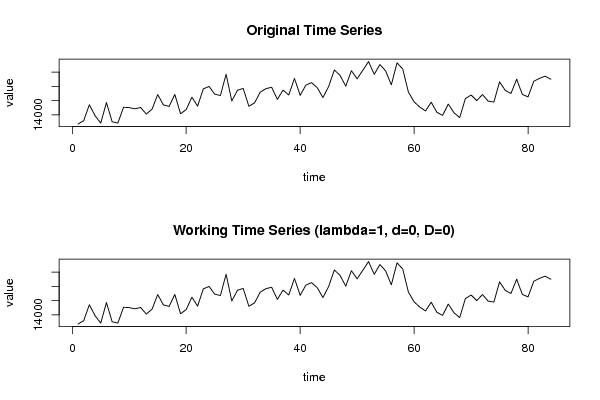
12693.7
13154
15405.1
13869.4
12827.7
15716.7
13012.5
12837.6
15052.7
15002.6
14839.6
15022.6
14097.8
14776.8
16833.3
15385.5
15172.6
16858.9
14143.5
14731.8
16471.6
15214
17637.4
17972.4
16896.2
16698
19691.6
15930.7
17444.6
17699.4
15189.8
15672.7
17180.8
17664.9
17862.9
16162.3
17463.6
16772.1
19106.9
16721.3
18161.3
18509.9
17802.7
16409.9
17967.7
20286.6
19537.3
18021.9
20194.3
19049.6
20244.7
21473.3
19673.6
21053.2
20159.5
18203.6
21289.5
20432.3
17180.4
15816.8
15076.6
14531.6
15761.3
14345.5
13916.8
15496.8
14285.6
13597.3
16263.1
16773.3
15986.9
16842.6
15911.9
15782.9
18622.8
17422.5
16989.8
18990.5
16849.3
16511.3
18704.5
19111.1
19420.7
18985.1


Summary of computational transaction
Raw Inputview raw input (R code)
Raw Outputview raw output of R engine
Computing time2 seconds
R Server'Gwilym Jenkins' @ jenkins.wessa.net

\begin{tabular}{lllllllll}
\hline
Summary of computational transaction \tabularnewline
Raw Input & view raw input (R code)  \tabularnewline
Raw Output & view raw output of R engine  \tabularnewline
Computing time & 2 seconds \tabularnewline
R Server & 'Gwilym Jenkins' @ jenkins.wessa.net \tabularnewline
\hline
\end{tabular}
%Source: https://freestatistics.org/blog/index.php?pk=164085&T=0

[TABLE]
[ROW][C]Summary of computational transaction[/C][/ROW]
[ROW][C]Raw Input[/C][C]view raw input (R code) [/C][/ROW]
[ROW][C]Raw Output[/C][C]view raw output of R engine [/C][/ROW]
[ROW][C]Computing time[/C][C]2 seconds[/C][/ROW]
[ROW][C]R Server[/C][C]'Gwilym Jenkins' @ jenkins.wessa.net[/C][/ROW]
[/TABLE]
Source: https://freestatistics.org/blog/index.php?pk=164085&T=0

Globally Unique Identifier (entire table): ba.freestatistics.org/blog/index.php?pk=164085&T=0

As an alternative you can also use a QR Code:  

The GUIDs for individual cells are displayed in the table below:

Summary of computational transaction
Raw Inputview raw input (R code)
Raw Outputview raw output of R engine
Computing time2 seconds
R Server'Gwilym Jenkins' @ jenkins.wessa.net


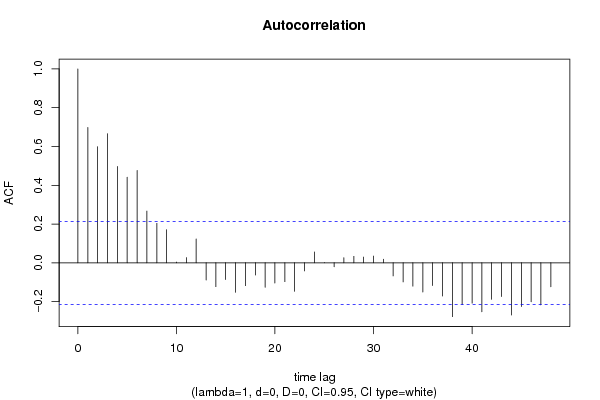
Autocorrelation Function
Time lag kACF(k)T-STATP-value
10.698066.39780
20.598825.48830
30.6659026.10310
40.4970384.55549e-06
50.4411994.04375.8e-05
60.4760074.36271.8e-05
70.2667522.44480.008291
80.2033261.86350.032942
90.1707771.56520.060648
100.0034670.03180.487363
110.026750.24520.403464
120.1225751.12340.132231
13-0.088827-0.81410.208941
14-0.12294-1.12680.131526
15-0.086329-0.79120.215522
16-0.151578-1.38920.084216
17-0.117873-1.08030.141544
18-0.06277-0.57530.283314
19-0.126071-1.15550.125589
20-0.104029-0.95340.17155
21-0.097302-0.89180.187526
22-0.146897-1.34630.090908
23-0.041786-0.3830.351354
240.0557620.51110.305322
25-9.8e-05-9e-040.499641
26-0.020088-0.18410.427186
270.0261280.23950.405662
280.0331810.30410.380897
290.0292370.2680.394693
300.0345050.31620.3763
310.0187920.17220.431836
32-0.067355-0.61730.269346
33-0.098565-0.90340.184459
34-0.120192-1.10160.136896
35-0.151026-1.38420.084986
36-0.117249-1.07460.142815
37-0.171358-1.57050.060026
38-0.277761-2.54570.006366
39-0.21454-1.96630.026284
40-0.208076-1.9070.029966
41-0.252463-2.31390.011559
42-0.188187-1.72480.044124
43-0.173898-1.59380.057369
44-0.26923-2.46750.007817
45-0.225879-2.07020.020752
46-0.20051-1.83770.034821
47-0.216878-1.98770.02505
48-0.123138-1.12860.131144

\begin{tabular}{lllllllll}
\hline
Autocorrelation Function \tabularnewline
Time lag k & ACF(k) & T-STAT & P-value \tabularnewline
1 & 0.69806 & 6.3978 & 0 \tabularnewline
2 & 0.59882 & 5.4883 & 0 \tabularnewline
3 & 0.665902 & 6.1031 & 0 \tabularnewline
4 & 0.497038 & 4.5554 & 9e-06 \tabularnewline
5 & 0.441199 & 4.0437 & 5.8e-05 \tabularnewline
6 & 0.476007 & 4.3627 & 1.8e-05 \tabularnewline
7 & 0.266752 & 2.4448 & 0.008291 \tabularnewline
8 & 0.203326 & 1.8635 & 0.032942 \tabularnewline
9 & 0.170777 & 1.5652 & 0.060648 \tabularnewline
10 & 0.003467 & 0.0318 & 0.487363 \tabularnewline
11 & 0.02675 & 0.2452 & 0.403464 \tabularnewline
12 & 0.122575 & 1.1234 & 0.132231 \tabularnewline
13 & -0.088827 & -0.8141 & 0.208941 \tabularnewline
14 & -0.12294 & -1.1268 & 0.131526 \tabularnewline
15 & -0.086329 & -0.7912 & 0.215522 \tabularnewline
16 & -0.151578 & -1.3892 & 0.084216 \tabularnewline
17 & -0.117873 & -1.0803 & 0.141544 \tabularnewline
18 & -0.06277 & -0.5753 & 0.283314 \tabularnewline
19 & -0.126071 & -1.1555 & 0.125589 \tabularnewline
20 & -0.104029 & -0.9534 & 0.17155 \tabularnewline
21 & -0.097302 & -0.8918 & 0.187526 \tabularnewline
22 & -0.146897 & -1.3463 & 0.090908 \tabularnewline
23 & -0.041786 & -0.383 & 0.351354 \tabularnewline
24 & 0.055762 & 0.5111 & 0.305322 \tabularnewline
25 & -9.8e-05 & -9e-04 & 0.499641 \tabularnewline
26 & -0.020088 & -0.1841 & 0.427186 \tabularnewline
27 & 0.026128 & 0.2395 & 0.405662 \tabularnewline
28 & 0.033181 & 0.3041 & 0.380897 \tabularnewline
29 & 0.029237 & 0.268 & 0.394693 \tabularnewline
30 & 0.034505 & 0.3162 & 0.3763 \tabularnewline
31 & 0.018792 & 0.1722 & 0.431836 \tabularnewline
32 & -0.067355 & -0.6173 & 0.269346 \tabularnewline
33 & -0.098565 & -0.9034 & 0.184459 \tabularnewline
34 & -0.120192 & -1.1016 & 0.136896 \tabularnewline
35 & -0.151026 & -1.3842 & 0.084986 \tabularnewline
36 & -0.117249 & -1.0746 & 0.142815 \tabularnewline
37 & -0.171358 & -1.5705 & 0.060026 \tabularnewline
38 & -0.277761 & -2.5457 & 0.006366 \tabularnewline
39 & -0.21454 & -1.9663 & 0.026284 \tabularnewline
40 & -0.208076 & -1.907 & 0.029966 \tabularnewline
41 & -0.252463 & -2.3139 & 0.011559 \tabularnewline
42 & -0.188187 & -1.7248 & 0.044124 \tabularnewline
43 & -0.173898 & -1.5938 & 0.057369 \tabularnewline
44 & -0.26923 & -2.4675 & 0.007817 \tabularnewline
45 & -0.225879 & -2.0702 & 0.020752 \tabularnewline
46 & -0.20051 & -1.8377 & 0.034821 \tabularnewline
47 & -0.216878 & -1.9877 & 0.02505 \tabularnewline
48 & -0.123138 & -1.1286 & 0.131144 \tabularnewline
\hline
\end{tabular}
%Source: https://freestatistics.org/blog/index.php?pk=164085&T=1

[TABLE]
[ROW][C]Autocorrelation Function[/C][/ROW]
[ROW][C]Time lag k[/C][C]ACF(k)[/C][C]T-STAT[/C][C]P-value[/C][/ROW]
[ROW][C]1[/C][C]0.69806[/C][C]6.3978[/C][C]0[/C][/ROW]
[ROW][C]2[/C][C]0.59882[/C][C]5.4883[/C][C]0[/C][/ROW]
[ROW][C]3[/C][C]0.665902[/C][C]6.1031[/C][C]0[/C][/ROW]
[ROW][C]4[/C][C]0.497038[/C][C]4.5554[/C][C]9e-06[/C][/ROW]
[ROW][C]5[/C][C]0.441199[/C][C]4.0437[/C][C]5.8e-05[/C][/ROW]
[ROW][C]6[/C][C]0.476007[/C][C]4.3627[/C][C]1.8e-05[/C][/ROW]
[ROW][C]7[/C][C]0.266752[/C][C]2.4448[/C][C]0.008291[/C][/ROW]
[ROW][C]8[/C][C]0.203326[/C][C]1.8635[/C][C]0.032942[/C][/ROW]
[ROW][C]9[/C][C]0.170777[/C][C]1.5652[/C][C]0.060648[/C][/ROW]
[ROW][C]10[/C][C]0.003467[/C][C]0.0318[/C][C]0.487363[/C][/ROW]
[ROW][C]11[/C][C]0.02675[/C][C]0.2452[/C][C]0.403464[/C][/ROW]
[ROW][C]12[/C][C]0.122575[/C][C]1.1234[/C][C]0.132231[/C][/ROW]
[ROW][C]13[/C][C]-0.088827[/C][C]-0.8141[/C][C]0.208941[/C][/ROW]
[ROW][C]14[/C][C]-0.12294[/C][C]-1.1268[/C][C]0.131526[/C][/ROW]
[ROW][C]15[/C][C]-0.086329[/C][C]-0.7912[/C][C]0.215522[/C][/ROW]
[ROW][C]16[/C][C]-0.151578[/C][C]-1.3892[/C][C]0.084216[/C][/ROW]
[ROW][C]17[/C][C]-0.117873[/C][C]-1.0803[/C][C]0.141544[/C][/ROW]
[ROW][C]18[/C][C]-0.06277[/C][C]-0.5753[/C][C]0.283314[/C][/ROW]
[ROW][C]19[/C][C]-0.126071[/C][C]-1.1555[/C][C]0.125589[/C][/ROW]
[ROW][C]20[/C][C]-0.104029[/C][C]-0.9534[/C][C]0.17155[/C][/ROW]
[ROW][C]21[/C][C]-0.097302[/C][C]-0.8918[/C][C]0.187526[/C][/ROW]
[ROW][C]22[/C][C]-0.146897[/C][C]-1.3463[/C][C]0.090908[/C][/ROW]
[ROW][C]23[/C][C]-0.041786[/C][C]-0.383[/C][C]0.351354[/C][/ROW]
[ROW][C]24[/C][C]0.055762[/C][C]0.5111[/C][C]0.305322[/C][/ROW]
[ROW][C]25[/C][C]-9.8e-05[/C][C]-9e-04[/C][C]0.499641[/C][/ROW]
[ROW][C]26[/C][C]-0.020088[/C][C]-0.1841[/C][C]0.427186[/C][/ROW]
[ROW][C]27[/C][C]0.026128[/C][C]0.2395[/C][C]0.405662[/C][/ROW]
[ROW][C]28[/C][C]0.033181[/C][C]0.3041[/C][C]0.380897[/C][/ROW]
[ROW][C]29[/C][C]0.029237[/C][C]0.268[/C][C]0.394693[/C][/ROW]
[ROW][C]30[/C][C]0.034505[/C][C]0.3162[/C][C]0.3763[/C][/ROW]
[ROW][C]31[/C][C]0.018792[/C][C]0.1722[/C][C]0.431836[/C][/ROW]
[ROW][C]32[/C][C]-0.067355[/C][C]-0.6173[/C][C]0.269346[/C][/ROW]
[ROW][C]33[/C][C]-0.098565[/C][C]-0.9034[/C][C]0.184459[/C][/ROW]
[ROW][C]34[/C][C]-0.120192[/C][C]-1.1016[/C][C]0.136896[/C][/ROW]
[ROW][C]35[/C][C]-0.151026[/C][C]-1.3842[/C][C]0.084986[/C][/ROW]
[ROW][C]36[/C][C]-0.117249[/C][C]-1.0746[/C][C]0.142815[/C][/ROW]
[ROW][C]37[/C][C]-0.171358[/C][C]-1.5705[/C][C]0.060026[/C][/ROW]
[ROW][C]38[/C][C]-0.277761[/C][C]-2.5457[/C][C]0.006366[/C][/ROW]
[ROW][C]39[/C][C]-0.21454[/C][C]-1.9663[/C][C]0.026284[/C][/ROW]
[ROW][C]40[/C][C]-0.208076[/C][C]-1.907[/C][C]0.029966[/C][/ROW]
[ROW][C]41[/C][C]-0.252463[/C][C]-2.3139[/C][C]0.011559[/C][/ROW]
[ROW][C]42[/C][C]-0.188187[/C][C]-1.7248[/C][C]0.044124[/C][/ROW]
[ROW][C]43[/C][C]-0.173898[/C][C]-1.5938[/C][C]0.057369[/C][/ROW]
[ROW][C]44[/C][C]-0.26923[/C][C]-2.4675[/C][C]0.007817[/C][/ROW]
[ROW][C]45[/C][C]-0.225879[/C][C]-2.0702[/C][C]0.020752[/C][/ROW]
[ROW][C]46[/C][C]-0.20051[/C][C]-1.8377[/C][C]0.034821[/C][/ROW]
[ROW][C]47[/C][C]-0.216878[/C][C]-1.9877[/C][C]0.02505[/C][/ROW]
[ROW][C]48[/C][C]-0.123138[/C][C]-1.1286[/C][C]0.131144[/C][/ROW]
[/TABLE]
Source: https://freestatistics.org/blog/index.php?pk=164085&T=1

Globally Unique Identifier (entire table): ba.freestatistics.org/blog/index.php?pk=164085&T=1

As an alternative you can also use a QR Code:  

The GUIDs for individual cells are displayed in the table below:

Autocorrelation Function
Time lag kACF(k)T-STATP-value
10.698066.39780
20.598825.48830
30.6659026.10310
40.4970384.55549e-06
50.4411994.04375.8e-05
60.4760074.36271.8e-05
70.2667522.44480.008291
80.2033261.86350.032942
90.1707771.56520.060648
100.0034670.03180.487363
110.026750.24520.403464
120.1225751.12340.132231
13-0.088827-0.81410.208941
14-0.12294-1.12680.131526
15-0.086329-0.79120.215522
16-0.151578-1.38920.084216
17-0.117873-1.08030.141544
18-0.06277-0.57530.283314
19-0.126071-1.15550.125589
20-0.104029-0.95340.17155
21-0.097302-0.89180.187526
22-0.146897-1.34630.090908
23-0.041786-0.3830.351354
240.0557620.51110.305322
25-9.8e-05-9e-040.499641
26-0.020088-0.18410.427186
270.0261280.23950.405662
280.0331810.30410.380897
290.0292370.2680.394693
300.0345050.31620.3763
310.0187920.17220.431836
32-0.067355-0.61730.269346
33-0.098565-0.90340.184459
34-0.120192-1.10160.136896
35-0.151026-1.38420.084986
36-0.117249-1.07460.142815
37-0.171358-1.57050.060026
38-0.277761-2.54570.006366
39-0.21454-1.96630.026284
40-0.208076-1.9070.029966
41-0.252463-2.31390.011559
42-0.188187-1.72480.044124
43-0.173898-1.59380.057369
44-0.26923-2.46750.007817
45-0.225879-2.07020.020752
46-0.20051-1.83770.034821
47-0.216878-1.98770.02505
48-0.123138-1.12860.131144


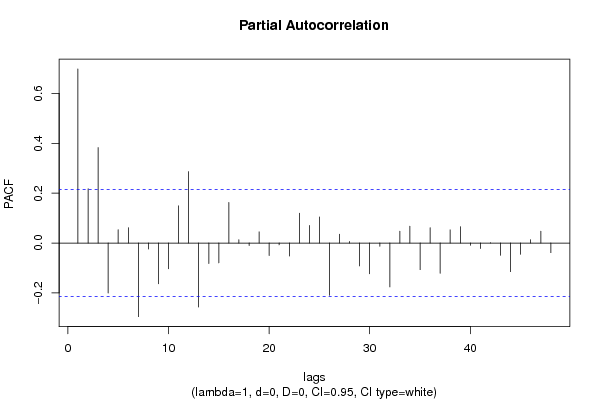
Partial Autocorrelation Function
Time lag kPACF(k)T-STATP-value
10.698066.39780
20.2175341.99370.024713
30.3827813.50820.000364
4-0.200303-1.83580.034962
50.0532580.48810.31337
60.0613030.56180.287857
7-0.29513-2.70490.004135
8-0.02423-0.22210.4124
9-0.163173-1.49550.069265
10-0.103306-0.94680.173224
110.1491641.36710.087619
120.2863352.62430.005156
13-0.256658-2.35230.010498
14-0.082288-0.75420.226426
15-0.079387-0.72760.234443
160.1624821.48920.070094
170.0134380.12320.451138
18-0.009682-0.08870.464752
190.0449660.41210.340649
20-0.049802-0.45640.324623
21-0.007243-0.06640.473614
22-0.051647-0.47340.318596
230.1191731.09220.138926
240.0704680.64590.260068
250.1041860.95490.17119
26-0.209129-1.91670.029338
270.0349730.32050.374681
280.0062780.05750.477126
29-0.091549-0.83910.20191
30-0.123317-1.13020.130801
31-0.013039-0.11950.452581
32-0.175774-1.6110.055466
330.0472990.43350.332882
340.0675770.61940.26868
35-0.106524-0.97630.165857
360.0614990.56360.287249
37-0.120876-1.10790.135544
380.0527660.48360.314961
390.065280.59830.275625
40-0.008724-0.080.468231
41-0.022013-0.20180.420299
420.0012960.01190.495276
43-0.048877-0.4480.327665
44-0.114677-1.0510.14813
45-0.044955-0.4120.340686
460.0133680.12250.451391
470.0470380.43110.333746
48-0.038548-0.35330.362373

\begin{tabular}{lllllllll}
\hline
Partial Autocorrelation Function \tabularnewline
Time lag k & PACF(k) & T-STAT & P-value \tabularnewline
1 & 0.69806 & 6.3978 & 0 \tabularnewline
2 & 0.217534 & 1.9937 & 0.024713 \tabularnewline
3 & 0.382781 & 3.5082 & 0.000364 \tabularnewline
4 & -0.200303 & -1.8358 & 0.034962 \tabularnewline
5 & 0.053258 & 0.4881 & 0.31337 \tabularnewline
6 & 0.061303 & 0.5618 & 0.287857 \tabularnewline
7 & -0.29513 & -2.7049 & 0.004135 \tabularnewline
8 & -0.02423 & -0.2221 & 0.4124 \tabularnewline
9 & -0.163173 & -1.4955 & 0.069265 \tabularnewline
10 & -0.103306 & -0.9468 & 0.173224 \tabularnewline
11 & 0.149164 & 1.3671 & 0.087619 \tabularnewline
12 & 0.286335 & 2.6243 & 0.005156 \tabularnewline
13 & -0.256658 & -2.3523 & 0.010498 \tabularnewline
14 & -0.082288 & -0.7542 & 0.226426 \tabularnewline
15 & -0.079387 & -0.7276 & 0.234443 \tabularnewline
16 & 0.162482 & 1.4892 & 0.070094 \tabularnewline
17 & 0.013438 & 0.1232 & 0.451138 \tabularnewline
18 & -0.009682 & -0.0887 & 0.464752 \tabularnewline
19 & 0.044966 & 0.4121 & 0.340649 \tabularnewline
20 & -0.049802 & -0.4564 & 0.324623 \tabularnewline
21 & -0.007243 & -0.0664 & 0.473614 \tabularnewline
22 & -0.051647 & -0.4734 & 0.318596 \tabularnewline
23 & 0.119173 & 1.0922 & 0.138926 \tabularnewline
24 & 0.070468 & 0.6459 & 0.260068 \tabularnewline
25 & 0.104186 & 0.9549 & 0.17119 \tabularnewline
26 & -0.209129 & -1.9167 & 0.029338 \tabularnewline
27 & 0.034973 & 0.3205 & 0.374681 \tabularnewline
28 & 0.006278 & 0.0575 & 0.477126 \tabularnewline
29 & -0.091549 & -0.8391 & 0.20191 \tabularnewline
30 & -0.123317 & -1.1302 & 0.130801 \tabularnewline
31 & -0.013039 & -0.1195 & 0.452581 \tabularnewline
32 & -0.175774 & -1.611 & 0.055466 \tabularnewline
33 & 0.047299 & 0.4335 & 0.332882 \tabularnewline
34 & 0.067577 & 0.6194 & 0.26868 \tabularnewline
35 & -0.106524 & -0.9763 & 0.165857 \tabularnewline
36 & 0.061499 & 0.5636 & 0.287249 \tabularnewline
37 & -0.120876 & -1.1079 & 0.135544 \tabularnewline
38 & 0.052766 & 0.4836 & 0.314961 \tabularnewline
39 & 0.06528 & 0.5983 & 0.275625 \tabularnewline
40 & -0.008724 & -0.08 & 0.468231 \tabularnewline
41 & -0.022013 & -0.2018 & 0.420299 \tabularnewline
42 & 0.001296 & 0.0119 & 0.495276 \tabularnewline
43 & -0.048877 & -0.448 & 0.327665 \tabularnewline
44 & -0.114677 & -1.051 & 0.14813 \tabularnewline
45 & -0.044955 & -0.412 & 0.340686 \tabularnewline
46 & 0.013368 & 0.1225 & 0.451391 \tabularnewline
47 & 0.047038 & 0.4311 & 0.333746 \tabularnewline
48 & -0.038548 & -0.3533 & 0.362373 \tabularnewline
\hline
\end{tabular}
%Source: https://freestatistics.org/blog/index.php?pk=164085&T=2

[TABLE]
[ROW][C]Partial Autocorrelation Function[/C][/ROW]
[ROW][C]Time lag k[/C][C]PACF(k)[/C][C]T-STAT[/C][C]P-value[/C][/ROW]
[ROW][C]1[/C][C]0.69806[/C][C]6.3978[/C][C]0[/C][/ROW]
[ROW][C]2[/C][C]0.217534[/C][C]1.9937[/C][C]0.024713[/C][/ROW]
[ROW][C]3[/C][C]0.382781[/C][C]3.5082[/C][C]0.000364[/C][/ROW]
[ROW][C]4[/C][C]-0.200303[/C][C]-1.8358[/C][C]0.034962[/C][/ROW]
[ROW][C]5[/C][C]0.053258[/C][C]0.4881[/C][C]0.31337[/C][/ROW]
[ROW][C]6[/C][C]0.061303[/C][C]0.5618[/C][C]0.287857[/C][/ROW]
[ROW][C]7[/C][C]-0.29513[/C][C]-2.7049[/C][C]0.004135[/C][/ROW]
[ROW][C]8[/C][C]-0.02423[/C][C]-0.2221[/C][C]0.4124[/C][/ROW]
[ROW][C]9[/C][C]-0.163173[/C][C]-1.4955[/C][C]0.069265[/C][/ROW]
[ROW][C]10[/C][C]-0.103306[/C][C]-0.9468[/C][C]0.173224[/C][/ROW]
[ROW][C]11[/C][C]0.149164[/C][C]1.3671[/C][C]0.087619[/C][/ROW]
[ROW][C]12[/C][C]0.286335[/C][C]2.6243[/C][C]0.005156[/C][/ROW]
[ROW][C]13[/C][C]-0.256658[/C][C]-2.3523[/C][C]0.010498[/C][/ROW]
[ROW][C]14[/C][C]-0.082288[/C][C]-0.7542[/C][C]0.226426[/C][/ROW]
[ROW][C]15[/C][C]-0.079387[/C][C]-0.7276[/C][C]0.234443[/C][/ROW]
[ROW][C]16[/C][C]0.162482[/C][C]1.4892[/C][C]0.070094[/C][/ROW]
[ROW][C]17[/C][C]0.013438[/C][C]0.1232[/C][C]0.451138[/C][/ROW]
[ROW][C]18[/C][C]-0.009682[/C][C]-0.0887[/C][C]0.464752[/C][/ROW]
[ROW][C]19[/C][C]0.044966[/C][C]0.4121[/C][C]0.340649[/C][/ROW]
[ROW][C]20[/C][C]-0.049802[/C][C]-0.4564[/C][C]0.324623[/C][/ROW]
[ROW][C]21[/C][C]-0.007243[/C][C]-0.0664[/C][C]0.473614[/C][/ROW]
[ROW][C]22[/C][C]-0.051647[/C][C]-0.4734[/C][C]0.318596[/C][/ROW]
[ROW][C]23[/C][C]0.119173[/C][C]1.0922[/C][C]0.138926[/C][/ROW]
[ROW][C]24[/C][C]0.070468[/C][C]0.6459[/C][C]0.260068[/C][/ROW]
[ROW][C]25[/C][C]0.104186[/C][C]0.9549[/C][C]0.17119[/C][/ROW]
[ROW][C]26[/C][C]-0.209129[/C][C]-1.9167[/C][C]0.029338[/C][/ROW]
[ROW][C]27[/C][C]0.034973[/C][C]0.3205[/C][C]0.374681[/C][/ROW]
[ROW][C]28[/C][C]0.006278[/C][C]0.0575[/C][C]0.477126[/C][/ROW]
[ROW][C]29[/C][C]-0.091549[/C][C]-0.8391[/C][C]0.20191[/C][/ROW]
[ROW][C]30[/C][C]-0.123317[/C][C]-1.1302[/C][C]0.130801[/C][/ROW]
[ROW][C]31[/C][C]-0.013039[/C][C]-0.1195[/C][C]0.452581[/C][/ROW]
[ROW][C]32[/C][C]-0.175774[/C][C]-1.611[/C][C]0.055466[/C][/ROW]
[ROW][C]33[/C][C]0.047299[/C][C]0.4335[/C][C]0.332882[/C][/ROW]
[ROW][C]34[/C][C]0.067577[/C][C]0.6194[/C][C]0.26868[/C][/ROW]
[ROW][C]35[/C][C]-0.106524[/C][C]-0.9763[/C][C]0.165857[/C][/ROW]
[ROW][C]36[/C][C]0.061499[/C][C]0.5636[/C][C]0.287249[/C][/ROW]
[ROW][C]37[/C][C]-0.120876[/C][C]-1.1079[/C][C]0.135544[/C][/ROW]
[ROW][C]38[/C][C]0.052766[/C][C]0.4836[/C][C]0.314961[/C][/ROW]
[ROW][C]39[/C][C]0.06528[/C][C]0.5983[/C][C]0.275625[/C][/ROW]
[ROW][C]40[/C][C]-0.008724[/C][C]-0.08[/C][C]0.468231[/C][/ROW]
[ROW][C]41[/C][C]-0.022013[/C][C]-0.2018[/C][C]0.420299[/C][/ROW]
[ROW][C]42[/C][C]0.001296[/C][C]0.0119[/C][C]0.495276[/C][/ROW]
[ROW][C]43[/C][C]-0.048877[/C][C]-0.448[/C][C]0.327665[/C][/ROW]
[ROW][C]44[/C][C]-0.114677[/C][C]-1.051[/C][C]0.14813[/C][/ROW]
[ROW][C]45[/C][C]-0.044955[/C][C]-0.412[/C][C]0.340686[/C][/ROW]
[ROW][C]46[/C][C]0.013368[/C][C]0.1225[/C][C]0.451391[/C][/ROW]
[ROW][C]47[/C][C]0.047038[/C][C]0.4311[/C][C]0.333746[/C][/ROW]
[ROW][C]48[/C][C]-0.038548[/C][C]-0.3533[/C][C]0.362373[/C][/ROW]
[/TABLE]
Source: https://freestatistics.org/blog/index.php?pk=164085&T=2

Globally Unique Identifier (entire table): ba.freestatistics.org/blog/index.php?pk=164085&T=2

As an alternative you can also use a QR Code:  

The GUIDs for individual cells are displayed in the table below:

Partial Autocorrelation Function
Time lag kPACF(k)T-STATP-value
10.698066.39780
20.2175341.99370.024713
30.3827813.50820.000364
4-0.200303-1.83580.034962
50.0532580.48810.31337
60.0613030.56180.287857
7-0.29513-2.70490.004135
8-0.02423-0.22210.4124
9-0.163173-1.49550.069265
10-0.103306-0.94680.173224
110.1491641.36710.087619
120.2863352.62430.005156
13-0.256658-2.35230.010498
14-0.082288-0.75420.226426
15-0.079387-0.72760.234443
160.1624821.48920.070094
170.0134380.12320.451138
18-0.009682-0.08870.464752
190.0449660.41210.340649
20-0.049802-0.45640.324623
21-0.007243-0.06640.473614
22-0.051647-0.47340.318596
230.1191731.09220.138926
240.0704680.64590.260068
250.1041860.95490.17119
26-0.209129-1.91670.029338
270.0349730.32050.374681
280.0062780.05750.477126
29-0.091549-0.83910.20191
30-0.123317-1.13020.130801
31-0.013039-0.11950.452581
32-0.175774-1.6110.055466
330.0472990.43350.332882
340.0675770.61940.26868
35-0.106524-0.97630.165857
360.0614990.56360.287249
37-0.120876-1.10790.135544
380.0527660.48360.314961
390.065280.59830.275625
40-0.008724-0.080.468231
41-0.022013-0.20180.420299
420.0012960.01190.495276
43-0.048877-0.4480.327665
44-0.114677-1.0510.14813
45-0.044955-0.4120.340686
460.0133680.12250.451391
470.0470380.43110.333746
48-0.038548-0.35330.362373


Parameters (Session):
par1 = 48 ; par2 = 1 ; par3 = 0 ; par4 = 0 ; par5 = 12 ; par6 = White Noise ; par7 = 0.95 ;
Parameters (R input):
par1 = 48 ; par2 = 1 ; par3 = 0 ; par4 = 0 ; par5 = 12 ; par6 = White Noise ; par7 = 0.95 ; par8 = ;
R code (references can be found in the software module):
if (par1 == 'Default') {
par1 = 10*log10(length(x))
} else {
par1 <- as.numeric(par1)
}
par2 <- as.numeric(par2)
par3 <- as.numeric(par3)
par4 <- as.numeric(par4)
par5 <- as.numeric(par5)
if (par6 == 'White Noise') par6 <- 'white' else par6 <- 'ma'
par7 <- as.numeric(par7)
if (par8 != '') par8 <- as.numeric(par8)
ox <- x
if (par8 == '') {
if (par2 == 0) {
x <- log(x)
} else {
x <- (x ^ par2 - 1) / par2
}
} else {
x <- log(x,base=par8)
}
if (par3 > 0) x <- diff(x,lag=1,difference=par3)
if (par4 > 0) x <- diff(x,lag=par5,difference=par4)
bitmap(file='picts.png')
op <- par(mfrow=c(2,1))
plot(ox,type='l',main='Original Time Series',xlab='time',ylab='value')
if (par8=='') {
mytitle <- paste('Working Time Series (lambda=',par2,', d=',par3,', D=',par4,')',sep='')
mysub <- paste('(lambda=',par2,', d=',par3,', D=',par4,', CI=', par7, ', CI type=',par6,')',sep='')
} else {
mytitle <- paste('Working Time Series (base=',par8,', d=',par3,', D=',par4,')',sep='')
mysub <- paste('(base=',par8,', d=',par3,', D=',par4,', CI=', par7, ', CI type=',par6,')',sep='')
}
plot(x,type='l', main=mytitle,xlab='time',ylab='value')
par(op)
dev.off()
bitmap(file='pic1.png')
racf <- acf(x, par1, main='Autocorrelation', xlab='time lag', ylab='ACF', ci.type=par6, ci=par7, sub=mysub)
dev.off()
bitmap(file='pic2.png')
rpacf <- pacf(x,par1,main='Partial Autocorrelation',xlab='lags',ylab='PACF',sub=mysub)
dev.off()
(myacf <- c(racf$acf))
(mypacf <- c(rpacf$acf))
lengthx <- length(x)
sqrtn <- sqrt(lengthx)
load(file='createtable')
a<-table.start()
a<-table.row.start(a)
a<-table.element(a,'Autocorrelation Function',4,TRUE)
a<-table.row.end(a)
a<-table.row.start(a)
a<-table.element(a,'Time lag k',header=TRUE)
a<-table.element(a,hyperlink('basics.htm','ACF(k)','click here for more information about the Autocorrelation Function'),header=TRUE)
a<-table.element(a,'T-STAT',header=TRUE)
a<-table.element(a,'P-value',header=TRUE)
a<-table.row.end(a)
for (i in 2:(par1+1)) {
a<-table.row.start(a)
a<-table.element(a,i-1,header=TRUE)
a<-table.element(a,round(myacf[i],6))
mytstat <- myacf[i]*sqrtn
a<-table.element(a,round(mytstat,4))
a<-table.element(a,round(1-pt(abs(mytstat),lengthx),6))
a<-table.row.end(a)
}
a<-table.end(a)
table.save(a,file='mytable.tab')
a<-table.start()
a<-table.row.start(a)
a<-table.element(a,'Partial Autocorrelation Function',4,TRUE)
a<-table.row.end(a)
a<-table.row.start(a)
a<-table.element(a,'Time lag k',header=TRUE)
a<-table.element(a,hyperlink('basics.htm','PACF(k)','click here for more information about the Partial Autocorrelation Function'),header=TRUE)
a<-table.element(a,'T-STAT',header=TRUE)
a<-table.element(a,'P-value',header=TRUE)
a<-table.row.end(a)
for (i in 1:par1) {
a<-table.row.start(a)
a<-table.element(a,i,header=TRUE)
a<-table.element(a,round(mypacf[i],6))
mytstat <- mypacf[i]*sqrtn
a<-table.element(a,round(mytstat,4))
a<-table.element(a,round(1-pt(abs(mytstat),lengthx),6))
a<-table.row.end(a)
}
a<-table.end(a)
table.save(a,file='mytable1.tab')