Free Statistics

of Irreproducible Research!

Author's title

Author*Unverified author*
R Software Modulerwasp_autocorrelation.wasp
Title produced by software(Partial) Autocorrelation Function
Date of computationSat, 31 Mar 2012 07:09:34 -0400
Cite this page as followsStatistical Computations at FreeStatistics.org, Office for Research Development and Education, URL https://freestatistics.org/blog/index.php?v=date/2012/Mar/31/t1333192288dn5dx3x59cvrw98.htm/, Retrieved Tue, 30 Apr 2024 16:46:19 +0000
Statistical Computations at FreeStatistics.org, Office for Research Development and Education, URL https://freestatistics.org/blog/index.php?pk=164207, Retrieved Tue, 30 Apr 2024 16:46:19 +0000
QR Codes:

Original text written by user:
IsPrivate?No (this computation is public)
User-defined keywords
Estimated Impact117
Family? (F = Feedback message, R = changed R code, M = changed R Module, P = changed Parameters, D = changed Data)
-       [(Partial) Autocorrelation Function] [] [2012-03-31 11:09:34] [1f4a81ae6fe0e483feb8688127b64584] [Current]
Feedback Forum

Post a new message
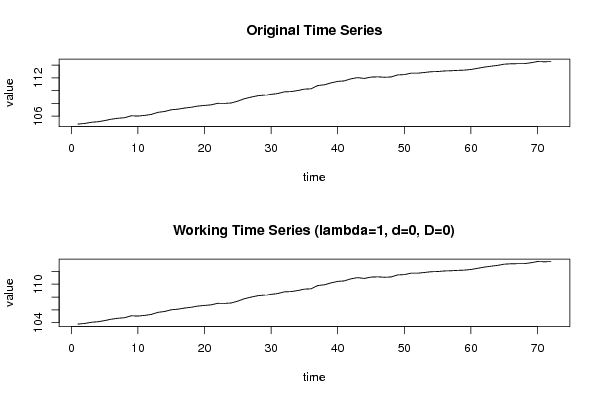
Dataseries X:
104,78
104,87
105,06
105,14
105,32
105,54
105,68
105,77
106,07
106,03
106,13
106,28
106,61
106,74
107,01
107,1
107,28
107,4
107,59
107,69
107,78
108,02
108
108,07
108,36
108,74
108,99
109,21
109,31
109,41
109,54
109,81
109,85
110,01
110,23
110,28
110,79
110,91
111,21
111,44
111,52
111,85
112,03
111,9
112,11
112,15
112,09
112,13
112,45
112,5
112,72
112,72
112,83
112,95
112,98
113,07
113,1
113,16
113,2
113,3
113,48
113,67
113,81
113,94
114,13
114,19
114,21
114,21
114,35
114,54
114,51
114,53


Summary of computational transaction
Raw Inputview raw input (R code)
Raw Outputview raw output of R engine
Computing time1 seconds
R Server'Gertrude Mary Cox' @ cox.wessa.net

\begin{tabular}{lllllllll}
\hline
Summary of computational transaction \tabularnewline
Raw Input & view raw input (R code)  \tabularnewline
Raw Output & view raw output of R engine  \tabularnewline
Computing time & 1 seconds \tabularnewline
R Server & 'Gertrude Mary Cox' @ cox.wessa.net \tabularnewline
\hline
\end{tabular}
%Source: https://freestatistics.org/blog/index.php?pk=164207&T=0

[TABLE]
[ROW][C]Summary of computational transaction[/C][/ROW]
[ROW][C]Raw Input[/C][C]view raw input (R code) [/C][/ROW]
[ROW][C]Raw Output[/C][C]view raw output of R engine [/C][/ROW]
[ROW][C]Computing time[/C][C]1 seconds[/C][/ROW]
[ROW][C]R Server[/C][C]'Gertrude Mary Cox' @ cox.wessa.net[/C][/ROW]
[/TABLE]
Source: https://freestatistics.org/blog/index.php?pk=164207&T=0

Globally Unique Identifier (entire table): ba.freestatistics.org/blog/index.php?pk=164207&T=0

As an alternative you can also use a QR Code:  

The GUIDs for individual cells are displayed in the table below:

Summary of computational transaction
Raw Inputview raw input (R code)
Raw Outputview raw output of R engine
Computing time1 seconds
R Server'Gertrude Mary Cox' @ cox.wessa.net


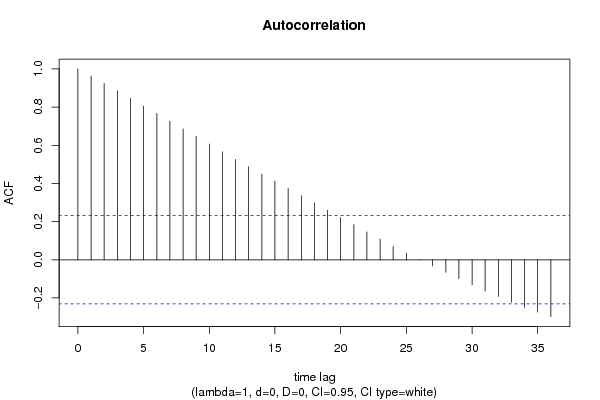
Autocorrelation Function
Time lag kACF(k)T-STATP-value
10.9624788.16690
20.923867.83920
30.8844627.50490
40.8448017.16840
50.8055986.83570
60.7662736.5020
70.7261816.16190
80.6854415.81620
90.6464455.48530
100.6061125.1431e-06
110.5656254.79954e-06
120.5255994.45991.5e-05
130.4874214.13594.7e-05
140.449063.81040.000145
150.4113623.49050.000414
160.3731963.16670.001131
170.3351152.84350.002901
180.296962.51980.006981
190.2591992.19940.015532
200.2214531.87910.03214
210.1835741.55770.061847
220.146141.240.109494
230.1084830.92050.18019
240.0700210.59410.277138
250.0343010.29110.385923
260.0005070.00430.498291
27-0.03299-0.27990.390166
28-0.065749-0.55790.289321
29-0.097717-0.82920.204879
30-0.130856-1.11030.135272
31-0.163017-1.38320.085432
32-0.191919-1.62850.053895
33-0.221065-1.87580.032368
34-0.248518-2.10870.019223
35-0.273379-2.31970.011598
36-0.297954-2.52820.006829

\begin{tabular}{lllllllll}
\hline
Autocorrelation Function \tabularnewline
Time lag k & ACF(k) & T-STAT & P-value \tabularnewline
1 & 0.962478 & 8.1669 & 0 \tabularnewline
2 & 0.92386 & 7.8392 & 0 \tabularnewline
3 & 0.884462 & 7.5049 & 0 \tabularnewline
4 & 0.844801 & 7.1684 & 0 \tabularnewline
5 & 0.805598 & 6.8357 & 0 \tabularnewline
6 & 0.766273 & 6.502 & 0 \tabularnewline
7 & 0.726181 & 6.1619 & 0 \tabularnewline
8 & 0.685441 & 5.8162 & 0 \tabularnewline
9 & 0.646445 & 5.4853 & 0 \tabularnewline
10 & 0.606112 & 5.143 & 1e-06 \tabularnewline
11 & 0.565625 & 4.7995 & 4e-06 \tabularnewline
12 & 0.525599 & 4.4599 & 1.5e-05 \tabularnewline
13 & 0.487421 & 4.1359 & 4.7e-05 \tabularnewline
14 & 0.44906 & 3.8104 & 0.000145 \tabularnewline
15 & 0.411362 & 3.4905 & 0.000414 \tabularnewline
16 & 0.373196 & 3.1667 & 0.001131 \tabularnewline
17 & 0.335115 & 2.8435 & 0.002901 \tabularnewline
18 & 0.29696 & 2.5198 & 0.006981 \tabularnewline
19 & 0.259199 & 2.1994 & 0.015532 \tabularnewline
20 & 0.221453 & 1.8791 & 0.03214 \tabularnewline
21 & 0.183574 & 1.5577 & 0.061847 \tabularnewline
22 & 0.14614 & 1.24 & 0.109494 \tabularnewline
23 & 0.108483 & 0.9205 & 0.18019 \tabularnewline
24 & 0.070021 & 0.5941 & 0.277138 \tabularnewline
25 & 0.034301 & 0.2911 & 0.385923 \tabularnewline
26 & 0.000507 & 0.0043 & 0.498291 \tabularnewline
27 & -0.03299 & -0.2799 & 0.390166 \tabularnewline
28 & -0.065749 & -0.5579 & 0.289321 \tabularnewline
29 & -0.097717 & -0.8292 & 0.204879 \tabularnewline
30 & -0.130856 & -1.1103 & 0.135272 \tabularnewline
31 & -0.163017 & -1.3832 & 0.085432 \tabularnewline
32 & -0.191919 & -1.6285 & 0.053895 \tabularnewline
33 & -0.221065 & -1.8758 & 0.032368 \tabularnewline
34 & -0.248518 & -2.1087 & 0.019223 \tabularnewline
35 & -0.273379 & -2.3197 & 0.011598 \tabularnewline
36 & -0.297954 & -2.5282 & 0.006829 \tabularnewline
\hline
\end{tabular}
%Source: https://freestatistics.org/blog/index.php?pk=164207&T=1

[TABLE]
[ROW][C]Autocorrelation Function[/C][/ROW]
[ROW][C]Time lag k[/C][C]ACF(k)[/C][C]T-STAT[/C][C]P-value[/C][/ROW]
[ROW][C]1[/C][C]0.962478[/C][C]8.1669[/C][C]0[/C][/ROW]
[ROW][C]2[/C][C]0.92386[/C][C]7.8392[/C][C]0[/C][/ROW]
[ROW][C]3[/C][C]0.884462[/C][C]7.5049[/C][C]0[/C][/ROW]
[ROW][C]4[/C][C]0.844801[/C][C]7.1684[/C][C]0[/C][/ROW]
[ROW][C]5[/C][C]0.805598[/C][C]6.8357[/C][C]0[/C][/ROW]
[ROW][C]6[/C][C]0.766273[/C][C]6.502[/C][C]0[/C][/ROW]
[ROW][C]7[/C][C]0.726181[/C][C]6.1619[/C][C]0[/C][/ROW]
[ROW][C]8[/C][C]0.685441[/C][C]5.8162[/C][C]0[/C][/ROW]
[ROW][C]9[/C][C]0.646445[/C][C]5.4853[/C][C]0[/C][/ROW]
[ROW][C]10[/C][C]0.606112[/C][C]5.143[/C][C]1e-06[/C][/ROW]
[ROW][C]11[/C][C]0.565625[/C][C]4.7995[/C][C]4e-06[/C][/ROW]
[ROW][C]12[/C][C]0.525599[/C][C]4.4599[/C][C]1.5e-05[/C][/ROW]
[ROW][C]13[/C][C]0.487421[/C][C]4.1359[/C][C]4.7e-05[/C][/ROW]
[ROW][C]14[/C][C]0.44906[/C][C]3.8104[/C][C]0.000145[/C][/ROW]
[ROW][C]15[/C][C]0.411362[/C][C]3.4905[/C][C]0.000414[/C][/ROW]
[ROW][C]16[/C][C]0.373196[/C][C]3.1667[/C][C]0.001131[/C][/ROW]
[ROW][C]17[/C][C]0.335115[/C][C]2.8435[/C][C]0.002901[/C][/ROW]
[ROW][C]18[/C][C]0.29696[/C][C]2.5198[/C][C]0.006981[/C][/ROW]
[ROW][C]19[/C][C]0.259199[/C][C]2.1994[/C][C]0.015532[/C][/ROW]
[ROW][C]20[/C][C]0.221453[/C][C]1.8791[/C][C]0.03214[/C][/ROW]
[ROW][C]21[/C][C]0.183574[/C][C]1.5577[/C][C]0.061847[/C][/ROW]
[ROW][C]22[/C][C]0.14614[/C][C]1.24[/C][C]0.109494[/C][/ROW]
[ROW][C]23[/C][C]0.108483[/C][C]0.9205[/C][C]0.18019[/C][/ROW]
[ROW][C]24[/C][C]0.070021[/C][C]0.5941[/C][C]0.277138[/C][/ROW]
[ROW][C]25[/C][C]0.034301[/C][C]0.2911[/C][C]0.385923[/C][/ROW]
[ROW][C]26[/C][C]0.000507[/C][C]0.0043[/C][C]0.498291[/C][/ROW]
[ROW][C]27[/C][C]-0.03299[/C][C]-0.2799[/C][C]0.390166[/C][/ROW]
[ROW][C]28[/C][C]-0.065749[/C][C]-0.5579[/C][C]0.289321[/C][/ROW]
[ROW][C]29[/C][C]-0.097717[/C][C]-0.8292[/C][C]0.204879[/C][/ROW]
[ROW][C]30[/C][C]-0.130856[/C][C]-1.1103[/C][C]0.135272[/C][/ROW]
[ROW][C]31[/C][C]-0.163017[/C][C]-1.3832[/C][C]0.085432[/C][/ROW]
[ROW][C]32[/C][C]-0.191919[/C][C]-1.6285[/C][C]0.053895[/C][/ROW]
[ROW][C]33[/C][C]-0.221065[/C][C]-1.8758[/C][C]0.032368[/C][/ROW]
[ROW][C]34[/C][C]-0.248518[/C][C]-2.1087[/C][C]0.019223[/C][/ROW]
[ROW][C]35[/C][C]-0.273379[/C][C]-2.3197[/C][C]0.011598[/C][/ROW]
[ROW][C]36[/C][C]-0.297954[/C][C]-2.5282[/C][C]0.006829[/C][/ROW]
[/TABLE]
Source: https://freestatistics.org/blog/index.php?pk=164207&T=1

Globally Unique Identifier (entire table): ba.freestatistics.org/blog/index.php?pk=164207&T=1

As an alternative you can also use a QR Code:  

The GUIDs for individual cells are displayed in the table below:

Autocorrelation Function
Time lag kACF(k)T-STATP-value
10.9624788.16690
20.923867.83920
30.8844627.50490
40.8448017.16840
50.8055986.83570
60.7662736.5020
70.7261816.16190
80.6854415.81620
90.6464455.48530
100.6061125.1431e-06
110.5656254.79954e-06
120.5255994.45991.5e-05
130.4874214.13594.7e-05
140.449063.81040.000145
150.4113623.49050.000414
160.3731963.16670.001131
170.3351152.84350.002901
180.296962.51980.006981
190.2591992.19940.015532
200.2214531.87910.03214
210.1835741.55770.061847
220.146141.240.109494
230.1084830.92050.18019
240.0700210.59410.277138
250.0343010.29110.385923
260.0005070.00430.498291
27-0.03299-0.27990.390166
28-0.065749-0.55790.289321
29-0.097717-0.82920.204879
30-0.130856-1.11030.135272
31-0.163017-1.38320.085432
32-0.191919-1.62850.053895
33-0.221065-1.87580.032368
34-0.248518-2.10870.019223
35-0.273379-2.31970.011598
36-0.297954-2.52820.006829


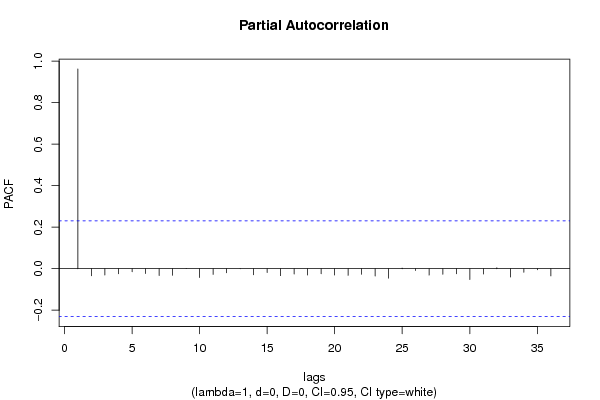
Partial Autocorrelation Function
Time lag kPACF(k)T-STATP-value
10.9624788.16690
2-0.033992-0.28840.386922
3-0.030487-0.25870.398307
4-0.02419-0.20530.418974
5-0.015059-0.12780.449339
6-0.023493-0.19930.421276
7-0.032766-0.2780.390894
8-0.031813-0.26990.393989
90.0001150.0010.499613
10-0.042349-0.35930.360196
11-0.027288-0.23150.408775
12-0.019373-0.16440.434945
13-0.00051-0.00430.498279
14-0.029118-0.24710.402776
15-0.018248-0.15480.438689
16-0.033449-0.28380.388679
17-0.025379-0.21530.415053
18-0.030597-0.25960.397947
19-0.024258-0.20580.418751
20-0.030088-0.25530.399607
21-0.031975-0.27130.393463
22-0.027037-0.22940.409597
23-0.035345-0.29990.382553
24-0.045514-0.38620.350243
250.0030470.02590.489723
26-0.009022-0.07660.469597
27-0.030802-0.26140.397279
28-0.026514-0.2250.411316
29-0.024582-0.20860.41768
30-0.052304-0.44380.329253
31-0.025626-0.21740.414239
320.0043150.03660.485446
33-0.04036-0.34250.366497
34-0.016985-0.14410.442902
35-0.005026-0.04270.483049
36-0.034482-0.29260.38534

\begin{tabular}{lllllllll}
\hline
Partial Autocorrelation Function \tabularnewline
Time lag k & PACF(k) & T-STAT & P-value \tabularnewline
1 & 0.962478 & 8.1669 & 0 \tabularnewline
2 & -0.033992 & -0.2884 & 0.386922 \tabularnewline
3 & -0.030487 & -0.2587 & 0.398307 \tabularnewline
4 & -0.02419 & -0.2053 & 0.418974 \tabularnewline
5 & -0.015059 & -0.1278 & 0.449339 \tabularnewline
6 & -0.023493 & -0.1993 & 0.421276 \tabularnewline
7 & -0.032766 & -0.278 & 0.390894 \tabularnewline
8 & -0.031813 & -0.2699 & 0.393989 \tabularnewline
9 & 0.000115 & 0.001 & 0.499613 \tabularnewline
10 & -0.042349 & -0.3593 & 0.360196 \tabularnewline
11 & -0.027288 & -0.2315 & 0.408775 \tabularnewline
12 & -0.019373 & -0.1644 & 0.434945 \tabularnewline
13 & -0.00051 & -0.0043 & 0.498279 \tabularnewline
14 & -0.029118 & -0.2471 & 0.402776 \tabularnewline
15 & -0.018248 & -0.1548 & 0.438689 \tabularnewline
16 & -0.033449 & -0.2838 & 0.388679 \tabularnewline
17 & -0.025379 & -0.2153 & 0.415053 \tabularnewline
18 & -0.030597 & -0.2596 & 0.397947 \tabularnewline
19 & -0.024258 & -0.2058 & 0.418751 \tabularnewline
20 & -0.030088 & -0.2553 & 0.399607 \tabularnewline
21 & -0.031975 & -0.2713 & 0.393463 \tabularnewline
22 & -0.027037 & -0.2294 & 0.409597 \tabularnewline
23 & -0.035345 & -0.2999 & 0.382553 \tabularnewline
24 & -0.045514 & -0.3862 & 0.350243 \tabularnewline
25 & 0.003047 & 0.0259 & 0.489723 \tabularnewline
26 & -0.009022 & -0.0766 & 0.469597 \tabularnewline
27 & -0.030802 & -0.2614 & 0.397279 \tabularnewline
28 & -0.026514 & -0.225 & 0.411316 \tabularnewline
29 & -0.024582 & -0.2086 & 0.41768 \tabularnewline
30 & -0.052304 & -0.4438 & 0.329253 \tabularnewline
31 & -0.025626 & -0.2174 & 0.414239 \tabularnewline
32 & 0.004315 & 0.0366 & 0.485446 \tabularnewline
33 & -0.04036 & -0.3425 & 0.366497 \tabularnewline
34 & -0.016985 & -0.1441 & 0.442902 \tabularnewline
35 & -0.005026 & -0.0427 & 0.483049 \tabularnewline
36 & -0.034482 & -0.2926 & 0.38534 \tabularnewline
\hline
\end{tabular}
%Source: https://freestatistics.org/blog/index.php?pk=164207&T=2

[TABLE]
[ROW][C]Partial Autocorrelation Function[/C][/ROW]
[ROW][C]Time lag k[/C][C]PACF(k)[/C][C]T-STAT[/C][C]P-value[/C][/ROW]
[ROW][C]1[/C][C]0.962478[/C][C]8.1669[/C][C]0[/C][/ROW]
[ROW][C]2[/C][C]-0.033992[/C][C]-0.2884[/C][C]0.386922[/C][/ROW]
[ROW][C]3[/C][C]-0.030487[/C][C]-0.2587[/C][C]0.398307[/C][/ROW]
[ROW][C]4[/C][C]-0.02419[/C][C]-0.2053[/C][C]0.418974[/C][/ROW]
[ROW][C]5[/C][C]-0.015059[/C][C]-0.1278[/C][C]0.449339[/C][/ROW]
[ROW][C]6[/C][C]-0.023493[/C][C]-0.1993[/C][C]0.421276[/C][/ROW]
[ROW][C]7[/C][C]-0.032766[/C][C]-0.278[/C][C]0.390894[/C][/ROW]
[ROW][C]8[/C][C]-0.031813[/C][C]-0.2699[/C][C]0.393989[/C][/ROW]
[ROW][C]9[/C][C]0.000115[/C][C]0.001[/C][C]0.499613[/C][/ROW]
[ROW][C]10[/C][C]-0.042349[/C][C]-0.3593[/C][C]0.360196[/C][/ROW]
[ROW][C]11[/C][C]-0.027288[/C][C]-0.2315[/C][C]0.408775[/C][/ROW]
[ROW][C]12[/C][C]-0.019373[/C][C]-0.1644[/C][C]0.434945[/C][/ROW]
[ROW][C]13[/C][C]-0.00051[/C][C]-0.0043[/C][C]0.498279[/C][/ROW]
[ROW][C]14[/C][C]-0.029118[/C][C]-0.2471[/C][C]0.402776[/C][/ROW]
[ROW][C]15[/C][C]-0.018248[/C][C]-0.1548[/C][C]0.438689[/C][/ROW]
[ROW][C]16[/C][C]-0.033449[/C][C]-0.2838[/C][C]0.388679[/C][/ROW]
[ROW][C]17[/C][C]-0.025379[/C][C]-0.2153[/C][C]0.415053[/C][/ROW]
[ROW][C]18[/C][C]-0.030597[/C][C]-0.2596[/C][C]0.397947[/C][/ROW]
[ROW][C]19[/C][C]-0.024258[/C][C]-0.2058[/C][C]0.418751[/C][/ROW]
[ROW][C]20[/C][C]-0.030088[/C][C]-0.2553[/C][C]0.399607[/C][/ROW]
[ROW][C]21[/C][C]-0.031975[/C][C]-0.2713[/C][C]0.393463[/C][/ROW]
[ROW][C]22[/C][C]-0.027037[/C][C]-0.2294[/C][C]0.409597[/C][/ROW]
[ROW][C]23[/C][C]-0.035345[/C][C]-0.2999[/C][C]0.382553[/C][/ROW]
[ROW][C]24[/C][C]-0.045514[/C][C]-0.3862[/C][C]0.350243[/C][/ROW]
[ROW][C]25[/C][C]0.003047[/C][C]0.0259[/C][C]0.489723[/C][/ROW]
[ROW][C]26[/C][C]-0.009022[/C][C]-0.0766[/C][C]0.469597[/C][/ROW]
[ROW][C]27[/C][C]-0.030802[/C][C]-0.2614[/C][C]0.397279[/C][/ROW]
[ROW][C]28[/C][C]-0.026514[/C][C]-0.225[/C][C]0.411316[/C][/ROW]
[ROW][C]29[/C][C]-0.024582[/C][C]-0.2086[/C][C]0.41768[/C][/ROW]
[ROW][C]30[/C][C]-0.052304[/C][C]-0.4438[/C][C]0.329253[/C][/ROW]
[ROW][C]31[/C][C]-0.025626[/C][C]-0.2174[/C][C]0.414239[/C][/ROW]
[ROW][C]32[/C][C]0.004315[/C][C]0.0366[/C][C]0.485446[/C][/ROW]
[ROW][C]33[/C][C]-0.04036[/C][C]-0.3425[/C][C]0.366497[/C][/ROW]
[ROW][C]34[/C][C]-0.016985[/C][C]-0.1441[/C][C]0.442902[/C][/ROW]
[ROW][C]35[/C][C]-0.005026[/C][C]-0.0427[/C][C]0.483049[/C][/ROW]
[ROW][C]36[/C][C]-0.034482[/C][C]-0.2926[/C][C]0.38534[/C][/ROW]
[/TABLE]
Source: https://freestatistics.org/blog/index.php?pk=164207&T=2

Globally Unique Identifier (entire table): ba.freestatistics.org/blog/index.php?pk=164207&T=2

As an alternative you can also use a QR Code:  

The GUIDs for individual cells are displayed in the table below:

Partial Autocorrelation Function
Time lag kPACF(k)T-STATP-value
10.9624788.16690
2-0.033992-0.28840.386922
3-0.030487-0.25870.398307
4-0.02419-0.20530.418974
5-0.015059-0.12780.449339
6-0.023493-0.19930.421276
7-0.032766-0.2780.390894
8-0.031813-0.26990.393989
90.0001150.0010.499613
10-0.042349-0.35930.360196
11-0.027288-0.23150.408775
12-0.019373-0.16440.434945
13-0.00051-0.00430.498279
14-0.029118-0.24710.402776
15-0.018248-0.15480.438689
16-0.033449-0.28380.388679
17-0.025379-0.21530.415053
18-0.030597-0.25960.397947
19-0.024258-0.20580.418751
20-0.030088-0.25530.399607
21-0.031975-0.27130.393463
22-0.027037-0.22940.409597
23-0.035345-0.29990.382553
24-0.045514-0.38620.350243
250.0030470.02590.489723
26-0.009022-0.07660.469597
27-0.030802-0.26140.397279
28-0.026514-0.2250.411316
29-0.024582-0.20860.41768
30-0.052304-0.44380.329253
31-0.025626-0.21740.414239
320.0043150.03660.485446
33-0.04036-0.34250.366497
34-0.016985-0.14410.442902
35-0.005026-0.04270.483049
36-0.034482-0.29260.38534


Parameters (Session):
par1 = 36 ; par2 = 1 ; par3 = 0 ; par4 = 0 ; par5 = 12 ; par6 = White Noise ; par7 = 0.95 ;
Parameters (R input):
par1 = 36 ; par2 = 1 ; par3 = 0 ; par4 = 0 ; par5 = 12 ; par6 = White Noise ; par7 = 0.95 ; par8 = ;
R code (references can be found in the software module):
if (par1 == 'Default') {
par1 = 10*log10(length(x))
} else {
par1 <- as.numeric(par1)
}
par2 <- as.numeric(par2)
par3 <- as.numeric(par3)
par4 <- as.numeric(par4)
par5 <- as.numeric(par5)
if (par6 == 'White Noise') par6 <- 'white' else par6 <- 'ma'
par7 <- as.numeric(par7)
if (par8 != '') par8 <- as.numeric(par8)
ox <- x
if (par8 == '') {
if (par2 == 0) {
x <- log(x)
} else {
x <- (x ^ par2 - 1) / par2
}
} else {
x <- log(x,base=par8)
}
if (par3 > 0) x <- diff(x,lag=1,difference=par3)
if (par4 > 0) x <- diff(x,lag=par5,difference=par4)
bitmap(file='picts.png')
op <- par(mfrow=c(2,1))
plot(ox,type='l',main='Original Time Series',xlab='time',ylab='value')
if (par8=='') {
mytitle <- paste('Working Time Series (lambda=',par2,', d=',par3,', D=',par4,')',sep='')
mysub <- paste('(lambda=',par2,', d=',par3,', D=',par4,', CI=', par7, ', CI type=',par6,')',sep='')
} else {
mytitle <- paste('Working Time Series (base=',par8,', d=',par3,', D=',par4,')',sep='')
mysub <- paste('(base=',par8,', d=',par3,', D=',par4,', CI=', par7, ', CI type=',par6,')',sep='')
}
plot(x,type='l', main=mytitle,xlab='time',ylab='value')
par(op)
dev.off()
bitmap(file='pic1.png')
racf <- acf(x, par1, main='Autocorrelation', xlab='time lag', ylab='ACF', ci.type=par6, ci=par7, sub=mysub)
dev.off()
bitmap(file='pic2.png')
rpacf <- pacf(x,par1,main='Partial Autocorrelation',xlab='lags',ylab='PACF',sub=mysub)
dev.off()
(myacf <- c(racf$acf))
(mypacf <- c(rpacf$acf))
lengthx <- length(x)
sqrtn <- sqrt(lengthx)
load(file='createtable')
a<-table.start()
a<-table.row.start(a)
a<-table.element(a,'Autocorrelation Function',4,TRUE)
a<-table.row.end(a)
a<-table.row.start(a)
a<-table.element(a,'Time lag k',header=TRUE)
a<-table.element(a,hyperlink('basics.htm','ACF(k)','click here for more information about the Autocorrelation Function'),header=TRUE)
a<-table.element(a,'T-STAT',header=TRUE)
a<-table.element(a,'P-value',header=TRUE)
a<-table.row.end(a)
for (i in 2:(par1+1)) {
a<-table.row.start(a)
a<-table.element(a,i-1,header=TRUE)
a<-table.element(a,round(myacf[i],6))
mytstat <- myacf[i]*sqrtn
a<-table.element(a,round(mytstat,4))
a<-table.element(a,round(1-pt(abs(mytstat),lengthx),6))
a<-table.row.end(a)
}
a<-table.end(a)
table.save(a,file='mytable.tab')
a<-table.start()
a<-table.row.start(a)
a<-table.element(a,'Partial Autocorrelation Function',4,TRUE)
a<-table.row.end(a)
a<-table.row.start(a)
a<-table.element(a,'Time lag k',header=TRUE)
a<-table.element(a,hyperlink('basics.htm','PACF(k)','click here for more information about the Partial Autocorrelation Function'),header=TRUE)
a<-table.element(a,'T-STAT',header=TRUE)
a<-table.element(a,'P-value',header=TRUE)
a<-table.row.end(a)
for (i in 1:par1) {
a<-table.row.start(a)
a<-table.element(a,i,header=TRUE)
a<-table.element(a,round(mypacf[i],6))
mytstat <- mypacf[i]*sqrtn
a<-table.element(a,round(mytstat,4))
a<-table.element(a,round(1-pt(abs(mytstat),lengthx),6))
a<-table.row.end(a)
}
a<-table.end(a)
table.save(a,file='mytable1.tab')