Free Statistics

of Irreproducible Research!

Author's title

Author*Unverified author*
R Software Modulerwasp_autocorrelation.wasp
Title produced by software(Partial) Autocorrelation Function
Date of computationSat, 31 Mar 2012 07:13:56 -0400
Cite this page as followsStatistical Computations at FreeStatistics.org, Office for Research Development and Education, URL https://freestatistics.org/blog/index.php?v=date/2012/Mar/31/t1333192510dgekh7l9rfqpjed.htm/, Retrieved Tue, 30 Apr 2024 08:32:44 +0000
Statistical Computations at FreeStatistics.org, Office for Research Development and Education, URL https://freestatistics.org/blog/index.php?pk=164208, Retrieved Tue, 30 Apr 2024 08:32:44 +0000
QR Codes:

Original text written by user:
IsPrivate?No (this computation is public)
User-defined keywords
Estimated Impact132
Family? (F = Feedback message, R = changed R code, M = changed R Module, P = changed Parameters, D = changed Data)
-       [(Partial) Autocorrelation Function] [] [2012-03-31 11:13:56] [1f4a81ae6fe0e483feb8688127b64584] [Current]
Feedback Forum

Post a new message
Dataseries X:
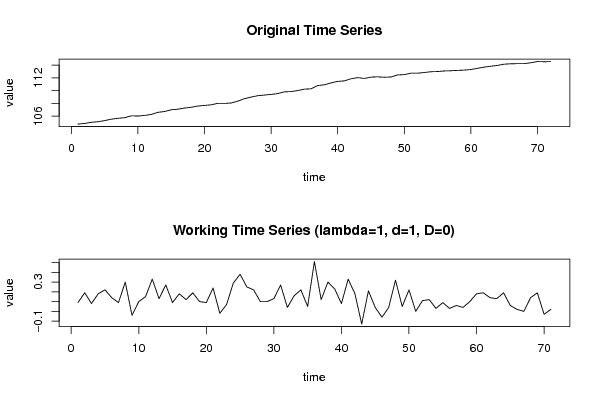
104.78
104.87
105.06
105.14
105.32
105.54
105.68
105.77
106.07
106.03
106.13
106.28
106.61
106.74
107.01
107.1
107.28
107.4
107.59
107.69
107.78
108.02
108
108.07
108.36
108.74
108.99
109.21
109.31
109.41
109.54
109.81
109.85
110.01
110.23
110.28
110.79
110.91
111.21
111.44
111.52
111.85
112.03
111.9
112.11
112.15
112.09
112.13
112.45
112.5
112.72
112.72
112.83
112.95
112.98
113.07
113.1
113.16
113.2
113.3
113.48
113.67
113.81
113.94
114.13
114.19
114.21
114.21
114.35
114.54
114.51
114.53


Summary of computational transaction
Raw Inputview raw input (R code)
Raw Outputview raw output of R engine
Computing time2 seconds
R Server'AstonUniversity' @ aston.wessa.net

\begin{tabular}{lllllllll}
\hline
Summary of computational transaction \tabularnewline
Raw Input & view raw input (R code)  \tabularnewline
Raw Output & view raw output of R engine  \tabularnewline
Computing time & 2 seconds \tabularnewline
R Server & 'AstonUniversity' @ aston.wessa.net \tabularnewline
\hline
\end{tabular}
%Source: https://freestatistics.org/blog/index.php?pk=164208&T=0

[TABLE]
[ROW][C]Summary of computational transaction[/C][/ROW]
[ROW][C]Raw Input[/C][C]view raw input (R code) [/C][/ROW]
[ROW][C]Raw Output[/C][C]view raw output of R engine [/C][/ROW]
[ROW][C]Computing time[/C][C]2 seconds[/C][/ROW]
[ROW][C]R Server[/C][C]'AstonUniversity' @ aston.wessa.net[/C][/ROW]
[/TABLE]
Source: https://freestatistics.org/blog/index.php?pk=164208&T=0

Globally Unique Identifier (entire table): ba.freestatistics.org/blog/index.php?pk=164208&T=0

As an alternative you can also use a QR Code:  

The GUIDs for individual cells are displayed in the table below:

Summary of computational transaction
Raw Inputview raw input (R code)
Raw Outputview raw output of R engine
Computing time2 seconds
R Server'AstonUniversity' @ aston.wessa.net


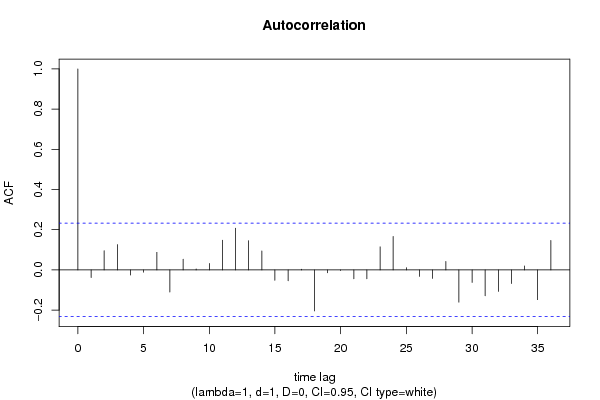
Autocorrelation Function
Time lag kACF(k)T-STATP-value
1-0.038042-0.32060.374746
20.0957310.80660.211282
30.1259061.06090.146166
4-0.025098-0.21150.416559
5-0.011208-0.09440.462512
60.0875390.73760.231589
7-0.109991-0.92680.178585
80.0533870.44980.327095
90.0048730.04110.483681
100.0319640.26930.394226
110.1475091.24290.108991
120.2077881.75080.042146
130.1451331.22290.112703
140.0941380.79320.215146
15-0.051703-0.43570.332205
16-0.054332-0.45780.324243
170.0032290.02720.489185
18-0.204148-1.72020.044878
19-0.014446-0.12170.451729
20-0.00265-0.02230.491125
21-0.044251-0.37290.35518
22-0.044583-0.37570.354144
230.1148170.96750.168299
240.1668571.4060.082048
250.0107890.09090.463909
26-0.032361-0.27270.392947
27-0.04217-0.35530.361698
280.0416130.35060.363449
29-0.160472-1.35220.090308
30-0.062293-0.52490.300648
31-0.12913-1.08810.140121
32-0.107116-0.90260.184902
33-0.06767-0.57020.285171
340.019670.16570.434417
35-0.147996-1.2470.108242
360.1461721.23170.111068

\begin{tabular}{lllllllll}
\hline
Autocorrelation Function \tabularnewline
Time lag k & ACF(k) & T-STAT & P-value \tabularnewline
1 & -0.038042 & -0.3206 & 0.374746 \tabularnewline
2 & 0.095731 & 0.8066 & 0.211282 \tabularnewline
3 & 0.125906 & 1.0609 & 0.146166 \tabularnewline
4 & -0.025098 & -0.2115 & 0.416559 \tabularnewline
5 & -0.011208 & -0.0944 & 0.462512 \tabularnewline
6 & 0.087539 & 0.7376 & 0.231589 \tabularnewline
7 & -0.109991 & -0.9268 & 0.178585 \tabularnewline
8 & 0.053387 & 0.4498 & 0.327095 \tabularnewline
9 & 0.004873 & 0.0411 & 0.483681 \tabularnewline
10 & 0.031964 & 0.2693 & 0.394226 \tabularnewline
11 & 0.147509 & 1.2429 & 0.108991 \tabularnewline
12 & 0.207788 & 1.7508 & 0.042146 \tabularnewline
13 & 0.145133 & 1.2229 & 0.112703 \tabularnewline
14 & 0.094138 & 0.7932 & 0.215146 \tabularnewline
15 & -0.051703 & -0.4357 & 0.332205 \tabularnewline
16 & -0.054332 & -0.4578 & 0.324243 \tabularnewline
17 & 0.003229 & 0.0272 & 0.489185 \tabularnewline
18 & -0.204148 & -1.7202 & 0.044878 \tabularnewline
19 & -0.014446 & -0.1217 & 0.451729 \tabularnewline
20 & -0.00265 & -0.0223 & 0.491125 \tabularnewline
21 & -0.044251 & -0.3729 & 0.35518 \tabularnewline
22 & -0.044583 & -0.3757 & 0.354144 \tabularnewline
23 & 0.114817 & 0.9675 & 0.168299 \tabularnewline
24 & 0.166857 & 1.406 & 0.082048 \tabularnewline
25 & 0.010789 & 0.0909 & 0.463909 \tabularnewline
26 & -0.032361 & -0.2727 & 0.392947 \tabularnewline
27 & -0.04217 & -0.3553 & 0.361698 \tabularnewline
28 & 0.041613 & 0.3506 & 0.363449 \tabularnewline
29 & -0.160472 & -1.3522 & 0.090308 \tabularnewline
30 & -0.062293 & -0.5249 & 0.300648 \tabularnewline
31 & -0.12913 & -1.0881 & 0.140121 \tabularnewline
32 & -0.107116 & -0.9026 & 0.184902 \tabularnewline
33 & -0.06767 & -0.5702 & 0.285171 \tabularnewline
34 & 0.01967 & 0.1657 & 0.434417 \tabularnewline
35 & -0.147996 & -1.247 & 0.108242 \tabularnewline
36 & 0.146172 & 1.2317 & 0.111068 \tabularnewline
\hline
\end{tabular}
%Source: https://freestatistics.org/blog/index.php?pk=164208&T=1

[TABLE]
[ROW][C]Autocorrelation Function[/C][/ROW]
[ROW][C]Time lag k[/C][C]ACF(k)[/C][C]T-STAT[/C][C]P-value[/C][/ROW]
[ROW][C]1[/C][C]-0.038042[/C][C]-0.3206[/C][C]0.374746[/C][/ROW]
[ROW][C]2[/C][C]0.095731[/C][C]0.8066[/C][C]0.211282[/C][/ROW]
[ROW][C]3[/C][C]0.125906[/C][C]1.0609[/C][C]0.146166[/C][/ROW]
[ROW][C]4[/C][C]-0.025098[/C][C]-0.2115[/C][C]0.416559[/C][/ROW]
[ROW][C]5[/C][C]-0.011208[/C][C]-0.0944[/C][C]0.462512[/C][/ROW]
[ROW][C]6[/C][C]0.087539[/C][C]0.7376[/C][C]0.231589[/C][/ROW]
[ROW][C]7[/C][C]-0.109991[/C][C]-0.9268[/C][C]0.178585[/C][/ROW]
[ROW][C]8[/C][C]0.053387[/C][C]0.4498[/C][C]0.327095[/C][/ROW]
[ROW][C]9[/C][C]0.004873[/C][C]0.0411[/C][C]0.483681[/C][/ROW]
[ROW][C]10[/C][C]0.031964[/C][C]0.2693[/C][C]0.394226[/C][/ROW]
[ROW][C]11[/C][C]0.147509[/C][C]1.2429[/C][C]0.108991[/C][/ROW]
[ROW][C]12[/C][C]0.207788[/C][C]1.7508[/C][C]0.042146[/C][/ROW]
[ROW][C]13[/C][C]0.145133[/C][C]1.2229[/C][C]0.112703[/C][/ROW]
[ROW][C]14[/C][C]0.094138[/C][C]0.7932[/C][C]0.215146[/C][/ROW]
[ROW][C]15[/C][C]-0.051703[/C][C]-0.4357[/C][C]0.332205[/C][/ROW]
[ROW][C]16[/C][C]-0.054332[/C][C]-0.4578[/C][C]0.324243[/C][/ROW]
[ROW][C]17[/C][C]0.003229[/C][C]0.0272[/C][C]0.489185[/C][/ROW]
[ROW][C]18[/C][C]-0.204148[/C][C]-1.7202[/C][C]0.044878[/C][/ROW]
[ROW][C]19[/C][C]-0.014446[/C][C]-0.1217[/C][C]0.451729[/C][/ROW]
[ROW][C]20[/C][C]-0.00265[/C][C]-0.0223[/C][C]0.491125[/C][/ROW]
[ROW][C]21[/C][C]-0.044251[/C][C]-0.3729[/C][C]0.35518[/C][/ROW]
[ROW][C]22[/C][C]-0.044583[/C][C]-0.3757[/C][C]0.354144[/C][/ROW]
[ROW][C]23[/C][C]0.114817[/C][C]0.9675[/C][C]0.168299[/C][/ROW]
[ROW][C]24[/C][C]0.166857[/C][C]1.406[/C][C]0.082048[/C][/ROW]
[ROW][C]25[/C][C]0.010789[/C][C]0.0909[/C][C]0.463909[/C][/ROW]
[ROW][C]26[/C][C]-0.032361[/C][C]-0.2727[/C][C]0.392947[/C][/ROW]
[ROW][C]27[/C][C]-0.04217[/C][C]-0.3553[/C][C]0.361698[/C][/ROW]
[ROW][C]28[/C][C]0.041613[/C][C]0.3506[/C][C]0.363449[/C][/ROW]
[ROW][C]29[/C][C]-0.160472[/C][C]-1.3522[/C][C]0.090308[/C][/ROW]
[ROW][C]30[/C][C]-0.062293[/C][C]-0.5249[/C][C]0.300648[/C][/ROW]
[ROW][C]31[/C][C]-0.12913[/C][C]-1.0881[/C][C]0.140121[/C][/ROW]
[ROW][C]32[/C][C]-0.107116[/C][C]-0.9026[/C][C]0.184902[/C][/ROW]
[ROW][C]33[/C][C]-0.06767[/C][C]-0.5702[/C][C]0.285171[/C][/ROW]
[ROW][C]34[/C][C]0.01967[/C][C]0.1657[/C][C]0.434417[/C][/ROW]
[ROW][C]35[/C][C]-0.147996[/C][C]-1.247[/C][C]0.108242[/C][/ROW]
[ROW][C]36[/C][C]0.146172[/C][C]1.2317[/C][C]0.111068[/C][/ROW]
[/TABLE]
Source: https://freestatistics.org/blog/index.php?pk=164208&T=1

Globally Unique Identifier (entire table): ba.freestatistics.org/blog/index.php?pk=164208&T=1

As an alternative you can also use a QR Code:  

The GUIDs for individual cells are displayed in the table below:

Autocorrelation Function
Time lag kACF(k)T-STATP-value
1-0.038042-0.32060.374746
20.0957310.80660.211282
30.1259061.06090.146166
4-0.025098-0.21150.416559
5-0.011208-0.09440.462512
60.0875390.73760.231589
7-0.109991-0.92680.178585
80.0533870.44980.327095
90.0048730.04110.483681
100.0319640.26930.394226
110.1475091.24290.108991
120.2077881.75080.042146
130.1451331.22290.112703
140.0941380.79320.215146
15-0.051703-0.43570.332205
16-0.054332-0.45780.324243
170.0032290.02720.489185
18-0.204148-1.72020.044878
19-0.014446-0.12170.451729
20-0.00265-0.02230.491125
21-0.044251-0.37290.35518
22-0.044583-0.37570.354144
230.1148170.96750.168299
240.1668571.4060.082048
250.0107890.09090.463909
26-0.032361-0.27270.392947
27-0.04217-0.35530.361698
280.0416130.35060.363449
29-0.160472-1.35220.090308
30-0.062293-0.52490.300648
31-0.12913-1.08810.140121
32-0.107116-0.90260.184902
33-0.06767-0.57020.285171
340.019670.16570.434417
35-0.147996-1.2470.108242
360.1461721.23170.111068


Partial Autocorrelation Function
Time lag kPACF(k)T-STATP-value
1-0.038042-0.32060.374746
20.0944210.79560.214457
30.1341841.13070.131002
4-0.024225-0.20410.419422
5-0.039886-0.33610.368899
60.0757170.6380.262761
7-0.094663-0.79760.213868
80.0356040.30.382526
90.0080450.06780.473072
100.0546430.46040.323308
110.1434951.20910.115316
120.2140231.80340.037785
130.1643641.3850.085201
140.0352770.29720.383573
15-0.117648-0.99130.162448
16-0.132598-1.11730.133819
17-0.02848-0.240.405519
18-0.207567-1.7490.042307
19-0.030173-0.25420.400023
200.0428560.36110.359543
210.0392380.33060.370952
22-0.079143-0.66690.253509
230.0385640.32490.37309
240.175461.47850.071855
25-0.081597-0.68750.246988
26-0.142863-1.20380.116335
27-0.080331-0.67690.25034
280.1635281.37790.086279
29-0.077357-0.65180.258309
30-0.012953-0.10910.456698
31-0.0391-0.32950.371388
32-0.065004-0.54770.292798
33-0.119757-1.00910.158178
34-0.018-0.15170.439937
35-0.15508-1.30670.097762
36-0.013236-0.11150.455757

\begin{tabular}{lllllllll}
\hline
Partial Autocorrelation Function \tabularnewline
Time lag k & PACF(k) & T-STAT & P-value \tabularnewline
1 & -0.038042 & -0.3206 & 0.374746 \tabularnewline
2 & 0.094421 & 0.7956 & 0.214457 \tabularnewline
3 & 0.134184 & 1.1307 & 0.131002 \tabularnewline
4 & -0.024225 & -0.2041 & 0.419422 \tabularnewline
5 & -0.039886 & -0.3361 & 0.368899 \tabularnewline
6 & 0.075717 & 0.638 & 0.262761 \tabularnewline
7 & -0.094663 & -0.7976 & 0.213868 \tabularnewline
8 & 0.035604 & 0.3 & 0.382526 \tabularnewline
9 & 0.008045 & 0.0678 & 0.473072 \tabularnewline
10 & 0.054643 & 0.4604 & 0.323308 \tabularnewline
11 & 0.143495 & 1.2091 & 0.115316 \tabularnewline
12 & 0.214023 & 1.8034 & 0.037785 \tabularnewline
13 & 0.164364 & 1.385 & 0.085201 \tabularnewline
14 & 0.035277 & 0.2972 & 0.383573 \tabularnewline
15 & -0.117648 & -0.9913 & 0.162448 \tabularnewline
16 & -0.132598 & -1.1173 & 0.133819 \tabularnewline
17 & -0.02848 & -0.24 & 0.405519 \tabularnewline
18 & -0.207567 & -1.749 & 0.042307 \tabularnewline
19 & -0.030173 & -0.2542 & 0.400023 \tabularnewline
20 & 0.042856 & 0.3611 & 0.359543 \tabularnewline
21 & 0.039238 & 0.3306 & 0.370952 \tabularnewline
22 & -0.079143 & -0.6669 & 0.253509 \tabularnewline
23 & 0.038564 & 0.3249 & 0.37309 \tabularnewline
24 & 0.17546 & 1.4785 & 0.071855 \tabularnewline
25 & -0.081597 & -0.6875 & 0.246988 \tabularnewline
26 & -0.142863 & -1.2038 & 0.116335 \tabularnewline
27 & -0.080331 & -0.6769 & 0.25034 \tabularnewline
28 & 0.163528 & 1.3779 & 0.086279 \tabularnewline
29 & -0.077357 & -0.6518 & 0.258309 \tabularnewline
30 & -0.012953 & -0.1091 & 0.456698 \tabularnewline
31 & -0.0391 & -0.3295 & 0.371388 \tabularnewline
32 & -0.065004 & -0.5477 & 0.292798 \tabularnewline
33 & -0.119757 & -1.0091 & 0.158178 \tabularnewline
34 & -0.018 & -0.1517 & 0.439937 \tabularnewline
35 & -0.15508 & -1.3067 & 0.097762 \tabularnewline
36 & -0.013236 & -0.1115 & 0.455757 \tabularnewline
\hline
\end{tabular}
%Source: https://freestatistics.org/blog/index.php?pk=164208&T=2

[TABLE]
[ROW][C]Partial Autocorrelation Function[/C][/ROW]
[ROW][C]Time lag k[/C][C]PACF(k)[/C][C]T-STAT[/C][C]P-value[/C][/ROW]
[ROW][C]1[/C][C]-0.038042[/C][C]-0.3206[/C][C]0.374746[/C][/ROW]
[ROW][C]2[/C][C]0.094421[/C][C]0.7956[/C][C]0.214457[/C][/ROW]
[ROW][C]3[/C][C]0.134184[/C][C]1.1307[/C][C]0.131002[/C][/ROW]
[ROW][C]4[/C][C]-0.024225[/C][C]-0.2041[/C][C]0.419422[/C][/ROW]
[ROW][C]5[/C][C]-0.039886[/C][C]-0.3361[/C][C]0.368899[/C][/ROW]
[ROW][C]6[/C][C]0.075717[/C][C]0.638[/C][C]0.262761[/C][/ROW]
[ROW][C]7[/C][C]-0.094663[/C][C]-0.7976[/C][C]0.213868[/C][/ROW]
[ROW][C]8[/C][C]0.035604[/C][C]0.3[/C][C]0.382526[/C][/ROW]
[ROW][C]9[/C][C]0.008045[/C][C]0.0678[/C][C]0.473072[/C][/ROW]
[ROW][C]10[/C][C]0.054643[/C][C]0.4604[/C][C]0.323308[/C][/ROW]
[ROW][C]11[/C][C]0.143495[/C][C]1.2091[/C][C]0.115316[/C][/ROW]
[ROW][C]12[/C][C]0.214023[/C][C]1.8034[/C][C]0.037785[/C][/ROW]
[ROW][C]13[/C][C]0.164364[/C][C]1.385[/C][C]0.085201[/C][/ROW]
[ROW][C]14[/C][C]0.035277[/C][C]0.2972[/C][C]0.383573[/C][/ROW]
[ROW][C]15[/C][C]-0.117648[/C][C]-0.9913[/C][C]0.162448[/C][/ROW]
[ROW][C]16[/C][C]-0.132598[/C][C]-1.1173[/C][C]0.133819[/C][/ROW]
[ROW][C]17[/C][C]-0.02848[/C][C]-0.24[/C][C]0.405519[/C][/ROW]
[ROW][C]18[/C][C]-0.207567[/C][C]-1.749[/C][C]0.042307[/C][/ROW]
[ROW][C]19[/C][C]-0.030173[/C][C]-0.2542[/C][C]0.400023[/C][/ROW]
[ROW][C]20[/C][C]0.042856[/C][C]0.3611[/C][C]0.359543[/C][/ROW]
[ROW][C]21[/C][C]0.039238[/C][C]0.3306[/C][C]0.370952[/C][/ROW]
[ROW][C]22[/C][C]-0.079143[/C][C]-0.6669[/C][C]0.253509[/C][/ROW]
[ROW][C]23[/C][C]0.038564[/C][C]0.3249[/C][C]0.37309[/C][/ROW]
[ROW][C]24[/C][C]0.17546[/C][C]1.4785[/C][C]0.071855[/C][/ROW]
[ROW][C]25[/C][C]-0.081597[/C][C]-0.6875[/C][C]0.246988[/C][/ROW]
[ROW][C]26[/C][C]-0.142863[/C][C]-1.2038[/C][C]0.116335[/C][/ROW]
[ROW][C]27[/C][C]-0.080331[/C][C]-0.6769[/C][C]0.25034[/C][/ROW]
[ROW][C]28[/C][C]0.163528[/C][C]1.3779[/C][C]0.086279[/C][/ROW]
[ROW][C]29[/C][C]-0.077357[/C][C]-0.6518[/C][C]0.258309[/C][/ROW]
[ROW][C]30[/C][C]-0.012953[/C][C]-0.1091[/C][C]0.456698[/C][/ROW]
[ROW][C]31[/C][C]-0.0391[/C][C]-0.3295[/C][C]0.371388[/C][/ROW]
[ROW][C]32[/C][C]-0.065004[/C][C]-0.5477[/C][C]0.292798[/C][/ROW]
[ROW][C]33[/C][C]-0.119757[/C][C]-1.0091[/C][C]0.158178[/C][/ROW]
[ROW][C]34[/C][C]-0.018[/C][C]-0.1517[/C][C]0.439937[/C][/ROW]
[ROW][C]35[/C][C]-0.15508[/C][C]-1.3067[/C][C]0.097762[/C][/ROW]
[ROW][C]36[/C][C]-0.013236[/C][C]-0.1115[/C][C]0.455757[/C][/ROW]
[/TABLE]
Source: https://freestatistics.org/blog/index.php?pk=164208&T=2

Globally Unique Identifier (entire table): ba.freestatistics.org/blog/index.php?pk=164208&T=2

As an alternative you can also use a QR Code:  

The GUIDs for individual cells are displayed in the table below:

Partial Autocorrelation Function
Time lag kPACF(k)T-STATP-value
1-0.038042-0.32060.374746
20.0944210.79560.214457
30.1341841.13070.131002
4-0.024225-0.20410.419422
5-0.039886-0.33610.368899
60.0757170.6380.262761
7-0.094663-0.79760.213868
80.0356040.30.382526
90.0080450.06780.473072
100.0546430.46040.323308
110.1434951.20910.115316
120.2140231.80340.037785
130.1643641.3850.085201
140.0352770.29720.383573
15-0.117648-0.99130.162448
16-0.132598-1.11730.133819
17-0.02848-0.240.405519
18-0.207567-1.7490.042307
19-0.030173-0.25420.400023
200.0428560.36110.359543
210.0392380.33060.370952
22-0.079143-0.66690.253509
230.0385640.32490.37309
240.175461.47850.071855
25-0.081597-0.68750.246988
26-0.142863-1.20380.116335
27-0.080331-0.67690.25034
280.1635281.37790.086279
29-0.077357-0.65180.258309
30-0.012953-0.10910.456698
31-0.0391-0.32950.371388
32-0.065004-0.54770.292798
33-0.119757-1.00910.158178
34-0.018-0.15170.439937
35-0.15508-1.30670.097762
36-0.013236-0.11150.455757


Parameters (Session):
par1 = 36 ; par2 = 1 ; par3 = 1 ; par4 = 0 ; par5 = 12 ; par6 = White Noise ; par7 = 0.95 ;
Parameters (R input):
par1 = 36 ; par2 = 1 ; par3 = 1 ; par4 = 0 ; par5 = 12 ; par6 = White Noise ; par7 = 0.95 ; par8 = ;
R code (references can be found in the software module):
if (par1 == 'Default') {
par1 = 10*log10(length(x))
} else {
par1 <- as.numeric(par1)
}
par2 <- as.numeric(par2)
par3 <- as.numeric(par3)
par4 <- as.numeric(par4)
par5 <- as.numeric(par5)
if (par6 == 'White Noise') par6 <- 'white' else par6 <- 'ma'
par7 <- as.numeric(par7)
if (par8 != '') par8 <- as.numeric(par8)
ox <- x
if (par8 == '') {
if (par2 == 0) {
x <- log(x)
} else {
x <- (x ^ par2 - 1) / par2
}
} else {
x <- log(x,base=par8)
}
if (par3 > 0) x <- diff(x,lag=1,difference=par3)
if (par4 > 0) x <- diff(x,lag=par5,difference=par4)
bitmap(file='picts.png')
op <- par(mfrow=c(2,1))
plot(ox,type='l',main='Original Time Series',xlab='time',ylab='value')
if (par8=='') {
mytitle <- paste('Working Time Series (lambda=',par2,', d=',par3,', D=',par4,')',sep='')
mysub <- paste('(lambda=',par2,', d=',par3,', D=',par4,', CI=', par7, ', CI type=',par6,')',sep='')
} else {
mytitle <- paste('Working Time Series (base=',par8,', d=',par3,', D=',par4,')',sep='')
mysub <- paste('(base=',par8,', d=',par3,', D=',par4,', CI=', par7, ', CI type=',par6,')',sep='')
}
plot(x,type='l', main=mytitle,xlab='time',ylab='value')
par(op)
dev.off()
bitmap(file='pic1.png')
racf <- acf(x, par1, main='Autocorrelation', xlab='time lag', ylab='ACF', ci.type=par6, ci=par7, sub=mysub)
dev.off()
bitmap(file='pic2.png')
rpacf <- pacf(x,par1,main='Partial Autocorrelation',xlab='lags',ylab='PACF',sub=mysub)
dev.off()
(myacf <- c(racf$acf))
(mypacf <- c(rpacf$acf))
lengthx <- length(x)
sqrtn <- sqrt(lengthx)
load(file='createtable')
a<-table.start()
a<-table.row.start(a)
a<-table.element(a,'Autocorrelation Function',4,TRUE)
a<-table.row.end(a)
a<-table.row.start(a)
a<-table.element(a,'Time lag k',header=TRUE)
a<-table.element(a,hyperlink('basics.htm','ACF(k)','click here for more information about the Autocorrelation Function'),header=TRUE)
a<-table.element(a,'T-STAT',header=TRUE)
a<-table.element(a,'P-value',header=TRUE)
a<-table.row.end(a)
for (i in 2:(par1+1)) {
a<-table.row.start(a)
a<-table.element(a,i-1,header=TRUE)
a<-table.element(a,round(myacf[i],6))
mytstat <- myacf[i]*sqrtn
a<-table.element(a,round(mytstat,4))
a<-table.element(a,round(1-pt(abs(mytstat),lengthx),6))
a<-table.row.end(a)
}
a<-table.end(a)
table.save(a,file='mytable.tab')
a<-table.start()
a<-table.row.start(a)
a<-table.element(a,'Partial Autocorrelation Function',4,TRUE)
a<-table.row.end(a)
a<-table.row.start(a)
a<-table.element(a,'Time lag k',header=TRUE)
a<-table.element(a,hyperlink('basics.htm','PACF(k)','click here for more information about the Partial Autocorrelation Function'),header=TRUE)
a<-table.element(a,'T-STAT',header=TRUE)
a<-table.element(a,'P-value',header=TRUE)
a<-table.row.end(a)
for (i in 1:par1) {
a<-table.row.start(a)
a<-table.element(a,i,header=TRUE)
a<-table.element(a,round(mypacf[i],6))
mytstat <- mypacf[i]*sqrtn
a<-table.element(a,round(mytstat,4))
a<-table.element(a,round(1-pt(abs(mytstat),lengthx),6))
a<-table.row.end(a)
}
a<-table.end(a)
table.save(a,file='mytable1.tab')