Free Statistics

of Irreproducible Research!

Author's title

Author*Unverified author*
R Software Modulerwasp_autocorrelation.wasp
Title produced by software(Partial) Autocorrelation Function
Date of computationSat, 31 Mar 2012 09:11:34 -0400
Cite this page as followsStatistical Computations at FreeStatistics.org, Office for Research Development and Education, URL https://freestatistics.org/blog/index.php?v=date/2012/Mar/31/t13331995641iv0pvd1g1odxc1.htm/, Retrieved Tue, 30 Apr 2024 10:30:46 +0000
Statistical Computations at FreeStatistics.org, Office for Research Development and Education, URL https://freestatistics.org/blog/index.php?pk=164220, Retrieved Tue, 30 Apr 2024 10:30:46 +0000
QR Codes:

Original text written by user:
IsPrivate?No (this computation is public)
User-defined keywordsKDGP2W12
Estimated Impact118
Family? (F = Feedback message, R = changed R code, M = changed R Module, P = changed Parameters, D = changed Data)
-       [(Partial) Autocorrelation Function] [Autocorrelation N...] [2012-03-31 13:11:34] [63e5472dd76b3a4c96d1871cde01ebd5] [Current]
Feedback Forum

Post a new message
Dataseries X:
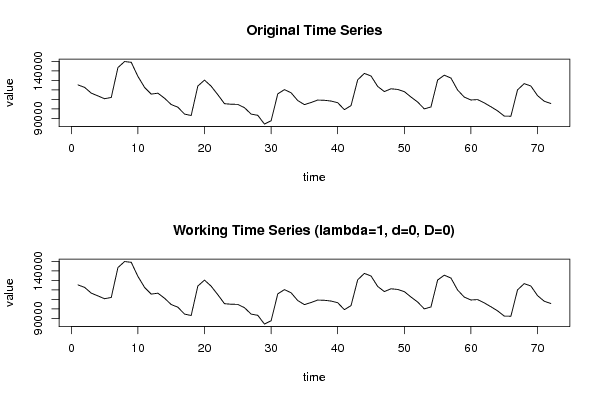
125326
122716
116615
113719
110737
112093
143565
149946
149147
134339
122683
115614
116566
111272
104609
101802
94542
93051
124129
130374
123946
114971
105531
104919
104782
101281
94545
93248
84031
87486
115867
120327
117008
108811
104519
106758
109337
109078
108293
106534
99197
103493
130676
137448
134704
123725
118277
121225
120528
118240
112514
107304
100001
102082
130455
135574
132540
119920
112454
109415
109843
106365
102304
97968
92462
92286
120092
126656
124144
114045
108120
105698


Summary of computational transaction
Raw Inputview raw input (R code)
Raw Outputview raw output of R engine
Computing time2 seconds
R Server'Gertrude Mary Cox' @ cox.wessa.net

\begin{tabular}{lllllllll}
\hline
Summary of computational transaction \tabularnewline
Raw Input & view raw input (R code)  \tabularnewline
Raw Output & view raw output of R engine  \tabularnewline
Computing time & 2 seconds \tabularnewline
R Server & 'Gertrude Mary Cox' @ cox.wessa.net \tabularnewline
\hline
\end{tabular}
%Source: https://freestatistics.org/blog/index.php?pk=164220&T=0

[TABLE]
[ROW][C]Summary of computational transaction[/C][/ROW]
[ROW][C]Raw Input[/C][C]view raw input (R code) [/C][/ROW]
[ROW][C]Raw Output[/C][C]view raw output of R engine [/C][/ROW]
[ROW][C]Computing time[/C][C]2 seconds[/C][/ROW]
[ROW][C]R Server[/C][C]'Gertrude Mary Cox' @ cox.wessa.net[/C][/ROW]
[/TABLE]
Source: https://freestatistics.org/blog/index.php?pk=164220&T=0

Globally Unique Identifier (entire table): ba.freestatistics.org/blog/index.php?pk=164220&T=0

As an alternative you can also use a QR Code:  

The GUIDs for individual cells are displayed in the table below:

Summary of computational transaction
Raw Inputview raw input (R code)
Raw Outputview raw output of R engine
Computing time2 seconds
R Server'Gertrude Mary Cox' @ cox.wessa.net


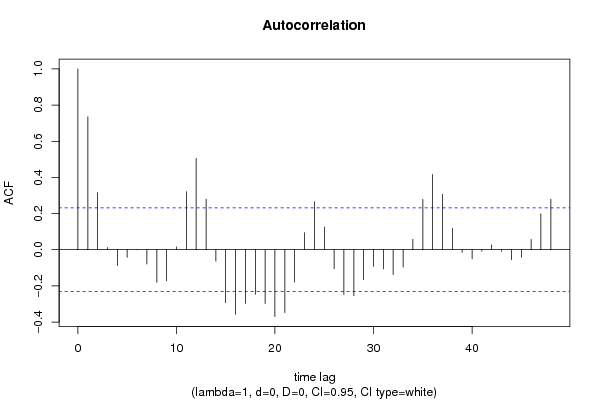
Autocorrelation Function
Time lag kACF(k)T-STATP-value
10.734956.23630
20.3147142.67040.004679
30.0119740.10160.459677
4-0.087-0.73820.231391
5-0.041301-0.35040.363512
60.001530.0130.494837
7-0.07938-0.67360.251372
8-0.180732-1.53360.06476
9-0.171772-1.45750.074659
100.0149410.12680.449734
110.3203712.71840.004106
120.5048024.28342.8e-05
130.2792852.36980.01024
14-0.063083-0.53530.297053
15-0.293096-2.4870.007601
16-0.357372-3.03240.001686
17-0.296816-2.51860.007003
18-0.246683-2.09320.019928
19-0.297311-2.52280.006927
20-0.370297-3.14210.001218
21-0.347444-2.94820.002154
22-0.178386-1.51370.067245
230.0935830.79410.214879
240.2654862.25270.013663
250.1248591.05950.146466
26-0.104862-0.88980.188273
27-0.247194-2.09750.01973
28-0.25495-2.16330.016918
29-0.166324-1.41130.081231
30-0.092845-0.78780.216695
31-0.106155-0.90080.18536
32-0.137126-1.16360.124223
33-0.095371-0.80930.210519
340.0573540.48670.313986
350.2783632.3620.010442
360.4160343.53020.000364
370.3063772.59970.005657
380.1188251.00830.158351
39-0.014608-0.1240.450849
40-0.049897-0.42340.336637
41-0.008022-0.06810.47296
420.0267030.22660.410697
43-0.008931-0.07580.4699
44-0.055126-0.46780.320685
45-0.041278-0.35030.363584
460.0566160.48040.316199
470.1984411.68380.048273
480.2794762.37140.010198

\begin{tabular}{lllllllll}
\hline
Autocorrelation Function \tabularnewline
Time lag k & ACF(k) & T-STAT & P-value \tabularnewline
1 & 0.73495 & 6.2363 & 0 \tabularnewline
2 & 0.314714 & 2.6704 & 0.004679 \tabularnewline
3 & 0.011974 & 0.1016 & 0.459677 \tabularnewline
4 & -0.087 & -0.7382 & 0.231391 \tabularnewline
5 & -0.041301 & -0.3504 & 0.363512 \tabularnewline
6 & 0.00153 & 0.013 & 0.494837 \tabularnewline
7 & -0.07938 & -0.6736 & 0.251372 \tabularnewline
8 & -0.180732 & -1.5336 & 0.06476 \tabularnewline
9 & -0.171772 & -1.4575 & 0.074659 \tabularnewline
10 & 0.014941 & 0.1268 & 0.449734 \tabularnewline
11 & 0.320371 & 2.7184 & 0.004106 \tabularnewline
12 & 0.504802 & 4.2834 & 2.8e-05 \tabularnewline
13 & 0.279285 & 2.3698 & 0.01024 \tabularnewline
14 & -0.063083 & -0.5353 & 0.297053 \tabularnewline
15 & -0.293096 & -2.487 & 0.007601 \tabularnewline
16 & -0.357372 & -3.0324 & 0.001686 \tabularnewline
17 & -0.296816 & -2.5186 & 0.007003 \tabularnewline
18 & -0.246683 & -2.0932 & 0.019928 \tabularnewline
19 & -0.297311 & -2.5228 & 0.006927 \tabularnewline
20 & -0.370297 & -3.1421 & 0.001218 \tabularnewline
21 & -0.347444 & -2.9482 & 0.002154 \tabularnewline
22 & -0.178386 & -1.5137 & 0.067245 \tabularnewline
23 & 0.093583 & 0.7941 & 0.214879 \tabularnewline
24 & 0.265486 & 2.2527 & 0.013663 \tabularnewline
25 & 0.124859 & 1.0595 & 0.146466 \tabularnewline
26 & -0.104862 & -0.8898 & 0.188273 \tabularnewline
27 & -0.247194 & -2.0975 & 0.01973 \tabularnewline
28 & -0.25495 & -2.1633 & 0.016918 \tabularnewline
29 & -0.166324 & -1.4113 & 0.081231 \tabularnewline
30 & -0.092845 & -0.7878 & 0.216695 \tabularnewline
31 & -0.106155 & -0.9008 & 0.18536 \tabularnewline
32 & -0.137126 & -1.1636 & 0.124223 \tabularnewline
33 & -0.095371 & -0.8093 & 0.210519 \tabularnewline
34 & 0.057354 & 0.4867 & 0.313986 \tabularnewline
35 & 0.278363 & 2.362 & 0.010442 \tabularnewline
36 & 0.416034 & 3.5302 & 0.000364 \tabularnewline
37 & 0.306377 & 2.5997 & 0.005657 \tabularnewline
38 & 0.118825 & 1.0083 & 0.158351 \tabularnewline
39 & -0.014608 & -0.124 & 0.450849 \tabularnewline
40 & -0.049897 & -0.4234 & 0.336637 \tabularnewline
41 & -0.008022 & -0.0681 & 0.47296 \tabularnewline
42 & 0.026703 & 0.2266 & 0.410697 \tabularnewline
43 & -0.008931 & -0.0758 & 0.4699 \tabularnewline
44 & -0.055126 & -0.4678 & 0.320685 \tabularnewline
45 & -0.041278 & -0.3503 & 0.363584 \tabularnewline
46 & 0.056616 & 0.4804 & 0.316199 \tabularnewline
47 & 0.198441 & 1.6838 & 0.048273 \tabularnewline
48 & 0.279476 & 2.3714 & 0.010198 \tabularnewline
\hline
\end{tabular}
%Source: https://freestatistics.org/blog/index.php?pk=164220&T=1

[TABLE]
[ROW][C]Autocorrelation Function[/C][/ROW]
[ROW][C]Time lag k[/C][C]ACF(k)[/C][C]T-STAT[/C][C]P-value[/C][/ROW]
[ROW][C]1[/C][C]0.73495[/C][C]6.2363[/C][C]0[/C][/ROW]
[ROW][C]2[/C][C]0.314714[/C][C]2.6704[/C][C]0.004679[/C][/ROW]
[ROW][C]3[/C][C]0.011974[/C][C]0.1016[/C][C]0.459677[/C][/ROW]
[ROW][C]4[/C][C]-0.087[/C][C]-0.7382[/C][C]0.231391[/C][/ROW]
[ROW][C]5[/C][C]-0.041301[/C][C]-0.3504[/C][C]0.363512[/C][/ROW]
[ROW][C]6[/C][C]0.00153[/C][C]0.013[/C][C]0.494837[/C][/ROW]
[ROW][C]7[/C][C]-0.07938[/C][C]-0.6736[/C][C]0.251372[/C][/ROW]
[ROW][C]8[/C][C]-0.180732[/C][C]-1.5336[/C][C]0.06476[/C][/ROW]
[ROW][C]9[/C][C]-0.171772[/C][C]-1.4575[/C][C]0.074659[/C][/ROW]
[ROW][C]10[/C][C]0.014941[/C][C]0.1268[/C][C]0.449734[/C][/ROW]
[ROW][C]11[/C][C]0.320371[/C][C]2.7184[/C][C]0.004106[/C][/ROW]
[ROW][C]12[/C][C]0.504802[/C][C]4.2834[/C][C]2.8e-05[/C][/ROW]
[ROW][C]13[/C][C]0.279285[/C][C]2.3698[/C][C]0.01024[/C][/ROW]
[ROW][C]14[/C][C]-0.063083[/C][C]-0.5353[/C][C]0.297053[/C][/ROW]
[ROW][C]15[/C][C]-0.293096[/C][C]-2.487[/C][C]0.007601[/C][/ROW]
[ROW][C]16[/C][C]-0.357372[/C][C]-3.0324[/C][C]0.001686[/C][/ROW]
[ROW][C]17[/C][C]-0.296816[/C][C]-2.5186[/C][C]0.007003[/C][/ROW]
[ROW][C]18[/C][C]-0.246683[/C][C]-2.0932[/C][C]0.019928[/C][/ROW]
[ROW][C]19[/C][C]-0.297311[/C][C]-2.5228[/C][C]0.006927[/C][/ROW]
[ROW][C]20[/C][C]-0.370297[/C][C]-3.1421[/C][C]0.001218[/C][/ROW]
[ROW][C]21[/C][C]-0.347444[/C][C]-2.9482[/C][C]0.002154[/C][/ROW]
[ROW][C]22[/C][C]-0.178386[/C][C]-1.5137[/C][C]0.067245[/C][/ROW]
[ROW][C]23[/C][C]0.093583[/C][C]0.7941[/C][C]0.214879[/C][/ROW]
[ROW][C]24[/C][C]0.265486[/C][C]2.2527[/C][C]0.013663[/C][/ROW]
[ROW][C]25[/C][C]0.124859[/C][C]1.0595[/C][C]0.146466[/C][/ROW]
[ROW][C]26[/C][C]-0.104862[/C][C]-0.8898[/C][C]0.188273[/C][/ROW]
[ROW][C]27[/C][C]-0.247194[/C][C]-2.0975[/C][C]0.01973[/C][/ROW]
[ROW][C]28[/C][C]-0.25495[/C][C]-2.1633[/C][C]0.016918[/C][/ROW]
[ROW][C]29[/C][C]-0.166324[/C][C]-1.4113[/C][C]0.081231[/C][/ROW]
[ROW][C]30[/C][C]-0.092845[/C][C]-0.7878[/C][C]0.216695[/C][/ROW]
[ROW][C]31[/C][C]-0.106155[/C][C]-0.9008[/C][C]0.18536[/C][/ROW]
[ROW][C]32[/C][C]-0.137126[/C][C]-1.1636[/C][C]0.124223[/C][/ROW]
[ROW][C]33[/C][C]-0.095371[/C][C]-0.8093[/C][C]0.210519[/C][/ROW]
[ROW][C]34[/C][C]0.057354[/C][C]0.4867[/C][C]0.313986[/C][/ROW]
[ROW][C]35[/C][C]0.278363[/C][C]2.362[/C][C]0.010442[/C][/ROW]
[ROW][C]36[/C][C]0.416034[/C][C]3.5302[/C][C]0.000364[/C][/ROW]
[ROW][C]37[/C][C]0.306377[/C][C]2.5997[/C][C]0.005657[/C][/ROW]
[ROW][C]38[/C][C]0.118825[/C][C]1.0083[/C][C]0.158351[/C][/ROW]
[ROW][C]39[/C][C]-0.014608[/C][C]-0.124[/C][C]0.450849[/C][/ROW]
[ROW][C]40[/C][C]-0.049897[/C][C]-0.4234[/C][C]0.336637[/C][/ROW]
[ROW][C]41[/C][C]-0.008022[/C][C]-0.0681[/C][C]0.47296[/C][/ROW]
[ROW][C]42[/C][C]0.026703[/C][C]0.2266[/C][C]0.410697[/C][/ROW]
[ROW][C]43[/C][C]-0.008931[/C][C]-0.0758[/C][C]0.4699[/C][/ROW]
[ROW][C]44[/C][C]-0.055126[/C][C]-0.4678[/C][C]0.320685[/C][/ROW]
[ROW][C]45[/C][C]-0.041278[/C][C]-0.3503[/C][C]0.363584[/C][/ROW]
[ROW][C]46[/C][C]0.056616[/C][C]0.4804[/C][C]0.316199[/C][/ROW]
[ROW][C]47[/C][C]0.198441[/C][C]1.6838[/C][C]0.048273[/C][/ROW]
[ROW][C]48[/C][C]0.279476[/C][C]2.3714[/C][C]0.010198[/C][/ROW]
[/TABLE]
Source: https://freestatistics.org/blog/index.php?pk=164220&T=1

Globally Unique Identifier (entire table): ba.freestatistics.org/blog/index.php?pk=164220&T=1

As an alternative you can also use a QR Code:  

The GUIDs for individual cells are displayed in the table below:

Autocorrelation Function
Time lag kACF(k)T-STATP-value
10.734956.23630
20.3147142.67040.004679
30.0119740.10160.459677
4-0.087-0.73820.231391
5-0.041301-0.35040.363512
60.001530.0130.494837
7-0.07938-0.67360.251372
8-0.180732-1.53360.06476
9-0.171772-1.45750.074659
100.0149410.12680.449734
110.3203712.71840.004106
120.5048024.28342.8e-05
130.2792852.36980.01024
14-0.063083-0.53530.297053
15-0.293096-2.4870.007601
16-0.357372-3.03240.001686
17-0.296816-2.51860.007003
18-0.246683-2.09320.019928
19-0.297311-2.52280.006927
20-0.370297-3.14210.001218
21-0.347444-2.94820.002154
22-0.178386-1.51370.067245
230.0935830.79410.214879
240.2654862.25270.013663
250.1248591.05950.146466
26-0.104862-0.88980.188273
27-0.247194-2.09750.01973
28-0.25495-2.16330.016918
29-0.166324-1.41130.081231
30-0.092845-0.78780.216695
31-0.106155-0.90080.18536
32-0.137126-1.16360.124223
33-0.095371-0.80930.210519
340.0573540.48670.313986
350.2783632.3620.010442
360.4160343.53020.000364
370.3063772.59970.005657
380.1188251.00830.158351
39-0.014608-0.1240.450849
40-0.049897-0.42340.336637
41-0.008022-0.06810.47296
420.0267030.22660.410697
43-0.008931-0.07580.4699
44-0.055126-0.46780.320685
45-0.041278-0.35030.363584
460.0566160.48040.316199
470.1984411.68380.048273
480.2794762.37140.010198


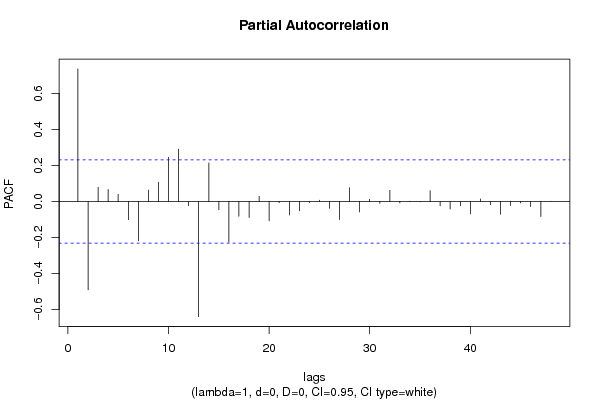
Partial Autocorrelation Function
Time lag kPACF(k)T-STATP-value
10.734956.23630
2-0.490242-4.15984.3e-05
30.0789690.67010.252478
40.0659370.55950.288781
50.0392590.33310.370003
6-0.100841-0.85570.197511
7-0.217913-1.84910.034278
80.0630090.53470.297269
90.1060680.90.185557
100.245422.08250.020427
110.2892232.45410.008271
12-0.023444-0.19890.421439
13-0.639124-5.42310
140.2132111.80920.037301
15-0.046012-0.39040.348688
16-0.225794-1.91590.029673
17-0.08202-0.6960.244345
18-0.0896-0.76030.224785
190.0280680.23820.406216
20-0.107394-0.91130.182597
21-0.007269-0.06170.475493
22-0.074822-0.63490.263758
23-0.052116-0.44220.329828
24-0.006294-0.05340.478777
250.0067040.05690.477399
26-0.037902-0.32160.374339
27-0.100028-0.84880.199412
280.0758680.64380.260889
29-0.05794-0.49160.312235
300.011890.10090.459958
31-0.009685-0.08220.467366
320.0613240.52030.302208
33-0.007881-0.06690.473435
340.0014270.01210.495185
35-0.002027-0.01720.493161
360.059260.50280.308306
37-0.024173-0.20510.419029
38-0.042219-0.35820.360606
39-0.023807-0.2020.420241
40-0.068834-0.58410.280497
410.0140230.1190.452806
42-0.017802-0.15110.440176
43-0.071297-0.6050.273548
44-0.022982-0.1950.422967
45-0.008019-0.0680.472972
46-0.027836-0.23620.406974
47-0.0832-0.7060.241241
480.0004110.00350.498614

\begin{tabular}{lllllllll}
\hline
Partial Autocorrelation Function \tabularnewline
Time lag k & PACF(k) & T-STAT & P-value \tabularnewline
1 & 0.73495 & 6.2363 & 0 \tabularnewline
2 & -0.490242 & -4.1598 & 4.3e-05 \tabularnewline
3 & 0.078969 & 0.6701 & 0.252478 \tabularnewline
4 & 0.065937 & 0.5595 & 0.288781 \tabularnewline
5 & 0.039259 & 0.3331 & 0.370003 \tabularnewline
6 & -0.100841 & -0.8557 & 0.197511 \tabularnewline
7 & -0.217913 & -1.8491 & 0.034278 \tabularnewline
8 & 0.063009 & 0.5347 & 0.297269 \tabularnewline
9 & 0.106068 & 0.9 & 0.185557 \tabularnewline
10 & 0.24542 & 2.0825 & 0.020427 \tabularnewline
11 & 0.289223 & 2.4541 & 0.008271 \tabularnewline
12 & -0.023444 & -0.1989 & 0.421439 \tabularnewline
13 & -0.639124 & -5.4231 & 0 \tabularnewline
14 & 0.213211 & 1.8092 & 0.037301 \tabularnewline
15 & -0.046012 & -0.3904 & 0.348688 \tabularnewline
16 & -0.225794 & -1.9159 & 0.029673 \tabularnewline
17 & -0.08202 & -0.696 & 0.244345 \tabularnewline
18 & -0.0896 & -0.7603 & 0.224785 \tabularnewline
19 & 0.028068 & 0.2382 & 0.406216 \tabularnewline
20 & -0.107394 & -0.9113 & 0.182597 \tabularnewline
21 & -0.007269 & -0.0617 & 0.475493 \tabularnewline
22 & -0.074822 & -0.6349 & 0.263758 \tabularnewline
23 & -0.052116 & -0.4422 & 0.329828 \tabularnewline
24 & -0.006294 & -0.0534 & 0.478777 \tabularnewline
25 & 0.006704 & 0.0569 & 0.477399 \tabularnewline
26 & -0.037902 & -0.3216 & 0.374339 \tabularnewline
27 & -0.100028 & -0.8488 & 0.199412 \tabularnewline
28 & 0.075868 & 0.6438 & 0.260889 \tabularnewline
29 & -0.05794 & -0.4916 & 0.312235 \tabularnewline
30 & 0.01189 & 0.1009 & 0.459958 \tabularnewline
31 & -0.009685 & -0.0822 & 0.467366 \tabularnewline
32 & 0.061324 & 0.5203 & 0.302208 \tabularnewline
33 & -0.007881 & -0.0669 & 0.473435 \tabularnewline
34 & 0.001427 & 0.0121 & 0.495185 \tabularnewline
35 & -0.002027 & -0.0172 & 0.493161 \tabularnewline
36 & 0.05926 & 0.5028 & 0.308306 \tabularnewline
37 & -0.024173 & -0.2051 & 0.419029 \tabularnewline
38 & -0.042219 & -0.3582 & 0.360606 \tabularnewline
39 & -0.023807 & -0.202 & 0.420241 \tabularnewline
40 & -0.068834 & -0.5841 & 0.280497 \tabularnewline
41 & 0.014023 & 0.119 & 0.452806 \tabularnewline
42 & -0.017802 & -0.1511 & 0.440176 \tabularnewline
43 & -0.071297 & -0.605 & 0.273548 \tabularnewline
44 & -0.022982 & -0.195 & 0.422967 \tabularnewline
45 & -0.008019 & -0.068 & 0.472972 \tabularnewline
46 & -0.027836 & -0.2362 & 0.406974 \tabularnewline
47 & -0.0832 & -0.706 & 0.241241 \tabularnewline
48 & 0.000411 & 0.0035 & 0.498614 \tabularnewline
\hline
\end{tabular}
%Source: https://freestatistics.org/blog/index.php?pk=164220&T=2

[TABLE]
[ROW][C]Partial Autocorrelation Function[/C][/ROW]
[ROW][C]Time lag k[/C][C]PACF(k)[/C][C]T-STAT[/C][C]P-value[/C][/ROW]
[ROW][C]1[/C][C]0.73495[/C][C]6.2363[/C][C]0[/C][/ROW]
[ROW][C]2[/C][C]-0.490242[/C][C]-4.1598[/C][C]4.3e-05[/C][/ROW]
[ROW][C]3[/C][C]0.078969[/C][C]0.6701[/C][C]0.252478[/C][/ROW]
[ROW][C]4[/C][C]0.065937[/C][C]0.5595[/C][C]0.288781[/C][/ROW]
[ROW][C]5[/C][C]0.039259[/C][C]0.3331[/C][C]0.370003[/C][/ROW]
[ROW][C]6[/C][C]-0.100841[/C][C]-0.8557[/C][C]0.197511[/C][/ROW]
[ROW][C]7[/C][C]-0.217913[/C][C]-1.8491[/C][C]0.034278[/C][/ROW]
[ROW][C]8[/C][C]0.063009[/C][C]0.5347[/C][C]0.297269[/C][/ROW]
[ROW][C]9[/C][C]0.106068[/C][C]0.9[/C][C]0.185557[/C][/ROW]
[ROW][C]10[/C][C]0.24542[/C][C]2.0825[/C][C]0.020427[/C][/ROW]
[ROW][C]11[/C][C]0.289223[/C][C]2.4541[/C][C]0.008271[/C][/ROW]
[ROW][C]12[/C][C]-0.023444[/C][C]-0.1989[/C][C]0.421439[/C][/ROW]
[ROW][C]13[/C][C]-0.639124[/C][C]-5.4231[/C][C]0[/C][/ROW]
[ROW][C]14[/C][C]0.213211[/C][C]1.8092[/C][C]0.037301[/C][/ROW]
[ROW][C]15[/C][C]-0.046012[/C][C]-0.3904[/C][C]0.348688[/C][/ROW]
[ROW][C]16[/C][C]-0.225794[/C][C]-1.9159[/C][C]0.029673[/C][/ROW]
[ROW][C]17[/C][C]-0.08202[/C][C]-0.696[/C][C]0.244345[/C][/ROW]
[ROW][C]18[/C][C]-0.0896[/C][C]-0.7603[/C][C]0.224785[/C][/ROW]
[ROW][C]19[/C][C]0.028068[/C][C]0.2382[/C][C]0.406216[/C][/ROW]
[ROW][C]20[/C][C]-0.107394[/C][C]-0.9113[/C][C]0.182597[/C][/ROW]
[ROW][C]21[/C][C]-0.007269[/C][C]-0.0617[/C][C]0.475493[/C][/ROW]
[ROW][C]22[/C][C]-0.074822[/C][C]-0.6349[/C][C]0.263758[/C][/ROW]
[ROW][C]23[/C][C]-0.052116[/C][C]-0.4422[/C][C]0.329828[/C][/ROW]
[ROW][C]24[/C][C]-0.006294[/C][C]-0.0534[/C][C]0.478777[/C][/ROW]
[ROW][C]25[/C][C]0.006704[/C][C]0.0569[/C][C]0.477399[/C][/ROW]
[ROW][C]26[/C][C]-0.037902[/C][C]-0.3216[/C][C]0.374339[/C][/ROW]
[ROW][C]27[/C][C]-0.100028[/C][C]-0.8488[/C][C]0.199412[/C][/ROW]
[ROW][C]28[/C][C]0.075868[/C][C]0.6438[/C][C]0.260889[/C][/ROW]
[ROW][C]29[/C][C]-0.05794[/C][C]-0.4916[/C][C]0.312235[/C][/ROW]
[ROW][C]30[/C][C]0.01189[/C][C]0.1009[/C][C]0.459958[/C][/ROW]
[ROW][C]31[/C][C]-0.009685[/C][C]-0.0822[/C][C]0.467366[/C][/ROW]
[ROW][C]32[/C][C]0.061324[/C][C]0.5203[/C][C]0.302208[/C][/ROW]
[ROW][C]33[/C][C]-0.007881[/C][C]-0.0669[/C][C]0.473435[/C][/ROW]
[ROW][C]34[/C][C]0.001427[/C][C]0.0121[/C][C]0.495185[/C][/ROW]
[ROW][C]35[/C][C]-0.002027[/C][C]-0.0172[/C][C]0.493161[/C][/ROW]
[ROW][C]36[/C][C]0.05926[/C][C]0.5028[/C][C]0.308306[/C][/ROW]
[ROW][C]37[/C][C]-0.024173[/C][C]-0.2051[/C][C]0.419029[/C][/ROW]
[ROW][C]38[/C][C]-0.042219[/C][C]-0.3582[/C][C]0.360606[/C][/ROW]
[ROW][C]39[/C][C]-0.023807[/C][C]-0.202[/C][C]0.420241[/C][/ROW]
[ROW][C]40[/C][C]-0.068834[/C][C]-0.5841[/C][C]0.280497[/C][/ROW]
[ROW][C]41[/C][C]0.014023[/C][C]0.119[/C][C]0.452806[/C][/ROW]
[ROW][C]42[/C][C]-0.017802[/C][C]-0.1511[/C][C]0.440176[/C][/ROW]
[ROW][C]43[/C][C]-0.071297[/C][C]-0.605[/C][C]0.273548[/C][/ROW]
[ROW][C]44[/C][C]-0.022982[/C][C]-0.195[/C][C]0.422967[/C][/ROW]
[ROW][C]45[/C][C]-0.008019[/C][C]-0.068[/C][C]0.472972[/C][/ROW]
[ROW][C]46[/C][C]-0.027836[/C][C]-0.2362[/C][C]0.406974[/C][/ROW]
[ROW][C]47[/C][C]-0.0832[/C][C]-0.706[/C][C]0.241241[/C][/ROW]
[ROW][C]48[/C][C]0.000411[/C][C]0.0035[/C][C]0.498614[/C][/ROW]
[/TABLE]
Source: https://freestatistics.org/blog/index.php?pk=164220&T=2

Globally Unique Identifier (entire table): ba.freestatistics.org/blog/index.php?pk=164220&T=2

As an alternative you can also use a QR Code:  

The GUIDs for individual cells are displayed in the table below:

Partial Autocorrelation Function
Time lag kPACF(k)T-STATP-value
10.734956.23630
2-0.490242-4.15984.3e-05
30.0789690.67010.252478
40.0659370.55950.288781
50.0392590.33310.370003
6-0.100841-0.85570.197511
7-0.217913-1.84910.034278
80.0630090.53470.297269
90.1060680.90.185557
100.245422.08250.020427
110.2892232.45410.008271
12-0.023444-0.19890.421439
13-0.639124-5.42310
140.2132111.80920.037301
15-0.046012-0.39040.348688
16-0.225794-1.91590.029673
17-0.08202-0.6960.244345
18-0.0896-0.76030.224785
190.0280680.23820.406216
20-0.107394-0.91130.182597
21-0.007269-0.06170.475493
22-0.074822-0.63490.263758
23-0.052116-0.44220.329828
24-0.006294-0.05340.478777
250.0067040.05690.477399
26-0.037902-0.32160.374339
27-0.100028-0.84880.199412
280.0758680.64380.260889
29-0.05794-0.49160.312235
300.011890.10090.459958
31-0.009685-0.08220.467366
320.0613240.52030.302208
33-0.007881-0.06690.473435
340.0014270.01210.495185
35-0.002027-0.01720.493161
360.059260.50280.308306
37-0.024173-0.20510.419029
38-0.042219-0.35820.360606
39-0.023807-0.2020.420241
40-0.068834-0.58410.280497
410.0140230.1190.452806
42-0.017802-0.15110.440176
43-0.071297-0.6050.273548
44-0.022982-0.1950.422967
45-0.008019-0.0680.472972
46-0.027836-0.23620.406974
47-0.0832-0.7060.241241
480.0004110.00350.498614


Parameters (Session):
par1 = 48 ; par2 = 1 ; par3 = 0 ; par4 = 0 ; par5 = 12 ; par6 = White Noise ; par7 = 0.95 ;
Parameters (R input):
par1 = 48 ; par2 = 1 ; par3 = 0 ; par4 = 0 ; par5 = 12 ; par6 = White Noise ; par7 = 0.95 ; par8 = ;
R code (references can be found in the software module):
if (par1 == 'Default') {
par1 = 10*log10(length(x))
} else {
par1 <- as.numeric(par1)
}
par2 <- as.numeric(par2)
par3 <- as.numeric(par3)
par4 <- as.numeric(par4)
par5 <- as.numeric(par5)
if (par6 == 'White Noise') par6 <- 'white' else par6 <- 'ma'
par7 <- as.numeric(par7)
if (par8 != '') par8 <- as.numeric(par8)
ox <- x
if (par8 == '') {
if (par2 == 0) {
x <- log(x)
} else {
x <- (x ^ par2 - 1) / par2
}
} else {
x <- log(x,base=par8)
}
if (par3 > 0) x <- diff(x,lag=1,difference=par3)
if (par4 > 0) x <- diff(x,lag=par5,difference=par4)
bitmap(file='picts.png')
op <- par(mfrow=c(2,1))
plot(ox,type='l',main='Original Time Series',xlab='time',ylab='value')
if (par8=='') {
mytitle <- paste('Working Time Series (lambda=',par2,', d=',par3,', D=',par4,')',sep='')
mysub <- paste('(lambda=',par2,', d=',par3,', D=',par4,', CI=', par7, ', CI type=',par6,')',sep='')
} else {
mytitle <- paste('Working Time Series (base=',par8,', d=',par3,', D=',par4,')',sep='')
mysub <- paste('(base=',par8,', d=',par3,', D=',par4,', CI=', par7, ', CI type=',par6,')',sep='')
}
plot(x,type='l', main=mytitle,xlab='time',ylab='value')
par(op)
dev.off()
bitmap(file='pic1.png')
racf <- acf(x, par1, main='Autocorrelation', xlab='time lag', ylab='ACF', ci.type=par6, ci=par7, sub=mysub)
dev.off()
bitmap(file='pic2.png')
rpacf <- pacf(x,par1,main='Partial Autocorrelation',xlab='lags',ylab='PACF',sub=mysub)
dev.off()
(myacf <- c(racf$acf))
(mypacf <- c(rpacf$acf))
lengthx <- length(x)
sqrtn <- sqrt(lengthx)
load(file='createtable')
a<-table.start()
a<-table.row.start(a)
a<-table.element(a,'Autocorrelation Function',4,TRUE)
a<-table.row.end(a)
a<-table.row.start(a)
a<-table.element(a,'Time lag k',header=TRUE)
a<-table.element(a,hyperlink('basics.htm','ACF(k)','click here for more information about the Autocorrelation Function'),header=TRUE)
a<-table.element(a,'T-STAT',header=TRUE)
a<-table.element(a,'P-value',header=TRUE)
a<-table.row.end(a)
for (i in 2:(par1+1)) {
a<-table.row.start(a)
a<-table.element(a,i-1,header=TRUE)
a<-table.element(a,round(myacf[i],6))
mytstat <- myacf[i]*sqrtn
a<-table.element(a,round(mytstat,4))
a<-table.element(a,round(1-pt(abs(mytstat),lengthx),6))
a<-table.row.end(a)
}
a<-table.end(a)
table.save(a,file='mytable.tab')
a<-table.start()
a<-table.row.start(a)
a<-table.element(a,'Partial Autocorrelation Function',4,TRUE)
a<-table.row.end(a)
a<-table.row.start(a)
a<-table.element(a,'Time lag k',header=TRUE)
a<-table.element(a,hyperlink('basics.htm','PACF(k)','click here for more information about the Partial Autocorrelation Function'),header=TRUE)
a<-table.element(a,'T-STAT',header=TRUE)
a<-table.element(a,'P-value',header=TRUE)
a<-table.row.end(a)
for (i in 1:par1) {
a<-table.row.start(a)
a<-table.element(a,i,header=TRUE)
a<-table.element(a,round(mypacf[i],6))
mytstat <- mypacf[i]*sqrtn
a<-table.element(a,round(mytstat,4))
a<-table.element(a,round(1-pt(abs(mytstat),lengthx),6))
a<-table.row.end(a)
}
a<-table.end(a)
table.save(a,file='mytable1.tab')