Free Statistics

of Irreproducible Research!

Author's title

Author*Unverified author*
R Software Modulerwasp_autocorrelation.wasp
Title produced by software(Partial) Autocorrelation Function
Date of computationSat, 31 Mar 2012 09:15:36 -0400
Cite this page as followsStatistical Computations at FreeStatistics.org, Office for Research Development and Education, URL https://freestatistics.org/blog/index.php?v=date/2012/Mar/31/t1333199765quenpf3sjtvzj0l.htm/, Retrieved Tue, 30 Apr 2024 09:39:53 +0000
Statistical Computations at FreeStatistics.org, Office for Research Development and Education, URL https://freestatistics.org/blog/index.php?pk=164221, Retrieved Tue, 30 Apr 2024 09:39:53 +0000
QR Codes:

Original text written by user:
IsPrivate?No (this computation is public)
User-defined keywordsKDGP2W12
Estimated Impact122
Family? (F = Feedback message, R = changed R code, M = changed R Module, P = changed Parameters, D = changed Data)
-       [(Partial) Autocorrelation Function] [Autocorrelation N...] [2012-03-31 13:15:36] [63e5472dd76b3a4c96d1871cde01ebd5] [Current]
Feedback Forum

Post a new message
Dataseries X:
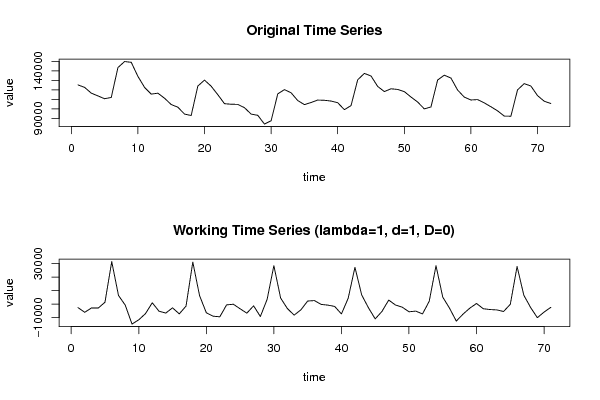
125326
122716
116615
113719
110737
112093
143565
149946
149147
134339
122683
115614
116566
111272
104609
101802
94542
93051
124129
130374
123946
114971
105531
104919
104782
101281
94545
93248
84031
87486
115867
120327
117008
108811
104519
106758
109337
109078
108293
106534
99197
103493
130676
137448
134704
123725
118277
121225
120528
118240
112514
107304
100001
102082
130455
135574
132540
119920
112454
109415
109843
106365
102304
97968
92462
92286
120092
126656
124144
114045
108120
105698


Summary of computational transaction
Raw Inputview raw input (R code)
Raw Outputview raw output of R engine
Computing time2 seconds
R Server'Gertrude Mary Cox' @ cox.wessa.net

\begin{tabular}{lllllllll}
\hline
Summary of computational transaction \tabularnewline
Raw Input & view raw input (R code)  \tabularnewline
Raw Output & view raw output of R engine  \tabularnewline
Computing time & 2 seconds \tabularnewline
R Server & 'Gertrude Mary Cox' @ cox.wessa.net \tabularnewline
\hline
\end{tabular}
%Source: https://freestatistics.org/blog/index.php?pk=164221&T=0

[TABLE]
[ROW][C]Summary of computational transaction[/C][/ROW]
[ROW][C]Raw Input[/C][C]view raw input (R code) [/C][/ROW]
[ROW][C]Raw Output[/C][C]view raw output of R engine [/C][/ROW]
[ROW][C]Computing time[/C][C]2 seconds[/C][/ROW]
[ROW][C]R Server[/C][C]'Gertrude Mary Cox' @ cox.wessa.net[/C][/ROW]
[/TABLE]
Source: https://freestatistics.org/blog/index.php?pk=164221&T=0

Globally Unique Identifier (entire table): ba.freestatistics.org/blog/index.php?pk=164221&T=0

As an alternative you can also use a QR Code:  

The GUIDs for individual cells are displayed in the table below:

Summary of computational transaction
Raw Inputview raw input (R code)
Raw Outputview raw output of R engine
Computing time2 seconds
R Server'Gertrude Mary Cox' @ cox.wessa.net


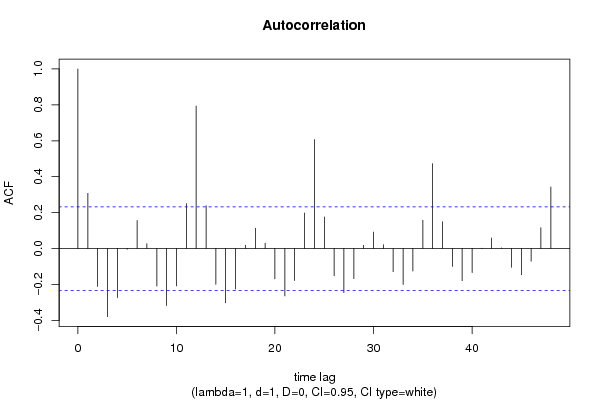
Autocorrelation Function
Time lag kACF(k)T-STATP-value
10.3074232.59040.005813
2-0.211632-1.78320.03941
3-0.379093-3.19430.001046
4-0.272503-2.29620.012311
5-0.003648-0.03070.487783
60.1562551.31660.096099
70.0272290.22940.409595
8-0.208681-1.75840.041496
9-0.317395-2.67440.004642
10-0.207677-1.74990.042227
110.2497262.10420.01945
120.792946.68140
130.2385612.01020.024108
14-0.198483-1.67250.049418
15-0.30201-2.54480.006555
16-0.225662-1.90150.03065
170.0182280.15360.439185
180.1126740.94940.172816
190.0295830.24930.401936
20-0.16829-1.4180.080277
21-0.263662-2.22170.014748
22-0.177773-1.49790.069291
230.1980261.66860.049801
240.6077245.12081e-06
250.1756511.48010.07164
26-0.151753-1.27870.102585
27-0.245535-2.06890.021098
28-0.167266-1.40940.08154
290.0176430.14870.441121
300.0914990.7710.221636
310.0211390.17810.429569
32-0.128339-1.08140.141588
33-0.200438-1.68890.047811
34-0.124842-1.05190.148198
350.1580751.3320.093566
360.4723343.988.2e-05
370.1485011.25130.107468
38-0.099357-0.83720.202646
39-0.178501-1.50410.068499
40-0.133757-1.12710.131756
410.0020130.0170.493257
420.0589250.49650.310535
430.003180.02680.489348
44-0.103899-0.87550.192136
45-0.145433-1.22540.112229
46-0.070087-0.59060.278345
470.1159090.97670.166025
480.3423842.8850.00259

\begin{tabular}{lllllllll}
\hline
Autocorrelation Function \tabularnewline
Time lag k & ACF(k) & T-STAT & P-value \tabularnewline
1 & 0.307423 & 2.5904 & 0.005813 \tabularnewline
2 & -0.211632 & -1.7832 & 0.03941 \tabularnewline
3 & -0.379093 & -3.1943 & 0.001046 \tabularnewline
4 & -0.272503 & -2.2962 & 0.012311 \tabularnewline
5 & -0.003648 & -0.0307 & 0.487783 \tabularnewline
6 & 0.156255 & 1.3166 & 0.096099 \tabularnewline
7 & 0.027229 & 0.2294 & 0.409595 \tabularnewline
8 & -0.208681 & -1.7584 & 0.041496 \tabularnewline
9 & -0.317395 & -2.6744 & 0.004642 \tabularnewline
10 & -0.207677 & -1.7499 & 0.042227 \tabularnewline
11 & 0.249726 & 2.1042 & 0.01945 \tabularnewline
12 & 0.79294 & 6.6814 & 0 \tabularnewline
13 & 0.238561 & 2.0102 & 0.024108 \tabularnewline
14 & -0.198483 & -1.6725 & 0.049418 \tabularnewline
15 & -0.30201 & -2.5448 & 0.006555 \tabularnewline
16 & -0.225662 & -1.9015 & 0.03065 \tabularnewline
17 & 0.018228 & 0.1536 & 0.439185 \tabularnewline
18 & 0.112674 & 0.9494 & 0.172816 \tabularnewline
19 & 0.029583 & 0.2493 & 0.401936 \tabularnewline
20 & -0.16829 & -1.418 & 0.080277 \tabularnewline
21 & -0.263662 & -2.2217 & 0.014748 \tabularnewline
22 & -0.177773 & -1.4979 & 0.069291 \tabularnewline
23 & 0.198026 & 1.6686 & 0.049801 \tabularnewline
24 & 0.607724 & 5.1208 & 1e-06 \tabularnewline
25 & 0.175651 & 1.4801 & 0.07164 \tabularnewline
26 & -0.151753 & -1.2787 & 0.102585 \tabularnewline
27 & -0.245535 & -2.0689 & 0.021098 \tabularnewline
28 & -0.167266 & -1.4094 & 0.08154 \tabularnewline
29 & 0.017643 & 0.1487 & 0.441121 \tabularnewline
30 & 0.091499 & 0.771 & 0.221636 \tabularnewline
31 & 0.021139 & 0.1781 & 0.429569 \tabularnewline
32 & -0.128339 & -1.0814 & 0.141588 \tabularnewline
33 & -0.200438 & -1.6889 & 0.047811 \tabularnewline
34 & -0.124842 & -1.0519 & 0.148198 \tabularnewline
35 & 0.158075 & 1.332 & 0.093566 \tabularnewline
36 & 0.472334 & 3.98 & 8.2e-05 \tabularnewline
37 & 0.148501 & 1.2513 & 0.107468 \tabularnewline
38 & -0.099357 & -0.8372 & 0.202646 \tabularnewline
39 & -0.178501 & -1.5041 & 0.068499 \tabularnewline
40 & -0.133757 & -1.1271 & 0.131756 \tabularnewline
41 & 0.002013 & 0.017 & 0.493257 \tabularnewline
42 & 0.058925 & 0.4965 & 0.310535 \tabularnewline
43 & 0.00318 & 0.0268 & 0.489348 \tabularnewline
44 & -0.103899 & -0.8755 & 0.192136 \tabularnewline
45 & -0.145433 & -1.2254 & 0.112229 \tabularnewline
46 & -0.070087 & -0.5906 & 0.278345 \tabularnewline
47 & 0.115909 & 0.9767 & 0.166025 \tabularnewline
48 & 0.342384 & 2.885 & 0.00259 \tabularnewline
\hline
\end{tabular}
%Source: https://freestatistics.org/blog/index.php?pk=164221&T=1

[TABLE]
[ROW][C]Autocorrelation Function[/C][/ROW]
[ROW][C]Time lag k[/C][C]ACF(k)[/C][C]T-STAT[/C][C]P-value[/C][/ROW]
[ROW][C]1[/C][C]0.307423[/C][C]2.5904[/C][C]0.005813[/C][/ROW]
[ROW][C]2[/C][C]-0.211632[/C][C]-1.7832[/C][C]0.03941[/C][/ROW]
[ROW][C]3[/C][C]-0.379093[/C][C]-3.1943[/C][C]0.001046[/C][/ROW]
[ROW][C]4[/C][C]-0.272503[/C][C]-2.2962[/C][C]0.012311[/C][/ROW]
[ROW][C]5[/C][C]-0.003648[/C][C]-0.0307[/C][C]0.487783[/C][/ROW]
[ROW][C]6[/C][C]0.156255[/C][C]1.3166[/C][C]0.096099[/C][/ROW]
[ROW][C]7[/C][C]0.027229[/C][C]0.2294[/C][C]0.409595[/C][/ROW]
[ROW][C]8[/C][C]-0.208681[/C][C]-1.7584[/C][C]0.041496[/C][/ROW]
[ROW][C]9[/C][C]-0.317395[/C][C]-2.6744[/C][C]0.004642[/C][/ROW]
[ROW][C]10[/C][C]-0.207677[/C][C]-1.7499[/C][C]0.042227[/C][/ROW]
[ROW][C]11[/C][C]0.249726[/C][C]2.1042[/C][C]0.01945[/C][/ROW]
[ROW][C]12[/C][C]0.79294[/C][C]6.6814[/C][C]0[/C][/ROW]
[ROW][C]13[/C][C]0.238561[/C][C]2.0102[/C][C]0.024108[/C][/ROW]
[ROW][C]14[/C][C]-0.198483[/C][C]-1.6725[/C][C]0.049418[/C][/ROW]
[ROW][C]15[/C][C]-0.30201[/C][C]-2.5448[/C][C]0.006555[/C][/ROW]
[ROW][C]16[/C][C]-0.225662[/C][C]-1.9015[/C][C]0.03065[/C][/ROW]
[ROW][C]17[/C][C]0.018228[/C][C]0.1536[/C][C]0.439185[/C][/ROW]
[ROW][C]18[/C][C]0.112674[/C][C]0.9494[/C][C]0.172816[/C][/ROW]
[ROW][C]19[/C][C]0.029583[/C][C]0.2493[/C][C]0.401936[/C][/ROW]
[ROW][C]20[/C][C]-0.16829[/C][C]-1.418[/C][C]0.080277[/C][/ROW]
[ROW][C]21[/C][C]-0.263662[/C][C]-2.2217[/C][C]0.014748[/C][/ROW]
[ROW][C]22[/C][C]-0.177773[/C][C]-1.4979[/C][C]0.069291[/C][/ROW]
[ROW][C]23[/C][C]0.198026[/C][C]1.6686[/C][C]0.049801[/C][/ROW]
[ROW][C]24[/C][C]0.607724[/C][C]5.1208[/C][C]1e-06[/C][/ROW]
[ROW][C]25[/C][C]0.175651[/C][C]1.4801[/C][C]0.07164[/C][/ROW]
[ROW][C]26[/C][C]-0.151753[/C][C]-1.2787[/C][C]0.102585[/C][/ROW]
[ROW][C]27[/C][C]-0.245535[/C][C]-2.0689[/C][C]0.021098[/C][/ROW]
[ROW][C]28[/C][C]-0.167266[/C][C]-1.4094[/C][C]0.08154[/C][/ROW]
[ROW][C]29[/C][C]0.017643[/C][C]0.1487[/C][C]0.441121[/C][/ROW]
[ROW][C]30[/C][C]0.091499[/C][C]0.771[/C][C]0.221636[/C][/ROW]
[ROW][C]31[/C][C]0.021139[/C][C]0.1781[/C][C]0.429569[/C][/ROW]
[ROW][C]32[/C][C]-0.128339[/C][C]-1.0814[/C][C]0.141588[/C][/ROW]
[ROW][C]33[/C][C]-0.200438[/C][C]-1.6889[/C][C]0.047811[/C][/ROW]
[ROW][C]34[/C][C]-0.124842[/C][C]-1.0519[/C][C]0.148198[/C][/ROW]
[ROW][C]35[/C][C]0.158075[/C][C]1.332[/C][C]0.093566[/C][/ROW]
[ROW][C]36[/C][C]0.472334[/C][C]3.98[/C][C]8.2e-05[/C][/ROW]
[ROW][C]37[/C][C]0.148501[/C][C]1.2513[/C][C]0.107468[/C][/ROW]
[ROW][C]38[/C][C]-0.099357[/C][C]-0.8372[/C][C]0.202646[/C][/ROW]
[ROW][C]39[/C][C]-0.178501[/C][C]-1.5041[/C][C]0.068499[/C][/ROW]
[ROW][C]40[/C][C]-0.133757[/C][C]-1.1271[/C][C]0.131756[/C][/ROW]
[ROW][C]41[/C][C]0.002013[/C][C]0.017[/C][C]0.493257[/C][/ROW]
[ROW][C]42[/C][C]0.058925[/C][C]0.4965[/C][C]0.310535[/C][/ROW]
[ROW][C]43[/C][C]0.00318[/C][C]0.0268[/C][C]0.489348[/C][/ROW]
[ROW][C]44[/C][C]-0.103899[/C][C]-0.8755[/C][C]0.192136[/C][/ROW]
[ROW][C]45[/C][C]-0.145433[/C][C]-1.2254[/C][C]0.112229[/C][/ROW]
[ROW][C]46[/C][C]-0.070087[/C][C]-0.5906[/C][C]0.278345[/C][/ROW]
[ROW][C]47[/C][C]0.115909[/C][C]0.9767[/C][C]0.166025[/C][/ROW]
[ROW][C]48[/C][C]0.342384[/C][C]2.885[/C][C]0.00259[/C][/ROW]
[/TABLE]
Source: https://freestatistics.org/blog/index.php?pk=164221&T=1

Globally Unique Identifier (entire table): ba.freestatistics.org/blog/index.php?pk=164221&T=1

As an alternative you can also use a QR Code:  

The GUIDs for individual cells are displayed in the table below:

Autocorrelation Function
Time lag kACF(k)T-STATP-value
10.3074232.59040.005813
2-0.211632-1.78320.03941
3-0.379093-3.19430.001046
4-0.272503-2.29620.012311
5-0.003648-0.03070.487783
60.1562551.31660.096099
70.0272290.22940.409595
8-0.208681-1.75840.041496
9-0.317395-2.67440.004642
10-0.207677-1.74990.042227
110.2497262.10420.01945
120.792946.68140
130.2385612.01020.024108
14-0.198483-1.67250.049418
15-0.30201-2.54480.006555
16-0.225662-1.90150.03065
170.0182280.15360.439185
180.1126740.94940.172816
190.0295830.24930.401936
20-0.16829-1.4180.080277
21-0.263662-2.22170.014748
22-0.177773-1.49790.069291
230.1980261.66860.049801
240.6077245.12081e-06
250.1756511.48010.07164
26-0.151753-1.27870.102585
27-0.245535-2.06890.021098
28-0.167266-1.40940.08154
290.0176430.14870.441121
300.0914990.7710.221636
310.0211390.17810.429569
32-0.128339-1.08140.141588
33-0.200438-1.68890.047811
34-0.124842-1.05190.148198
350.1580751.3320.093566
360.4723343.988.2e-05
370.1485011.25130.107468
38-0.099357-0.83720.202646
39-0.178501-1.50410.068499
40-0.133757-1.12710.131756
410.0020130.0170.493257
420.0589250.49650.310535
430.003180.02680.489348
44-0.103899-0.87550.192136
45-0.145433-1.22540.112229
46-0.070087-0.59060.278345
470.1159090.97670.166025
480.3423842.8850.00259


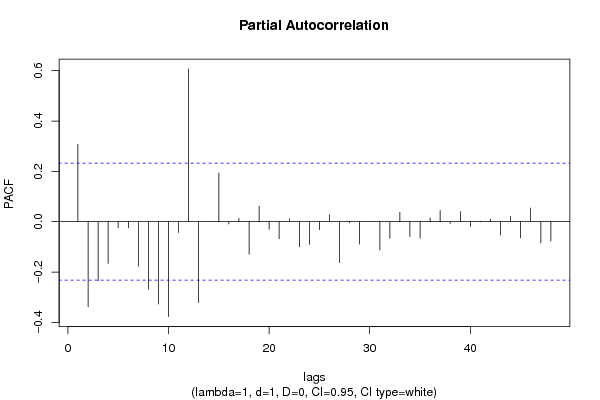
Partial Autocorrelation Function
Time lag kPACF(k)T-STATP-value
10.3074232.59040.005813
2-0.338094-2.84880.002868
3-0.23454-1.97630.026005
4-0.165793-1.3970.083382
5-0.023814-0.20070.42077
6-0.023736-0.20.421024
7-0.176504-1.48720.070689
8-0.268588-2.26320.013342
9-0.327295-2.75780.003696
10-0.37731-3.17930.001094
11-0.043068-0.36290.358879
120.6069255.1141e-06
13-0.321108-2.70570.004264
14-8.8e-05-7e-040.499706
150.1922981.62030.054797
16-0.008735-0.07360.470766
170.0135110.11380.454842
18-0.129024-1.08720.140318
190.0619250.52180.30172
20-0.030071-0.25340.400352
21-0.067947-0.57250.284385
220.0118690.10.460311
23-0.09988-0.84160.201417
24-0.090774-0.76490.223439
25-0.031572-0.2660.395492
260.0276320.23280.408281
27-0.162264-1.36730.087928
28-0.004315-0.03640.485548
29-0.08882-0.74840.228342
30-0.00018-0.00150.499396
31-0.112135-0.94490.173965
32-0.065547-0.55230.291235
330.0371020.31260.37774
34-0.059011-0.49720.310281
35-0.065185-0.54930.292276
360.014150.11920.452716
370.0442860.37320.35507
38-0.007125-0.060.476146
390.0398830.33610.368907
40-0.018833-0.15870.43718
410.0016050.01350.494624
420.0098690.08320.466981
43-0.052894-0.44570.328588
440.0216180.18220.42799
45-0.064238-0.54130.295006
460.0540150.45510.325201
47-0.083721-0.70540.241422
48-0.076792-0.64710.259841

\begin{tabular}{lllllllll}
\hline
Partial Autocorrelation Function \tabularnewline
Time lag k & PACF(k) & T-STAT & P-value \tabularnewline
1 & 0.307423 & 2.5904 & 0.005813 \tabularnewline
2 & -0.338094 & -2.8488 & 0.002868 \tabularnewline
3 & -0.23454 & -1.9763 & 0.026005 \tabularnewline
4 & -0.165793 & -1.397 & 0.083382 \tabularnewline
5 & -0.023814 & -0.2007 & 0.42077 \tabularnewline
6 & -0.023736 & -0.2 & 0.421024 \tabularnewline
7 & -0.176504 & -1.4872 & 0.070689 \tabularnewline
8 & -0.268588 & -2.2632 & 0.013342 \tabularnewline
9 & -0.327295 & -2.7578 & 0.003696 \tabularnewline
10 & -0.37731 & -3.1793 & 0.001094 \tabularnewline
11 & -0.043068 & -0.3629 & 0.358879 \tabularnewline
12 & 0.606925 & 5.114 & 1e-06 \tabularnewline
13 & -0.321108 & -2.7057 & 0.004264 \tabularnewline
14 & -8.8e-05 & -7e-04 & 0.499706 \tabularnewline
15 & 0.192298 & 1.6203 & 0.054797 \tabularnewline
16 & -0.008735 & -0.0736 & 0.470766 \tabularnewline
17 & 0.013511 & 0.1138 & 0.454842 \tabularnewline
18 & -0.129024 & -1.0872 & 0.140318 \tabularnewline
19 & 0.061925 & 0.5218 & 0.30172 \tabularnewline
20 & -0.030071 & -0.2534 & 0.400352 \tabularnewline
21 & -0.067947 & -0.5725 & 0.284385 \tabularnewline
22 & 0.011869 & 0.1 & 0.460311 \tabularnewline
23 & -0.09988 & -0.8416 & 0.201417 \tabularnewline
24 & -0.090774 & -0.7649 & 0.223439 \tabularnewline
25 & -0.031572 & -0.266 & 0.395492 \tabularnewline
26 & 0.027632 & 0.2328 & 0.408281 \tabularnewline
27 & -0.162264 & -1.3673 & 0.087928 \tabularnewline
28 & -0.004315 & -0.0364 & 0.485548 \tabularnewline
29 & -0.08882 & -0.7484 & 0.228342 \tabularnewline
30 & -0.00018 & -0.0015 & 0.499396 \tabularnewline
31 & -0.112135 & -0.9449 & 0.173965 \tabularnewline
32 & -0.065547 & -0.5523 & 0.291235 \tabularnewline
33 & 0.037102 & 0.3126 & 0.37774 \tabularnewline
34 & -0.059011 & -0.4972 & 0.310281 \tabularnewline
35 & -0.065185 & -0.5493 & 0.292276 \tabularnewline
36 & 0.01415 & 0.1192 & 0.452716 \tabularnewline
37 & 0.044286 & 0.3732 & 0.35507 \tabularnewline
38 & -0.007125 & -0.06 & 0.476146 \tabularnewline
39 & 0.039883 & 0.3361 & 0.368907 \tabularnewline
40 & -0.018833 & -0.1587 & 0.43718 \tabularnewline
41 & 0.001605 & 0.0135 & 0.494624 \tabularnewline
42 & 0.009869 & 0.0832 & 0.466981 \tabularnewline
43 & -0.052894 & -0.4457 & 0.328588 \tabularnewline
44 & 0.021618 & 0.1822 & 0.42799 \tabularnewline
45 & -0.064238 & -0.5413 & 0.295006 \tabularnewline
46 & 0.054015 & 0.4551 & 0.325201 \tabularnewline
47 & -0.083721 & -0.7054 & 0.241422 \tabularnewline
48 & -0.076792 & -0.6471 & 0.259841 \tabularnewline
\hline
\end{tabular}
%Source: https://freestatistics.org/blog/index.php?pk=164221&T=2

[TABLE]
[ROW][C]Partial Autocorrelation Function[/C][/ROW]
[ROW][C]Time lag k[/C][C]PACF(k)[/C][C]T-STAT[/C][C]P-value[/C][/ROW]
[ROW][C]1[/C][C]0.307423[/C][C]2.5904[/C][C]0.005813[/C][/ROW]
[ROW][C]2[/C][C]-0.338094[/C][C]-2.8488[/C][C]0.002868[/C][/ROW]
[ROW][C]3[/C][C]-0.23454[/C][C]-1.9763[/C][C]0.026005[/C][/ROW]
[ROW][C]4[/C][C]-0.165793[/C][C]-1.397[/C][C]0.083382[/C][/ROW]
[ROW][C]5[/C][C]-0.023814[/C][C]-0.2007[/C][C]0.42077[/C][/ROW]
[ROW][C]6[/C][C]-0.023736[/C][C]-0.2[/C][C]0.421024[/C][/ROW]
[ROW][C]7[/C][C]-0.176504[/C][C]-1.4872[/C][C]0.070689[/C][/ROW]
[ROW][C]8[/C][C]-0.268588[/C][C]-2.2632[/C][C]0.013342[/C][/ROW]
[ROW][C]9[/C][C]-0.327295[/C][C]-2.7578[/C][C]0.003696[/C][/ROW]
[ROW][C]10[/C][C]-0.37731[/C][C]-3.1793[/C][C]0.001094[/C][/ROW]
[ROW][C]11[/C][C]-0.043068[/C][C]-0.3629[/C][C]0.358879[/C][/ROW]
[ROW][C]12[/C][C]0.606925[/C][C]5.114[/C][C]1e-06[/C][/ROW]
[ROW][C]13[/C][C]-0.321108[/C][C]-2.7057[/C][C]0.004264[/C][/ROW]
[ROW][C]14[/C][C]-8.8e-05[/C][C]-7e-04[/C][C]0.499706[/C][/ROW]
[ROW][C]15[/C][C]0.192298[/C][C]1.6203[/C][C]0.054797[/C][/ROW]
[ROW][C]16[/C][C]-0.008735[/C][C]-0.0736[/C][C]0.470766[/C][/ROW]
[ROW][C]17[/C][C]0.013511[/C][C]0.1138[/C][C]0.454842[/C][/ROW]
[ROW][C]18[/C][C]-0.129024[/C][C]-1.0872[/C][C]0.140318[/C][/ROW]
[ROW][C]19[/C][C]0.061925[/C][C]0.5218[/C][C]0.30172[/C][/ROW]
[ROW][C]20[/C][C]-0.030071[/C][C]-0.2534[/C][C]0.400352[/C][/ROW]
[ROW][C]21[/C][C]-0.067947[/C][C]-0.5725[/C][C]0.284385[/C][/ROW]
[ROW][C]22[/C][C]0.011869[/C][C]0.1[/C][C]0.460311[/C][/ROW]
[ROW][C]23[/C][C]-0.09988[/C][C]-0.8416[/C][C]0.201417[/C][/ROW]
[ROW][C]24[/C][C]-0.090774[/C][C]-0.7649[/C][C]0.223439[/C][/ROW]
[ROW][C]25[/C][C]-0.031572[/C][C]-0.266[/C][C]0.395492[/C][/ROW]
[ROW][C]26[/C][C]0.027632[/C][C]0.2328[/C][C]0.408281[/C][/ROW]
[ROW][C]27[/C][C]-0.162264[/C][C]-1.3673[/C][C]0.087928[/C][/ROW]
[ROW][C]28[/C][C]-0.004315[/C][C]-0.0364[/C][C]0.485548[/C][/ROW]
[ROW][C]29[/C][C]-0.08882[/C][C]-0.7484[/C][C]0.228342[/C][/ROW]
[ROW][C]30[/C][C]-0.00018[/C][C]-0.0015[/C][C]0.499396[/C][/ROW]
[ROW][C]31[/C][C]-0.112135[/C][C]-0.9449[/C][C]0.173965[/C][/ROW]
[ROW][C]32[/C][C]-0.065547[/C][C]-0.5523[/C][C]0.291235[/C][/ROW]
[ROW][C]33[/C][C]0.037102[/C][C]0.3126[/C][C]0.37774[/C][/ROW]
[ROW][C]34[/C][C]-0.059011[/C][C]-0.4972[/C][C]0.310281[/C][/ROW]
[ROW][C]35[/C][C]-0.065185[/C][C]-0.5493[/C][C]0.292276[/C][/ROW]
[ROW][C]36[/C][C]0.01415[/C][C]0.1192[/C][C]0.452716[/C][/ROW]
[ROW][C]37[/C][C]0.044286[/C][C]0.3732[/C][C]0.35507[/C][/ROW]
[ROW][C]38[/C][C]-0.007125[/C][C]-0.06[/C][C]0.476146[/C][/ROW]
[ROW][C]39[/C][C]0.039883[/C][C]0.3361[/C][C]0.368907[/C][/ROW]
[ROW][C]40[/C][C]-0.018833[/C][C]-0.1587[/C][C]0.43718[/C][/ROW]
[ROW][C]41[/C][C]0.001605[/C][C]0.0135[/C][C]0.494624[/C][/ROW]
[ROW][C]42[/C][C]0.009869[/C][C]0.0832[/C][C]0.466981[/C][/ROW]
[ROW][C]43[/C][C]-0.052894[/C][C]-0.4457[/C][C]0.328588[/C][/ROW]
[ROW][C]44[/C][C]0.021618[/C][C]0.1822[/C][C]0.42799[/C][/ROW]
[ROW][C]45[/C][C]-0.064238[/C][C]-0.5413[/C][C]0.295006[/C][/ROW]
[ROW][C]46[/C][C]0.054015[/C][C]0.4551[/C][C]0.325201[/C][/ROW]
[ROW][C]47[/C][C]-0.083721[/C][C]-0.7054[/C][C]0.241422[/C][/ROW]
[ROW][C]48[/C][C]-0.076792[/C][C]-0.6471[/C][C]0.259841[/C][/ROW]
[/TABLE]
Source: https://freestatistics.org/blog/index.php?pk=164221&T=2

Globally Unique Identifier (entire table): ba.freestatistics.org/blog/index.php?pk=164221&T=2

As an alternative you can also use a QR Code:  

The GUIDs for individual cells are displayed in the table below:

Partial Autocorrelation Function
Time lag kPACF(k)T-STATP-value
10.3074232.59040.005813
2-0.338094-2.84880.002868
3-0.23454-1.97630.026005
4-0.165793-1.3970.083382
5-0.023814-0.20070.42077
6-0.023736-0.20.421024
7-0.176504-1.48720.070689
8-0.268588-2.26320.013342
9-0.327295-2.75780.003696
10-0.37731-3.17930.001094
11-0.043068-0.36290.358879
120.6069255.1141e-06
13-0.321108-2.70570.004264
14-8.8e-05-7e-040.499706
150.1922981.62030.054797
16-0.008735-0.07360.470766
170.0135110.11380.454842
18-0.129024-1.08720.140318
190.0619250.52180.30172
20-0.030071-0.25340.400352
21-0.067947-0.57250.284385
220.0118690.10.460311
23-0.09988-0.84160.201417
24-0.090774-0.76490.223439
25-0.031572-0.2660.395492
260.0276320.23280.408281
27-0.162264-1.36730.087928
28-0.004315-0.03640.485548
29-0.08882-0.74840.228342
30-0.00018-0.00150.499396
31-0.112135-0.94490.173965
32-0.065547-0.55230.291235
330.0371020.31260.37774
34-0.059011-0.49720.310281
35-0.065185-0.54930.292276
360.014150.11920.452716
370.0442860.37320.35507
38-0.007125-0.060.476146
390.0398830.33610.368907
40-0.018833-0.15870.43718
410.0016050.01350.494624
420.0098690.08320.466981
43-0.052894-0.44570.328588
440.0216180.18220.42799
45-0.064238-0.54130.295006
460.0540150.45510.325201
47-0.083721-0.70540.241422
48-0.076792-0.64710.259841


Parameters (Session):
par1 = 48 ; par2 = 1 ; par3 = 1 ; par4 = 0 ; par5 = 12 ; par6 = White Noise ; par7 = 0.95 ;
Parameters (R input):
par1 = 48 ; par2 = 1 ; par3 = 1 ; par4 = 0 ; par5 = 12 ; par6 = White Noise ; par7 = 0.95 ; par8 = ;
R code (references can be found in the software module):
if (par1 == 'Default') {
par1 = 10*log10(length(x))
} else {
par1 <- as.numeric(par1)
}
par2 <- as.numeric(par2)
par3 <- as.numeric(par3)
par4 <- as.numeric(par4)
par5 <- as.numeric(par5)
if (par6 == 'White Noise') par6 <- 'white' else par6 <- 'ma'
par7 <- as.numeric(par7)
if (par8 != '') par8 <- as.numeric(par8)
ox <- x
if (par8 == '') {
if (par2 == 0) {
x <- log(x)
} else {
x <- (x ^ par2 - 1) / par2
}
} else {
x <- log(x,base=par8)
}
if (par3 > 0) x <- diff(x,lag=1,difference=par3)
if (par4 > 0) x <- diff(x,lag=par5,difference=par4)
bitmap(file='picts.png')
op <- par(mfrow=c(2,1))
plot(ox,type='l',main='Original Time Series',xlab='time',ylab='value')
if (par8=='') {
mytitle <- paste('Working Time Series (lambda=',par2,', d=',par3,', D=',par4,')',sep='')
mysub <- paste('(lambda=',par2,', d=',par3,', D=',par4,', CI=', par7, ', CI type=',par6,')',sep='')
} else {
mytitle <- paste('Working Time Series (base=',par8,', d=',par3,', D=',par4,')',sep='')
mysub <- paste('(base=',par8,', d=',par3,', D=',par4,', CI=', par7, ', CI type=',par6,')',sep='')
}
plot(x,type='l', main=mytitle,xlab='time',ylab='value')
par(op)
dev.off()
bitmap(file='pic1.png')
racf <- acf(x, par1, main='Autocorrelation', xlab='time lag', ylab='ACF', ci.type=par6, ci=par7, sub=mysub)
dev.off()
bitmap(file='pic2.png')
rpacf <- pacf(x,par1,main='Partial Autocorrelation',xlab='lags',ylab='PACF',sub=mysub)
dev.off()
(myacf <- c(racf$acf))
(mypacf <- c(rpacf$acf))
lengthx <- length(x)
sqrtn <- sqrt(lengthx)
load(file='createtable')
a<-table.start()
a<-table.row.start(a)
a<-table.element(a,'Autocorrelation Function',4,TRUE)
a<-table.row.end(a)
a<-table.row.start(a)
a<-table.element(a,'Time lag k',header=TRUE)
a<-table.element(a,hyperlink('basics.htm','ACF(k)','click here for more information about the Autocorrelation Function'),header=TRUE)
a<-table.element(a,'T-STAT',header=TRUE)
a<-table.element(a,'P-value',header=TRUE)
a<-table.row.end(a)
for (i in 2:(par1+1)) {
a<-table.row.start(a)
a<-table.element(a,i-1,header=TRUE)
a<-table.element(a,round(myacf[i],6))
mytstat <- myacf[i]*sqrtn
a<-table.element(a,round(mytstat,4))
a<-table.element(a,round(1-pt(abs(mytstat),lengthx),6))
a<-table.row.end(a)
}
a<-table.end(a)
table.save(a,file='mytable.tab')
a<-table.start()
a<-table.row.start(a)
a<-table.element(a,'Partial Autocorrelation Function',4,TRUE)
a<-table.row.end(a)
a<-table.row.start(a)
a<-table.element(a,'Time lag k',header=TRUE)
a<-table.element(a,hyperlink('basics.htm','PACF(k)','click here for more information about the Partial Autocorrelation Function'),header=TRUE)
a<-table.element(a,'T-STAT',header=TRUE)
a<-table.element(a,'P-value',header=TRUE)
a<-table.row.end(a)
for (i in 1:par1) {
a<-table.row.start(a)
a<-table.element(a,i,header=TRUE)
a<-table.element(a,round(mypacf[i],6))
mytstat <- mypacf[i]*sqrtn
a<-table.element(a,round(mytstat,4))
a<-table.element(a,round(1-pt(abs(mytstat),lengthx),6))
a<-table.row.end(a)
}
a<-table.end(a)
table.save(a,file='mytable1.tab')