Free Statistics

of Irreproducible Research!

Author's title

Author*Unverified author*
R Software Modulerwasp_smp.wasp
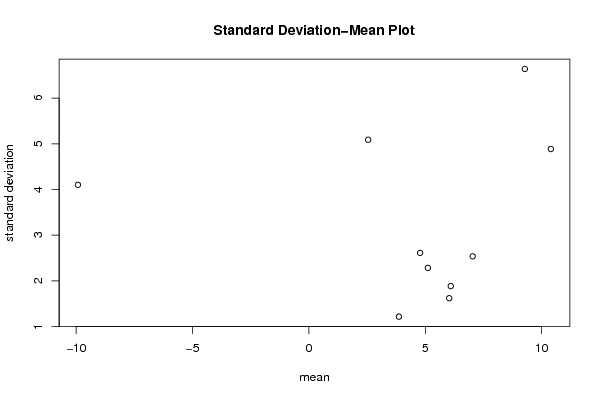
Title produced by softwareStandard Deviation-Mean Plot
Date of computationWed, 02 May 2012 16:26:52 -0400
Cite this page as followsStatistical Computations at FreeStatistics.org, Office for Research Development and Education, URL https://freestatistics.org/blog/index.php?v=date/2012/May/02/t1335990469qrtc2a5zyn2ekz5.htm/, Retrieved Wed, 08 May 2024 00:07:25 +0000
Statistical Computations at FreeStatistics.org, Office for Research Development and Education, URL https://freestatistics.org/blog/index.php?pk=166012, Retrieved Wed, 08 May 2024 00:07:25 +0000
QR Codes:

Original text written by user:
IsPrivate?No (this computation is public)
User-defined keywordsKDGP2W83
Estimated Impact72
Family? (F = Feedback message, R = changed R code, M = changed R Module, P = changed Parameters, D = changed Data)
-       [Standard Deviation-Mean Plot] [KDGP2W83] [2012-05-02 20:26:52] [d77480184cff5133157c4adeb3391928] [Current]
Feedback Forum

Post a new message
Dataseries X:
3.9
5.9
5.7
3.6
4.9
5.3
8.7
6.8
8.9
9.6
11.2
9.9
9.3
9.2
9.4
12.7
13.6
16.1
14.8
14.1
13.2
8.7
4.9
-1.3
-3.9
-6
-6.6
-8.7
-11.6
-14.6
-12.9
-13.8
-14.1
-13.2
-10.4
-3.3
1
3.1
4.5
1.9
3.9
7
5.6
8.1
6.1
8
6.5
5.6
4.8
5.1
7.8
10.3
8.6
6.8
4.9
5.4
5.5
4.7
4.2
5
5
6
2.9
3.6
5.1
2.9
4.7
3
5
2.6
3.2
2.4
3.2
2.6
2.4
2.1
2.7
4.4
4.3
4.2
5.5
8.8
10.1
7
5.7
5.2
5.5
7.3
5.9
7.1
6.9
6.7
4.7
6.7
8.5
2.1
-0.9
-4.7
4.8
2.6
1.7
-1.8
0.2
1.9
3.2
3.1
4.2
16.2
18.3
21.6
12.6
9.8
10.6
13
9.7
7.9
3.3
3.4
0.4
0.7
1.4
3.8
4
8
6
5.8
3.9
6.4
11


Summary of computational transaction
Raw Inputview raw input (R code)
Raw Outputview raw output of R engine
Computing time1 seconds
R Server'Gertrude Mary Cox' @ cox.wessa.net

\begin{tabular}{lllllllll}
\hline
Summary of computational transaction \tabularnewline
Raw Input & view raw input (R code)  \tabularnewline
Raw Output & view raw output of R engine  \tabularnewline
Computing time & 1 seconds \tabularnewline
R Server & 'Gertrude Mary Cox' @ cox.wessa.net \tabularnewline
\hline
\end{tabular}
%Source: https://freestatistics.org/blog/index.php?pk=166012&T=0

[TABLE]
[ROW][C]Summary of computational transaction[/C][/ROW]
[ROW][C]Raw Input[/C][C]view raw input (R code) [/C][/ROW]
[ROW][C]Raw Output[/C][C]view raw output of R engine [/C][/ROW]
[ROW][C]Computing time[/C][C]1 seconds[/C][/ROW]
[ROW][C]R Server[/C][C]'Gertrude Mary Cox' @ cox.wessa.net[/C][/ROW]
[/TABLE]
Source: https://freestatistics.org/blog/index.php?pk=166012&T=0

Globally Unique Identifier (entire table): ba.freestatistics.org/blog/index.php?pk=166012&T=0

As an alternative you can also use a QR Code:  

The GUIDs for individual cells are displayed in the table below:

Summary of computational transaction
Raw Inputview raw input (R code)
Raw Outputview raw output of R engine
Computing time1 seconds
R Server'Gertrude Mary Cox' @ cox.wessa.net


Standard Deviation-Mean Plot
SectionMeanStandard DeviationRange
17.033333333333332.535326169919527.6
210.39166666666674.8858717159011117.4
3-9.9254.1016903389168311.3
45.108333333333332.282924095155697.1
56.091666666666671.883641701759146.1
63.866666666666671.214558156348033.6
74.7752.611904564593718
86.0251.618711608881366.4
92.541666666666675.0891075004872120.9
109.2756.6394311092551821.2

\begin{tabular}{lllllllll}
\hline
Standard Deviation-Mean Plot \tabularnewline
Section & Mean & Standard Deviation & Range \tabularnewline
1 & 7.03333333333333 & 2.53532616991952 & 7.6 \tabularnewline
2 & 10.3916666666667 & 4.88587171590111 & 17.4 \tabularnewline
3 & -9.925 & 4.10169033891683 & 11.3 \tabularnewline
4 & 5.10833333333333 & 2.28292409515569 & 7.1 \tabularnewline
5 & 6.09166666666667 & 1.88364170175914 & 6.1 \tabularnewline
6 & 3.86666666666667 & 1.21455815634803 & 3.6 \tabularnewline
7 & 4.775 & 2.61190456459371 & 8 \tabularnewline
8 & 6.025 & 1.61871160888136 & 6.4 \tabularnewline
9 & 2.54166666666667 & 5.08910750048721 & 20.9 \tabularnewline
10 & 9.275 & 6.63943110925518 & 21.2 \tabularnewline
\hline
\end{tabular}
%Source: https://freestatistics.org/blog/index.php?pk=166012&T=1

[TABLE]
[ROW][C]Standard Deviation-Mean Plot[/C][/ROW]
[ROW][C]Section[/C][C]Mean[/C][C]Standard Deviation[/C][C]Range[/C][/ROW]
[ROW][C]1[/C][C]7.03333333333333[/C][C]2.53532616991952[/C][C]7.6[/C][/ROW]
[ROW][C]2[/C][C]10.3916666666667[/C][C]4.88587171590111[/C][C]17.4[/C][/ROW]
[ROW][C]3[/C][C]-9.925[/C][C]4.10169033891683[/C][C]11.3[/C][/ROW]
[ROW][C]4[/C][C]5.10833333333333[/C][C]2.28292409515569[/C][C]7.1[/C][/ROW]
[ROW][C]5[/C][C]6.09166666666667[/C][C]1.88364170175914[/C][C]6.1[/C][/ROW]
[ROW][C]6[/C][C]3.86666666666667[/C][C]1.21455815634803[/C][C]3.6[/C][/ROW]
[ROW][C]7[/C][C]4.775[/C][C]2.61190456459371[/C][C]8[/C][/ROW]
[ROW][C]8[/C][C]6.025[/C][C]1.61871160888136[/C][C]6.4[/C][/ROW]
[ROW][C]9[/C][C]2.54166666666667[/C][C]5.08910750048721[/C][C]20.9[/C][/ROW]
[ROW][C]10[/C][C]9.275[/C][C]6.63943110925518[/C][C]21.2[/C][/ROW]
[/TABLE]
Source: https://freestatistics.org/blog/index.php?pk=166012&T=1

Globally Unique Identifier (entire table): ba.freestatistics.org/blog/index.php?pk=166012&T=1

As an alternative you can also use a QR Code:  

The GUIDs for individual cells are displayed in the table below:

Standard Deviation-Mean Plot
SectionMeanStandard DeviationRange
17.033333333333332.535326169919527.6
210.39166666666674.8858717159011117.4
3-9.9254.1016903389168311.3
45.108333333333332.282924095155697.1
56.091666666666671.883641701759146.1
63.866666666666671.214558156348033.6
74.7752.611904564593718
86.0251.618711608881366.4
92.541666666666675.0891075004872120.9
109.2756.6394311092551821.2


Regression: S.E.(k) = alpha + beta * Mean(k)
alpha3.2224290954087
beta0.0141396386675927
S.D.0.112933249925393
T-STAT0.12520350452089
p-value0.903451549733271

\begin{tabular}{lllllllll}
\hline
Regression: S.E.(k) = alpha + beta * Mean(k) \tabularnewline
alpha & 3.2224290954087 \tabularnewline
beta & 0.0141396386675927 \tabularnewline
S.D. & 0.112933249925393 \tabularnewline
T-STAT & 0.12520350452089 \tabularnewline
p-value & 0.903451549733271 \tabularnewline
\hline
\end{tabular}
%Source: https://freestatistics.org/blog/index.php?pk=166012&T=2

[TABLE]
[ROW][C]Regression: S.E.(k) = alpha + beta * Mean(k)[/C][/ROW]
[ROW][C]alpha[/C][C]3.2224290954087[/C][/ROW]
[ROW][C]beta[/C][C]0.0141396386675927[/C][/ROW]
[ROW][C]S.D.[/C][C]0.112933249925393[/C][/ROW]
[ROW][C]T-STAT[/C][C]0.12520350452089[/C][/ROW]
[ROW][C]p-value[/C][C]0.903451549733271[/C][/ROW]
[/TABLE]
Source: https://freestatistics.org/blog/index.php?pk=166012&T=2

Globally Unique Identifier (entire table): ba.freestatistics.org/blog/index.php?pk=166012&T=2

As an alternative you can also use a QR Code:  

The GUIDs for individual cells are displayed in the table below:

Regression: S.E.(k) = alpha + beta * Mean(k)
alpha3.2224290954087
beta0.0141396386675927
S.D.0.112933249925393
T-STAT0.12520350452089
p-value0.903451549733271


Regression: ln S.E.(k) = alpha + beta * ln Mean(k)
alpha0.374155569316829
beta0.369466057087679
S.D.0.480627769245404
T-STAT0.768715585592878
p-value0.467200326640808
Lambda0.630533942912321

\begin{tabular}{lllllllll}
\hline
Regression: ln S.E.(k) = alpha + beta * ln Mean(k) \tabularnewline
alpha & 0.374155569316829 \tabularnewline
beta & 0.369466057087679 \tabularnewline
S.D. & 0.480627769245404 \tabularnewline
T-STAT & 0.768715585592878 \tabularnewline
p-value & 0.467200326640808 \tabularnewline
Lambda & 0.630533942912321 \tabularnewline
\hline
\end{tabular}
%Source: https://freestatistics.org/blog/index.php?pk=166012&T=3

[TABLE]
[ROW][C]Regression: ln S.E.(k) = alpha + beta * ln Mean(k)[/C][/ROW]
[ROW][C]alpha[/C][C]0.374155569316829[/C][/ROW]
[ROW][C]beta[/C][C]0.369466057087679[/C][/ROW]
[ROW][C]S.D.[/C][C]0.480627769245404[/C][/ROW]
[ROW][C]T-STAT[/C][C]0.768715585592878[/C][/ROW]
[ROW][C]p-value[/C][C]0.467200326640808[/C][/ROW]
[ROW][C]Lambda[/C][C]0.630533942912321[/C][/ROW]
[/TABLE]
Source: https://freestatistics.org/blog/index.php?pk=166012&T=3

Globally Unique Identifier (entire table): ba.freestatistics.org/blog/index.php?pk=166012&T=3

As an alternative you can also use a QR Code:  

The GUIDs for individual cells are displayed in the table below:

Regression: ln S.E.(k) = alpha + beta * ln Mean(k)
alpha0.374155569316829
beta0.369466057087679
S.D.0.480627769245404
T-STAT0.768715585592878
p-value0.467200326640808
Lambda0.630533942912321


Parameters (Session):
par1 = 12 ;
Parameters (R input):
par1 = 12 ;
R code (references can be found in the software module):
par1 <- as.numeric(par1)
(n <- length(x))
(np <- floor(n / par1))
arr <- array(NA,dim=c(par1,np))
j <- 0
k <- 1
for (i in 1:(np*par1))
{
j = j + 1
arr[j,k] <- x[i]
if (j == par1) {
j = 0
k=k+1
}
}
arr
arr.mean <- array(NA,dim=np)
arr.sd <- array(NA,dim=np)
arr.range <- array(NA,dim=np)
for (j in 1:np)
{
arr.mean[j] <- mean(arr[,j],na.rm=TRUE)
arr.sd[j] <- sd(arr[,j],na.rm=TRUE)
arr.range[j] <- max(arr[,j],na.rm=TRUE) - min(arr[,j],na.rm=TRUE)
}
arr.mean
arr.sd
arr.range
(lm1 <- lm(arr.sd~arr.mean))
(lnlm1 <- lm(log(arr.sd)~log(arr.mean)))
(lm2 <- lm(arr.range~arr.mean))
bitmap(file='test1.png')
plot(arr.mean,arr.sd,main='Standard Deviation-Mean Plot',xlab='mean',ylab='standard deviation')
dev.off()
bitmap(file='test2.png')
plot(arr.mean,arr.range,main='Range-Mean Plot',xlab='mean',ylab='range')
dev.off()
load(file='createtable')
a<-table.start()
a<-table.row.start(a)
a<-table.element(a,'Standard Deviation-Mean Plot',4,TRUE)
a<-table.row.end(a)
a<-table.row.start(a)
a<-table.element(a,'Section',header=TRUE)
a<-table.element(a,'Mean',header=TRUE)
a<-table.element(a,'Standard Deviation',header=TRUE)
a<-table.element(a,'Range',header=TRUE)
a<-table.row.end(a)
for (j in 1:np) {
a<-table.row.start(a)
a<-table.element(a,j,header=TRUE)
a<-table.element(a,arr.mean[j])
a<-table.element(a,arr.sd[j] )
a<-table.element(a,arr.range[j] )
a<-table.row.end(a)
}
a<-table.end(a)
table.save(a,file='mytable.tab')
a<-table.start()
a<-table.row.start(a)
a<-table.element(a,'Regression: S.E.(k) = alpha + beta * Mean(k)',2,TRUE)
a<-table.row.end(a)
a<-table.row.start(a)
a<-table.element(a,'alpha',header=TRUE)
a<-table.element(a,lm1$coefficients[[1]])
a<-table.row.end(a)
a<-table.row.start(a)
a<-table.element(a,'beta',header=TRUE)
a<-table.element(a,lm1$coefficients[[2]])
a<-table.row.end(a)
a<-table.row.start(a)
a<-table.element(a,'S.D.',header=TRUE)
a<-table.element(a,summary(lm1)$coefficients[2,2])
a<-table.row.end(a)
a<-table.row.start(a)
a<-table.element(a,'T-STAT',header=TRUE)
a<-table.element(a,summary(lm1)$coefficients[2,3])
a<-table.row.end(a)
a<-table.row.start(a)
a<-table.element(a,'p-value',header=TRUE)
a<-table.element(a,summary(lm1)$coefficients[2,4])
a<-table.row.end(a)
a<-table.end(a)
table.save(a,file='mytable1.tab')
a<-table.start()
a<-table.row.start(a)
a<-table.element(a,'Regression: ln S.E.(k) = alpha + beta * ln Mean(k)',2,TRUE)
a<-table.row.end(a)
a<-table.row.start(a)
a<-table.element(a,'alpha',header=TRUE)
a<-table.element(a,lnlm1$coefficients[[1]])
a<-table.row.end(a)
a<-table.row.start(a)
a<-table.element(a,'beta',header=TRUE)
a<-table.element(a,lnlm1$coefficients[[2]])
a<-table.row.end(a)
a<-table.row.start(a)
a<-table.element(a,'S.D.',header=TRUE)
a<-table.element(a,summary(lnlm1)$coefficients[2,2])
a<-table.row.end(a)
a<-table.row.start(a)
a<-table.element(a,'T-STAT',header=TRUE)
a<-table.element(a,summary(lnlm1)$coefficients[2,3])
a<-table.row.end(a)
a<-table.row.start(a)
a<-table.element(a,'p-value',header=TRUE)
a<-table.element(a,summary(lnlm1)$coefficients[2,4])
a<-table.row.end(a)
a<-table.row.start(a)
a<-table.element(a,'Lambda',header=TRUE)
a<-table.element(a,1-lnlm1$coefficients[[2]])
a<-table.row.end(a)
a<-table.end(a)
table.save(a,file='mytable2.tab')