Free Statistics

of Irreproducible Research!

Author's title

Author*Unverified author*
R Software Modulerwasp_multipleregression.wasp
Title produced by softwareMultiple Regression
Date of computationMon, 07 May 2012 20:52:59 -0400
Cite this page as followsStatistical Computations at FreeStatistics.org, Office for Research Development and Education, URL https://freestatistics.org/blog/index.php?v=date/2012/May/07/t1336438743okw67q5m5gst7co.htm/, Retrieved Fri, 03 May 2024 14:09:42 +0000
Statistical Computations at FreeStatistics.org, Office for Research Development and Education, URL https://freestatistics.org/blog/index.php?pk=166318, Retrieved Fri, 03 May 2024 14:09:42 +0000
QR Codes:

Original text written by user:
IsPrivate?No (this computation is public)
User-defined keywords
Estimated Impact126
Family? (F = Feedback message, R = changed R code, M = changed R Module, P = changed Parameters, D = changed Data)
-     [Multiple Regression] [15th bird enterin...] [2012-03-06 03:20:16] [74be16979710d4c4e7c6647856088456]
-    D  [Multiple Regression] [Reduced model ] [2012-03-06 15:35:32] [74be16979710d4c4e7c6647856088456]
-    D    [Multiple Regression] [Chimney swift ent...] [2012-03-07 21:49:25] [74be16979710d4c4e7c6647856088456]
- R  D        [Multiple Regression] [Chimney Swift Roo...] [2012-05-08 00:52:59] [d41d8cd98f00b204e9800998ecf8427e] [Current]
Feedback Forum

Post a new message
Dataseries X:
1225	1210	40786	48.00	19.00
1214	1209	40787	38.00	18.30
1205	1207	40788	37.00	18.90
1196	1206	40789	48.00	20.60
1209	1204	40790	81.00	20.00
1192	1203	40791	72.00	12.00
1196	1201	40792	58.00	11.76
1174	1199	40793	93.00	15.60
1183	1198	40794	86.00	15.60
1210	1196	40795	68.00	15.80
1210	1195	40796	68.00	17.80
1218	1193	40797	68.00	16.70
1219	1191	41164	59.00	17.20
1215	1190	41165	43.00	15.60
1206	1188	41166	59.00	14.40
1202	1187	41167	31.00	-0.60
1195	1185	41168	49.00	5.60
1203	1183	41169	52.00	10.08
1194	1182	41170	75.00	16.10
1170	1185	41171	90.00	16.70
1189	1179	41172	86.00	18.30
1199	1177	41173	87.00	20.60
1196	1175	41174	47.00	11.10
1189	1174	41175	70.00	11.70
1185	1170	41177	61.00	14.40
1192	1169	41178	48.00	9.40
1188	1167	41179	67.00	12.20
1176	1166	41180	74.00	12.20
1177	1162	41182	47.00	2.80
1166	1161	41183	65.00	3.90
1176	1159	40818	28.00	-2.20
1181	1158	40819	30.00	5.00
1176	1156	40820	67.00	13.30
1177	1155	40821	32.00	7.80


Summary of computational transaction
Raw Inputview raw input (R code)
Raw Outputview raw output of R engine
Computing time4 seconds
R Server'Gwilym Jenkins' @ jenkins.wessa.net

\begin{tabular}{lllllllll}
\hline
Summary of computational transaction \tabularnewline
Raw Input & view raw input (R code)  \tabularnewline
Raw Output & view raw output of R engine  \tabularnewline
Computing time & 4 seconds \tabularnewline
R Server & 'Gwilym Jenkins' @ jenkins.wessa.net \tabularnewline
\hline
\end{tabular}
%Source: https://freestatistics.org/blog/index.php?pk=166318&T=0

[TABLE]
[ROW][C]Summary of computational transaction[/C][/ROW]
[ROW][C]Raw Input[/C][C]view raw input (R code) [/C][/ROW]
[ROW][C]Raw Output[/C][C]view raw output of R engine [/C][/ROW]
[ROW][C]Computing time[/C][C]4 seconds[/C][/ROW]
[ROW][C]R Server[/C][C]'Gwilym Jenkins' @ jenkins.wessa.net[/C][/ROW]
[/TABLE]
Source: https://freestatistics.org/blog/index.php?pk=166318&T=0

Globally Unique Identifier (entire table): ba.freestatistics.org/blog/index.php?pk=166318&T=0

As an alternative you can also use a QR Code:  

The GUIDs for individual cells are displayed in the table below:

Summary of computational transaction
Raw Inputview raw input (R code)
Raw Outputview raw output of R engine
Computing time4 seconds
R Server'Gwilym Jenkins' @ jenkins.wessa.net


Multiple Linear Regression - Estimated Regression Equation
TimIN[t] = -262.050387124644 + 0.533838453356457Sunset[t] + 0.0203959280203797Date[t] -0.453922028780611Humidity[t] + 1.19679108229863Dewpoint[t] + e[t]

\begin{tabular}{lllllllll}
\hline
Multiple Linear Regression - Estimated Regression Equation \tabularnewline
TimIN[t] =  -262.050387124644 +  0.533838453356457Sunset[t] +  0.0203959280203797Date[t] -0.453922028780611Humidity[t] +  1.19679108229863Dewpoint[t]  + e[t] \tabularnewline
\hline
\end{tabular}
%Source: https://freestatistics.org/blog/index.php?pk=166318&T=1

[TABLE]
[ROW][C]Multiple Linear Regression - Estimated Regression Equation[/C][/ROW]
[ROW][C]TimIN[t] =  -262.050387124644 +  0.533838453356457Sunset[t] +  0.0203959280203797Date[t] -0.453922028780611Humidity[t] +  1.19679108229863Dewpoint[t]  + e[t][/C][/ROW]
[/TABLE]
Source: https://freestatistics.org/blog/index.php?pk=166318&T=1

Globally Unique Identifier (entire table): ba.freestatistics.org/blog/index.php?pk=166318&T=1

As an alternative you can also use a QR Code:  

The GUIDs for individual cells are displayed in the table below:

Multiple Linear Regression - Estimated Regression Equation
TimIN[t] = -262.050387124644 + 0.533838453356457Sunset[t] + 0.0203959280203797Date[t] -0.453922028780611Humidity[t] + 1.19679108229863Dewpoint[t] + e[t]


Multiple Linear Regression - Ordinary Least Squares
VariableParameterS.D.T-STATH0: parameter = 02-tail p-value1-tail p-value
(Intercept)-262.050387124644493.105884-0.53140.5991690.299585
Sunset0.5338384533564570.1383943.85740.0005880.000294
Date0.02039592802037970.0100562.02820.0518140.025907
Humidity-0.4539220287806110.111542-4.06950.0003310.000166
Dewpoint1.196791082298630.4251252.81520.0086730.004336

\begin{tabular}{lllllllll}
\hline
Multiple Linear Regression - Ordinary Least Squares \tabularnewline
Variable & Parameter & S.D. & T-STATH0: parameter = 0 & 2-tail p-value & 1-tail p-value \tabularnewline
(Intercept) & -262.050387124644 & 493.105884 & -0.5314 & 0.599169 & 0.299585 \tabularnewline
Sunset & 0.533838453356457 & 0.138394 & 3.8574 & 0.000588 & 0.000294 \tabularnewline
Date & 0.0203959280203797 & 0.010056 & 2.0282 & 0.051814 & 0.025907 \tabularnewline
Humidity & -0.453922028780611 & 0.111542 & -4.0695 & 0.000331 & 0.000166 \tabularnewline
Dewpoint & 1.19679108229863 & 0.425125 & 2.8152 & 0.008673 & 0.004336 \tabularnewline
\hline
\end{tabular}
%Source: https://freestatistics.org/blog/index.php?pk=166318&T=2

[TABLE]
[ROW][C]Multiple Linear Regression - Ordinary Least Squares[/C][/ROW]
[ROW][C]Variable[/C][C]Parameter[/C][C]S.D.[/C][C]T-STATH0: parameter = 0[/C][C]2-tail p-value[/C][C]1-tail p-value[/C][/ROW]
[ROW][C](Intercept)[/C][C]-262.050387124644[/C][C]493.105884[/C][C]-0.5314[/C][C]0.599169[/C][C]0.299585[/C][/ROW]
[ROW][C]Sunset[/C][C]0.533838453356457[/C][C]0.138394[/C][C]3.8574[/C][C]0.000588[/C][C]0.000294[/C][/ROW]
[ROW][C]Date[/C][C]0.0203959280203797[/C][C]0.010056[/C][C]2.0282[/C][C]0.051814[/C][C]0.025907[/C][/ROW]
[ROW][C]Humidity[/C][C]-0.453922028780611[/C][C]0.111542[/C][C]-4.0695[/C][C]0.000331[/C][C]0.000166[/C][/ROW]
[ROW][C]Dewpoint[/C][C]1.19679108229863[/C][C]0.425125[/C][C]2.8152[/C][C]0.008673[/C][C]0.004336[/C][/ROW]
[/TABLE]
Source: https://freestatistics.org/blog/index.php?pk=166318&T=2

Globally Unique Identifier (entire table): ba.freestatistics.org/blog/index.php?pk=166318&T=2

As an alternative you can also use a QR Code:  

The GUIDs for individual cells are displayed in the table below:

Multiple Linear Regression - Ordinary Least Squares
VariableParameterS.D.T-STATH0: parameter = 02-tail p-value1-tail p-value
(Intercept)-262.050387124644493.105884-0.53140.5991690.299585
Sunset0.5338384533564570.1383943.85740.0005880.000294
Date0.02039592802037970.0100562.02820.0518140.025907
Humidity-0.4539220287806110.111542-4.06950.0003310.000166
Dewpoint1.196791082298630.4251252.81520.0086730.004336


Multiple Linear Regression - Regression Statistics
Multiple R0.813780190055558
R-squared0.662238197726861
Adjusted R-squared0.615650362930565
F-TEST (value)14.2148309880142
F-TEST (DF numerator)4
F-TEST (DF denominator)29
p-value1.54974100674554e-06
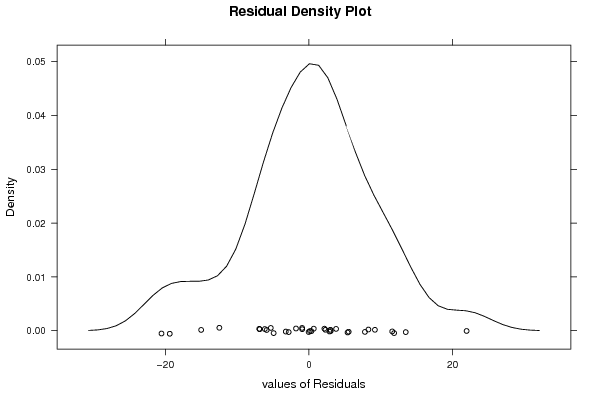
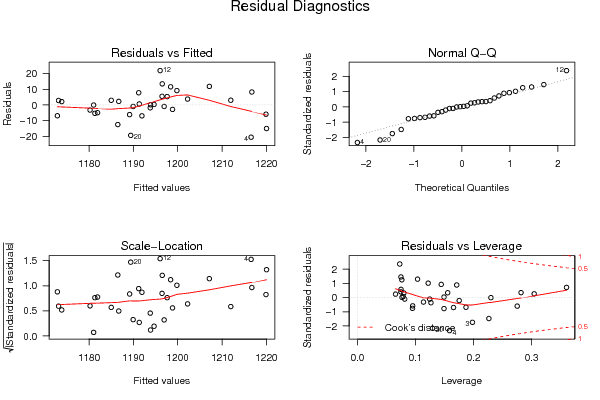
Multiple Linear Regression - Residual Statistics
Residual Standard Deviation9.62953512885713
Sum Squared Residuals2689.11045713891

\begin{tabular}{lllllllll}
\hline
Multiple Linear Regression - Regression Statistics \tabularnewline
Multiple R & 0.813780190055558 \tabularnewline
R-squared & 0.662238197726861 \tabularnewline
Adjusted R-squared & 0.615650362930565 \tabularnewline
F-TEST (value) & 14.2148309880142 \tabularnewline
F-TEST (DF numerator) & 4 \tabularnewline
F-TEST (DF denominator) & 29 \tabularnewline
p-value & 1.54974100674554e-06 \tabularnewline
Multiple Linear Regression - Residual Statistics \tabularnewline
Residual Standard Deviation & 9.62953512885713 \tabularnewline
Sum Squared Residuals & 2689.11045713891 \tabularnewline
\hline
\end{tabular}
%Source: https://freestatistics.org/blog/index.php?pk=166318&T=3

[TABLE]
[ROW][C]Multiple Linear Regression - Regression Statistics[/C][/ROW]
[ROW][C]Multiple R[/C][C]0.813780190055558[/C][/ROW]
[ROW][C]R-squared[/C][C]0.662238197726861[/C][/ROW]
[ROW][C]Adjusted R-squared[/C][C]0.615650362930565[/C][/ROW]
[ROW][C]F-TEST (value)[/C][C]14.2148309880142[/C][/ROW]
[ROW][C]F-TEST (DF numerator)[/C][C]4[/C][/ROW]
[ROW][C]F-TEST (DF denominator)[/C][C]29[/C][/ROW]
[ROW][C]p-value[/C][C]1.54974100674554e-06[/C][/ROW]
[ROW][C]Multiple Linear Regression - Residual Statistics[/C][/ROW]
[ROW][C]Residual Standard Deviation[/C][C]9.62953512885713[/C][/ROW]
[ROW][C]Sum Squared Residuals[/C][C]2689.11045713891[/C][/ROW]
[/TABLE]
Source: https://freestatistics.org/blog/index.php?pk=166318&T=3

Globally Unique Identifier (entire table): ba.freestatistics.org/blog/index.php?pk=166318&T=3

As an alternative you can also use a QR Code:  

The GUIDs for individual cells are displayed in the table below:

Multiple Linear Regression - Regression Statistics
Multiple R0.813780190055558
R-squared0.662238197726861
Adjusted R-squared0.615650362930565
F-TEST (value)14.2148309880142
F-TEST (DF numerator)4
F-TEST (DF denominator)29
p-value1.54974100674554e-06
Multiple Linear Regression - Residual Statistics
Residual Standard Deviation9.62953512885713
Sum Squared Residuals2689.11045713891


Multiple Linear Regression - Actuals, Interpolation, and Residuals
Time or IndexActualsInterpolationForecastResidualsPrediction Error
112251216.713234858088.28676514191853
212141219.90125886294-5.90125886294268
312051220.02597456241-15.0259745624099
411961216.55393456039-20.5539345603948
512091199.809151982569.19084801743708
611921193.80667905786-1.80667905786333
711961198.82707662235-2.82707662234768
811741186.48820239236-12.4882023923605
911831189.15221406849-6.15221406848868
1012101196.5148878243113.4851121756931
1112101198.3950274635711.604972536432
1212181196.0312762943521.968723705653
1312191207.1325987712911.8674012287117
1412151211.967042974763.03295702523582
1512061202.220860236823.77913976317648
1612021196.465368282875.53463171713484
1711951194.667595496370.332404503626893
1812031197.620172480045.37982751996342
1911941193.871205608180.128794391815823
2011701189.40236111394-19.4023611139439
2111891189.95028016863-0.950280168625818
2211991191.201696650447.79830334956049
2311961196.94178154113-0.941781541134477
2411891186.706207003222.29379299677648
2511851191.92827922707-6.92827922707024
2611921191.331867664390.668132335611023
2711881185.01108316932.98891683069902
2811761181.3201864425-5.32018644250062
2911771180.23168308858-3.23168308858497
3011661172.86411423573-6.86411423572638
3111761173.846613064442.15338693556414
3211811181.04222227409-0.0422222740886662
3311761173.133192213592.86680778640789
3411771181.92466974294-4.92466974293498

\begin{tabular}{lllllllll}
\hline
Multiple Linear Regression - Actuals, Interpolation, and Residuals \tabularnewline
Time or Index & Actuals & InterpolationForecast & ResidualsPrediction Error \tabularnewline
1 & 1225 & 1216.71323485808 & 8.28676514191853 \tabularnewline
2 & 1214 & 1219.90125886294 & -5.90125886294268 \tabularnewline
3 & 1205 & 1220.02597456241 & -15.0259745624099 \tabularnewline
4 & 1196 & 1216.55393456039 & -20.5539345603948 \tabularnewline
5 & 1209 & 1199.80915198256 & 9.19084801743708 \tabularnewline
6 & 1192 & 1193.80667905786 & -1.80667905786333 \tabularnewline
7 & 1196 & 1198.82707662235 & -2.82707662234768 \tabularnewline
8 & 1174 & 1186.48820239236 & -12.4882023923605 \tabularnewline
9 & 1183 & 1189.15221406849 & -6.15221406848868 \tabularnewline
10 & 1210 & 1196.51488782431 & 13.4851121756931 \tabularnewline
11 & 1210 & 1198.39502746357 & 11.604972536432 \tabularnewline
12 & 1218 & 1196.03127629435 & 21.968723705653 \tabularnewline
13 & 1219 & 1207.13259877129 & 11.8674012287117 \tabularnewline
14 & 1215 & 1211.96704297476 & 3.03295702523582 \tabularnewline
15 & 1206 & 1202.22086023682 & 3.77913976317648 \tabularnewline
16 & 1202 & 1196.46536828287 & 5.53463171713484 \tabularnewline
17 & 1195 & 1194.66759549637 & 0.332404503626893 \tabularnewline
18 & 1203 & 1197.62017248004 & 5.37982751996342 \tabularnewline
19 & 1194 & 1193.87120560818 & 0.128794391815823 \tabularnewline
20 & 1170 & 1189.40236111394 & -19.4023611139439 \tabularnewline
21 & 1189 & 1189.95028016863 & -0.950280168625818 \tabularnewline
22 & 1199 & 1191.20169665044 & 7.79830334956049 \tabularnewline
23 & 1196 & 1196.94178154113 & -0.941781541134477 \tabularnewline
24 & 1189 & 1186.70620700322 & 2.29379299677648 \tabularnewline
25 & 1185 & 1191.92827922707 & -6.92827922707024 \tabularnewline
26 & 1192 & 1191.33186766439 & 0.668132335611023 \tabularnewline
27 & 1188 & 1185.0110831693 & 2.98891683069902 \tabularnewline
28 & 1176 & 1181.3201864425 & -5.32018644250062 \tabularnewline
29 & 1177 & 1180.23168308858 & -3.23168308858497 \tabularnewline
30 & 1166 & 1172.86411423573 & -6.86411423572638 \tabularnewline
31 & 1176 & 1173.84661306444 & 2.15338693556414 \tabularnewline
32 & 1181 & 1181.04222227409 & -0.0422222740886662 \tabularnewline
33 & 1176 & 1173.13319221359 & 2.86680778640789 \tabularnewline
34 & 1177 & 1181.92466974294 & -4.92466974293498 \tabularnewline
\hline
\end{tabular}
%Source: https://freestatistics.org/blog/index.php?pk=166318&T=4

[TABLE]
[ROW][C]Multiple Linear Regression - Actuals, Interpolation, and Residuals[/C][/ROW]
[ROW][C]Time or Index[/C][C]Actuals[/C][C]InterpolationForecast[/C][C]ResidualsPrediction Error[/C][/ROW]
[ROW][C]1[/C][C]1225[/C][C]1216.71323485808[/C][C]8.28676514191853[/C][/ROW]
[ROW][C]2[/C][C]1214[/C][C]1219.90125886294[/C][C]-5.90125886294268[/C][/ROW]
[ROW][C]3[/C][C]1205[/C][C]1220.02597456241[/C][C]-15.0259745624099[/C][/ROW]
[ROW][C]4[/C][C]1196[/C][C]1216.55393456039[/C][C]-20.5539345603948[/C][/ROW]
[ROW][C]5[/C][C]1209[/C][C]1199.80915198256[/C][C]9.19084801743708[/C][/ROW]
[ROW][C]6[/C][C]1192[/C][C]1193.80667905786[/C][C]-1.80667905786333[/C][/ROW]
[ROW][C]7[/C][C]1196[/C][C]1198.82707662235[/C][C]-2.82707662234768[/C][/ROW]
[ROW][C]8[/C][C]1174[/C][C]1186.48820239236[/C][C]-12.4882023923605[/C][/ROW]
[ROW][C]9[/C][C]1183[/C][C]1189.15221406849[/C][C]-6.15221406848868[/C][/ROW]
[ROW][C]10[/C][C]1210[/C][C]1196.51488782431[/C][C]13.4851121756931[/C][/ROW]
[ROW][C]11[/C][C]1210[/C][C]1198.39502746357[/C][C]11.604972536432[/C][/ROW]
[ROW][C]12[/C][C]1218[/C][C]1196.03127629435[/C][C]21.968723705653[/C][/ROW]
[ROW][C]13[/C][C]1219[/C][C]1207.13259877129[/C][C]11.8674012287117[/C][/ROW]
[ROW][C]14[/C][C]1215[/C][C]1211.96704297476[/C][C]3.03295702523582[/C][/ROW]
[ROW][C]15[/C][C]1206[/C][C]1202.22086023682[/C][C]3.77913976317648[/C][/ROW]
[ROW][C]16[/C][C]1202[/C][C]1196.46536828287[/C][C]5.53463171713484[/C][/ROW]
[ROW][C]17[/C][C]1195[/C][C]1194.66759549637[/C][C]0.332404503626893[/C][/ROW]
[ROW][C]18[/C][C]1203[/C][C]1197.62017248004[/C][C]5.37982751996342[/C][/ROW]
[ROW][C]19[/C][C]1194[/C][C]1193.87120560818[/C][C]0.128794391815823[/C][/ROW]
[ROW][C]20[/C][C]1170[/C][C]1189.40236111394[/C][C]-19.4023611139439[/C][/ROW]
[ROW][C]21[/C][C]1189[/C][C]1189.95028016863[/C][C]-0.950280168625818[/C][/ROW]
[ROW][C]22[/C][C]1199[/C][C]1191.20169665044[/C][C]7.79830334956049[/C][/ROW]
[ROW][C]23[/C][C]1196[/C][C]1196.94178154113[/C][C]-0.941781541134477[/C][/ROW]
[ROW][C]24[/C][C]1189[/C][C]1186.70620700322[/C][C]2.29379299677648[/C][/ROW]
[ROW][C]25[/C][C]1185[/C][C]1191.92827922707[/C][C]-6.92827922707024[/C][/ROW]
[ROW][C]26[/C][C]1192[/C][C]1191.33186766439[/C][C]0.668132335611023[/C][/ROW]
[ROW][C]27[/C][C]1188[/C][C]1185.0110831693[/C][C]2.98891683069902[/C][/ROW]
[ROW][C]28[/C][C]1176[/C][C]1181.3201864425[/C][C]-5.32018644250062[/C][/ROW]
[ROW][C]29[/C][C]1177[/C][C]1180.23168308858[/C][C]-3.23168308858497[/C][/ROW]
[ROW][C]30[/C][C]1166[/C][C]1172.86411423573[/C][C]-6.86411423572638[/C][/ROW]
[ROW][C]31[/C][C]1176[/C][C]1173.84661306444[/C][C]2.15338693556414[/C][/ROW]
[ROW][C]32[/C][C]1181[/C][C]1181.04222227409[/C][C]-0.0422222740886662[/C][/ROW]
[ROW][C]33[/C][C]1176[/C][C]1173.13319221359[/C][C]2.86680778640789[/C][/ROW]
[ROW][C]34[/C][C]1177[/C][C]1181.92466974294[/C][C]-4.92466974293498[/C][/ROW]
[/TABLE]
Source: https://freestatistics.org/blog/index.php?pk=166318&T=4

Globally Unique Identifier (entire table): ba.freestatistics.org/blog/index.php?pk=166318&T=4

As an alternative you can also use a QR Code:  

The GUIDs for individual cells are displayed in the table below:

Multiple Linear Regression - Actuals, Interpolation, and Residuals
Time or IndexActualsInterpolationForecastResidualsPrediction Error
112251216.713234858088.28676514191853
212141219.90125886294-5.90125886294268
312051220.02597456241-15.0259745624099
411961216.55393456039-20.5539345603948
512091199.809151982569.19084801743708
611921193.80667905786-1.80667905786333
711961198.82707662235-2.82707662234768
811741186.48820239236-12.4882023923605
911831189.15221406849-6.15221406848868
1012101196.5148878243113.4851121756931
1112101198.3950274635711.604972536432
1212181196.0312762943521.968723705653
1312191207.1325987712911.8674012287117
1412151211.967042974763.03295702523582
1512061202.220860236823.77913976317648
1612021196.465368282875.53463171713484
1711951194.667595496370.332404503626893
1812031197.620172480045.37982751996342
1911941193.871205608180.128794391815823
2011701189.40236111394-19.4023611139439
2111891189.95028016863-0.950280168625818
2211991191.201696650447.79830334956049
2311961196.94178154113-0.941781541134477
2411891186.706207003222.29379299677648
2511851191.92827922707-6.92827922707024
2611921191.331867664390.668132335611023
2711881185.01108316932.98891683069902
2811761181.3201864425-5.32018644250062
2911771180.23168308858-3.23168308858497
3011661172.86411423573-6.86411423572638
3111761173.846613064442.15338693556414
3211811181.04222227409-0.0422222740886662
3311761173.133192213592.86680778640789
3411771181.92466974294-4.92466974293498


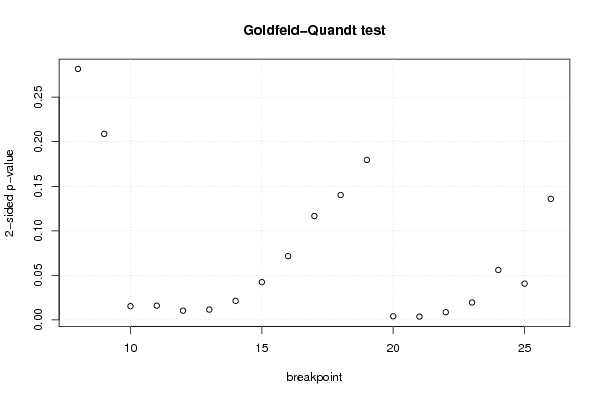
Goldfeld-Quandt test for Heteroskedasticity
p-valuesAlternative Hypothesis
breakpoint indexgreater2-sidedless
80.8591211791090510.2817576417818980.140878820890949
90.8955755872984550.2088488254030910.104424412701545
100.9923599834903670.0152800330192650.00764001650963249
110.9920629791648310.01587404167033810.00793702083516903
120.9948767656851820.01024646862963690.00512323431481843
130.9942520606085440.01149587878291280.00574793939145642
140.9893415468471410.02131690630571730.0106584531528586
150.9788468854284180.04230622914316450.0211531145715822
160.9642432428472310.07151351430553870.0357567571527694
170.9417177667289650.1165644665420710.0582822332710354
180.9299222255036280.1401555489927440.0700777744963722
190.9102156020640950.1795687958718090.0897843979359046
200.9980130280581590.003973943883682740.00198697194184137
210.9982216980691940.003556603861612480.00177830193080624
220.9957198658067350.008560268386529320.00428013419326466
230.9902575270004250.01948494599914940.00974247299957472
240.972021187980920.05595762403815980.0279788120190799
250.9796947587728310.04061048245433880.0203052412271694
260.932092353389130.1358152932217390.0679076466108696

\begin{tabular}{lllllllll}
\hline
Goldfeld-Quandt test for Heteroskedasticity \tabularnewline
p-values & Alternative Hypothesis \tabularnewline
breakpoint index & greater & 2-sided & less \tabularnewline
8 & 0.859121179109051 & 0.281757641781898 & 0.140878820890949 \tabularnewline
9 & 0.895575587298455 & 0.208848825403091 & 0.104424412701545 \tabularnewline
10 & 0.992359983490367 & 0.015280033019265 & 0.00764001650963249 \tabularnewline
11 & 0.992062979164831 & 0.0158740416703381 & 0.00793702083516903 \tabularnewline
12 & 0.994876765685182 & 0.0102464686296369 & 0.00512323431481843 \tabularnewline
13 & 0.994252060608544 & 0.0114958787829128 & 0.00574793939145642 \tabularnewline
14 & 0.989341546847141 & 0.0213169063057173 & 0.0106584531528586 \tabularnewline
15 & 0.978846885428418 & 0.0423062291431645 & 0.0211531145715822 \tabularnewline
16 & 0.964243242847231 & 0.0715135143055387 & 0.0357567571527694 \tabularnewline
17 & 0.941717766728965 & 0.116564466542071 & 0.0582822332710354 \tabularnewline
18 & 0.929922225503628 & 0.140155548992744 & 0.0700777744963722 \tabularnewline
19 & 0.910215602064095 & 0.179568795871809 & 0.0897843979359046 \tabularnewline
20 & 0.998013028058159 & 0.00397394388368274 & 0.00198697194184137 \tabularnewline
21 & 0.998221698069194 & 0.00355660386161248 & 0.00177830193080624 \tabularnewline
22 & 0.995719865806735 & 0.00856026838652932 & 0.00428013419326466 \tabularnewline
23 & 0.990257527000425 & 0.0194849459991494 & 0.00974247299957472 \tabularnewline
24 & 0.97202118798092 & 0.0559576240381598 & 0.0279788120190799 \tabularnewline
25 & 0.979694758772831 & 0.0406104824543388 & 0.0203052412271694 \tabularnewline
26 & 0.93209235338913 & 0.135815293221739 & 0.0679076466108696 \tabularnewline
\hline
\end{tabular}
%Source: https://freestatistics.org/blog/index.php?pk=166318&T=5

[TABLE]
[ROW][C]Goldfeld-Quandt test for Heteroskedasticity[/C][/ROW]
[ROW][C]p-values[/C][C]Alternative Hypothesis[/C][/ROW]
[ROW][C]breakpoint index[/C][C]greater[/C][C]2-sided[/C][C]less[/C][/ROW]
[ROW][C]8[/C][C]0.859121179109051[/C][C]0.281757641781898[/C][C]0.140878820890949[/C][/ROW]
[ROW][C]9[/C][C]0.895575587298455[/C][C]0.208848825403091[/C][C]0.104424412701545[/C][/ROW]
[ROW][C]10[/C][C]0.992359983490367[/C][C]0.015280033019265[/C][C]0.00764001650963249[/C][/ROW]
[ROW][C]11[/C][C]0.992062979164831[/C][C]0.0158740416703381[/C][C]0.00793702083516903[/C][/ROW]
[ROW][C]12[/C][C]0.994876765685182[/C][C]0.0102464686296369[/C][C]0.00512323431481843[/C][/ROW]
[ROW][C]13[/C][C]0.994252060608544[/C][C]0.0114958787829128[/C][C]0.00574793939145642[/C][/ROW]
[ROW][C]14[/C][C]0.989341546847141[/C][C]0.0213169063057173[/C][C]0.0106584531528586[/C][/ROW]
[ROW][C]15[/C][C]0.978846885428418[/C][C]0.0423062291431645[/C][C]0.0211531145715822[/C][/ROW]
[ROW][C]16[/C][C]0.964243242847231[/C][C]0.0715135143055387[/C][C]0.0357567571527694[/C][/ROW]
[ROW][C]17[/C][C]0.941717766728965[/C][C]0.116564466542071[/C][C]0.0582822332710354[/C][/ROW]
[ROW][C]18[/C][C]0.929922225503628[/C][C]0.140155548992744[/C][C]0.0700777744963722[/C][/ROW]
[ROW][C]19[/C][C]0.910215602064095[/C][C]0.179568795871809[/C][C]0.0897843979359046[/C][/ROW]
[ROW][C]20[/C][C]0.998013028058159[/C][C]0.00397394388368274[/C][C]0.00198697194184137[/C][/ROW]
[ROW][C]21[/C][C]0.998221698069194[/C][C]0.00355660386161248[/C][C]0.00177830193080624[/C][/ROW]
[ROW][C]22[/C][C]0.995719865806735[/C][C]0.00856026838652932[/C][C]0.00428013419326466[/C][/ROW]
[ROW][C]23[/C][C]0.990257527000425[/C][C]0.0194849459991494[/C][C]0.00974247299957472[/C][/ROW]
[ROW][C]24[/C][C]0.97202118798092[/C][C]0.0559576240381598[/C][C]0.0279788120190799[/C][/ROW]
[ROW][C]25[/C][C]0.979694758772831[/C][C]0.0406104824543388[/C][C]0.0203052412271694[/C][/ROW]
[ROW][C]26[/C][C]0.93209235338913[/C][C]0.135815293221739[/C][C]0.0679076466108696[/C][/ROW]
[/TABLE]
Source: https://freestatistics.org/blog/index.php?pk=166318&T=5

Globally Unique Identifier (entire table): ba.freestatistics.org/blog/index.php?pk=166318&T=5

As an alternative you can also use a QR Code:  

The GUIDs for individual cells are displayed in the table below:

Goldfeld-Quandt test for Heteroskedasticity
p-valuesAlternative Hypothesis
breakpoint indexgreater2-sidedless
80.8591211791090510.2817576417818980.140878820890949
90.8955755872984550.2088488254030910.104424412701545
100.9923599834903670.0152800330192650.00764001650963249
110.9920629791648310.01587404167033810.00793702083516903
120.9948767656851820.01024646862963690.00512323431481843
130.9942520606085440.01149587878291280.00574793939145642
140.9893415468471410.02131690630571730.0106584531528586
150.9788468854284180.04230622914316450.0211531145715822
160.9642432428472310.07151351430553870.0357567571527694
170.9417177667289650.1165644665420710.0582822332710354
180.9299222255036280.1401555489927440.0700777744963722
190.9102156020640950.1795687958718090.0897843979359046
200.9980130280581590.003973943883682740.00198697194184137
210.9982216980691940.003556603861612480.00177830193080624
220.9957198658067350.008560268386529320.00428013419326466
230.9902575270004250.01948494599914940.00974247299957472
240.972021187980920.05595762403815980.0279788120190799
250.9796947587728310.04061048245433880.0203052412271694
260.932092353389130.1358152932217390.0679076466108696


Meta Analysis of Goldfeld-Quandt test for Heteroskedasticity
Description# significant tests% significant testsOK/NOK
1% type I error level30.157894736842105NOK
5% type I error level110.578947368421053NOK
10% type I error level130.684210526315789NOK

\begin{tabular}{lllllllll}
\hline
Meta Analysis of Goldfeld-Quandt test for Heteroskedasticity \tabularnewline
Description & # significant tests & % significant tests & OK/NOK \tabularnewline
1% type I error level & 3 & 0.157894736842105 & NOK \tabularnewline
5% type I error level & 11 & 0.578947368421053 & NOK \tabularnewline
10% type I error level & 13 & 0.684210526315789 & NOK \tabularnewline
\hline
\end{tabular}
%Source: https://freestatistics.org/blog/index.php?pk=166318&T=6

[TABLE]
[ROW][C]Meta Analysis of Goldfeld-Quandt test for Heteroskedasticity[/C][/ROW]
[ROW][C]Description[/C][C]# significant tests[/C][C]% significant tests[/C][C]OK/NOK[/C][/ROW]
[ROW][C]1% type I error level[/C][C]3[/C][C]0.157894736842105[/C][C]NOK[/C][/ROW]
[ROW][C]5% type I error level[/C][C]11[/C][C]0.578947368421053[/C][C]NOK[/C][/ROW]
[ROW][C]10% type I error level[/C][C]13[/C][C]0.684210526315789[/C][C]NOK[/C][/ROW]
[/TABLE]
Source: https://freestatistics.org/blog/index.php?pk=166318&T=6

Globally Unique Identifier (entire table): ba.freestatistics.org/blog/index.php?pk=166318&T=6

As an alternative you can also use a QR Code:  

The GUIDs for individual cells are displayed in the table below:

Meta Analysis of Goldfeld-Quandt test for Heteroskedasticity
Description# significant tests% significant testsOK/NOK
1% type I error level30.157894736842105NOK
5% type I error level110.578947368421053NOK
10% type I error level130.684210526315789NOK


Parameters (Session):
par1 = 1 ; par2 = Do not include Seasonal Dummies ; par3 = No Linear Trend ;
Parameters (R input):
par1 = 1 ; par2 = Do not include Seasonal Dummies ; par3 = No Linear Trend ;
R code (references can be found in the software module):
library(lattice)
library(lmtest)
n25 <- 25 #minimum number of obs. for Goldfeld-Quandt test
par1 <- as.numeric(par1)
x <- t(y)
k <- length(x[1,])
n <- length(x[,1])
x1 <- cbind(x[,par1], x[,1:k!=par1])
mycolnames <- c(colnames(x)[par1], colnames(x)[1:k!=par1])
colnames(x1) <- mycolnames #colnames(x)[par1]
x <- x1
if (par3 == 'First Differences'){
x2 <- array(0, dim=c(n-1,k), dimnames=list(1:(n-1), paste('(1-B)',colnames(x),sep='')))
for (i in 1:n-1) {
for (j in 1:k) {
x2[i,j] <- x[i+1,j] - x[i,j]
}
}
x <- x2
}
if (par2 == 'Include Monthly Dummies'){
x2 <- array(0, dim=c(n,11), dimnames=list(1:n, paste('M', seq(1:11), sep ='')))
for (i in 1:11){
x2[seq(i,n,12),i] <- 1
}
x <- cbind(x, x2)
}
if (par2 == 'Include Quarterly Dummies'){
x2 <- array(0, dim=c(n,3), dimnames=list(1:n, paste('Q', seq(1:3), sep ='')))
for (i in 1:3){
x2[seq(i,n,4),i] <- 1
}
x <- cbind(x, x2)
}
k <- length(x[1,])
if (par3 == 'Linear Trend'){
x <- cbind(x, c(1:n))
colnames(x)[k+1] <- 't'
}
x
k <- length(x[1,])
df <- as.data.frame(x)
(mylm <- lm(df))
(mysum <- summary(mylm))
if (n > n25) {
kp3 <- k + 3
nmkm3 <- n - k - 3
gqarr <- array(NA, dim=c(nmkm3-kp3+1,3))
numgqtests <- 0
numsignificant1 <- 0
numsignificant5 <- 0
numsignificant10 <- 0
for (mypoint in kp3:nmkm3) {
j <- 0
numgqtests <- numgqtests + 1
for (myalt in c('greater', 'two.sided', 'less')) {
j <- j + 1
gqarr[mypoint-kp3+1,j] <- gqtest(mylm, point=mypoint, alternative=myalt)$p.value
}
if (gqarr[mypoint-kp3+1,2] < 0.01) numsignificant1 <- numsignificant1 + 1
if (gqarr[mypoint-kp3+1,2] < 0.05) numsignificant5 <- numsignificant5 + 1
if (gqarr[mypoint-kp3+1,2] < 0.10) numsignificant10 <- numsignificant10 + 1
}
gqarr
}
bitmap(file='test0.png')
plot(x[,1], type='l', main='Actuals and Interpolation', ylab='value of Actuals and Interpolation (dots)', xlab='time or index')
points(x[,1]-mysum$resid)
grid()
dev.off()
bitmap(file='test1.png')
plot(mysum$resid, type='b', pch=19, main='Residuals', ylab='value of Residuals', xlab='time or index')
grid()
dev.off()
bitmap(file='test2.png')
hist(mysum$resid, main='Residual Histogram', xlab='values of Residuals')
grid()
dev.off()
bitmap(file='test3.png')
densityplot(~mysum$resid,col='black',main='Residual Density Plot', xlab='values of Residuals')
dev.off()
bitmap(file='test4.png')
qqnorm(mysum$resid, main='Residual Normal Q-Q Plot')
qqline(mysum$resid)
grid()
dev.off()
(myerror <- as.ts(mysum$resid))
bitmap(file='test5.png')
dum <- cbind(lag(myerror,k=1),myerror)
dum
dum1 <- dum[2:length(myerror),]
dum1
z <- as.data.frame(dum1)
z
plot(z,main=paste('Residual Lag plot, lowess, and regression line'), ylab='values of Residuals', xlab='lagged values of Residuals')
lines(lowess(z))
abline(lm(z))
grid()
dev.off()
bitmap(file='test6.png')
acf(mysum$resid, lag.max=length(mysum$resid)/2, main='Residual Autocorrelation Function')
grid()
dev.off()
bitmap(file='test7.png')
pacf(mysum$resid, lag.max=length(mysum$resid)/2, main='Residual Partial Autocorrelation Function')
grid()
dev.off()
bitmap(file='test8.png')
opar <- par(mfrow = c(2,2), oma = c(0, 0, 1.1, 0))
plot(mylm, las = 1, sub='Residual Diagnostics')
par(opar)
dev.off()
if (n > n25) {
bitmap(file='test9.png')
plot(kp3:nmkm3,gqarr[,2], main='Goldfeld-Quandt test',ylab='2-sided p-value',xlab='breakpoint')
grid()
dev.off()
}
load(file='createtable')
a<-table.start()
a<-table.row.start(a)
a<-table.element(a, 'Multiple Linear Regression - Estimated Regression Equation', 1, TRUE)
a<-table.row.end(a)
myeq <- colnames(x)[1]
myeq <- paste(myeq, '[t] = ', sep='')
for (i in 1:k){
if (mysum$coefficients[i,1] > 0) myeq <- paste(myeq, '+', '')
myeq <- paste(myeq, mysum$coefficients[i,1], sep=' ')
if (rownames(mysum$coefficients)[i] != '(Intercept)') {
myeq <- paste(myeq, rownames(mysum$coefficients)[i], sep='')
if (rownames(mysum$coefficients)[i] != 't') myeq <- paste(myeq, '[t]', sep='')
}
}
myeq <- paste(myeq, ' + e[t]')
a<-table.row.start(a)
a<-table.element(a, myeq)
a<-table.row.end(a)
a<-table.end(a)
table.save(a,file='mytable1.tab')
a<-table.start()
a<-table.row.start(a)
a<-table.element(a,hyperlink('ols1.htm','Multiple Linear Regression - Ordinary Least Squares',''), 6, TRUE)
a<-table.row.end(a)
a<-table.row.start(a)
a<-table.element(a,'Variable',header=TRUE)
a<-table.element(a,'Parameter',header=TRUE)
a<-table.element(a,'S.D.',header=TRUE)
a<-table.element(a,'T-STAT
H0: parameter = 0',header=TRUE)
a<-table.element(a,'2-tail p-value',header=TRUE)
a<-table.element(a,'1-tail p-value',header=TRUE)
a<-table.row.end(a)
for (i in 1:k){
a<-table.row.start(a)
a<-table.element(a,rownames(mysum$coefficients)[i],header=TRUE)
a<-table.element(a,mysum$coefficients[i,1])
a<-table.element(a, round(mysum$coefficients[i,2],6))
a<-table.element(a, round(mysum$coefficients[i,3],4))
a<-table.element(a, round(mysum$coefficients[i,4],6))
a<-table.element(a, round(mysum$coefficients[i,4]/2,6))
a<-table.row.end(a)
}
a<-table.end(a)
table.save(a,file='mytable2.tab')
a<-table.start()
a<-table.row.start(a)
a<-table.element(a, 'Multiple Linear Regression - Regression Statistics', 2, TRUE)
a<-table.row.end(a)
a<-table.row.start(a)
a<-table.element(a, 'Multiple R',1,TRUE)
a<-table.element(a, sqrt(mysum$r.squared))
a<-table.row.end(a)
a<-table.row.start(a)
a<-table.element(a, 'R-squared',1,TRUE)
a<-table.element(a, mysum$r.squared)
a<-table.row.end(a)
a<-table.row.start(a)
a<-table.element(a, 'Adjusted R-squared',1,TRUE)
a<-table.element(a, mysum$adj.r.squared)
a<-table.row.end(a)
a<-table.row.start(a)
a<-table.element(a, 'F-TEST (value)',1,TRUE)
a<-table.element(a, mysum$fstatistic[1])
a<-table.row.end(a)
a<-table.row.start(a)
a<-table.element(a, 'F-TEST (DF numerator)',1,TRUE)
a<-table.element(a, mysum$fstatistic[2])
a<-table.row.end(a)
a<-table.row.start(a)
a<-table.element(a, 'F-TEST (DF denominator)',1,TRUE)
a<-table.element(a, mysum$fstatistic[3])
a<-table.row.end(a)
a<-table.row.start(a)
a<-table.element(a, 'p-value',1,TRUE)
a<-table.element(a, 1-pf(mysum$fstatistic[1],mysum$fstatistic[2],mysum$fstatistic[3]))
a<-table.row.end(a)
a<-table.row.start(a)
a<-table.element(a, 'Multiple Linear Regression - Residual Statistics', 2, TRUE)
a<-table.row.end(a)
a<-table.row.start(a)
a<-table.element(a, 'Residual Standard Deviation',1,TRUE)
a<-table.element(a, mysum$sigma)
a<-table.row.end(a)
a<-table.row.start(a)
a<-table.element(a, 'Sum Squared Residuals',1,TRUE)
a<-table.element(a, sum(myerror*myerror))
a<-table.row.end(a)
a<-table.end(a)
table.save(a,file='mytable3.tab')
a<-table.start()
a<-table.row.start(a)
a<-table.element(a, 'Multiple Linear Regression - Actuals, Interpolation, and Residuals', 4, TRUE)
a<-table.row.end(a)
a<-table.row.start(a)
a<-table.element(a, 'Time or Index', 1, TRUE)
a<-table.element(a, 'Actuals', 1, TRUE)
a<-table.element(a, 'Interpolation
Forecast', 1, TRUE)
a<-table.element(a, 'Residuals
Prediction Error', 1, TRUE)
a<-table.row.end(a)
for (i in 1:n) {
a<-table.row.start(a)
a<-table.element(a,i, 1, TRUE)
a<-table.element(a,x[i])
a<-table.element(a,x[i]-mysum$resid[i])
a<-table.element(a,mysum$resid[i])
a<-table.row.end(a)
}
a<-table.end(a)
table.save(a,file='mytable4.tab')
if (n > n25) {
a<-table.start()
a<-table.row.start(a)
a<-table.element(a,'Goldfeld-Quandt test for Heteroskedasticity',4,TRUE)
a<-table.row.end(a)
a<-table.row.start(a)
a<-table.element(a,'p-values',header=TRUE)
a<-table.element(a,'Alternative Hypothesis',3,header=TRUE)
a<-table.row.end(a)
a<-table.row.start(a)
a<-table.element(a,'breakpoint index',header=TRUE)
a<-table.element(a,'greater',header=TRUE)
a<-table.element(a,'2-sided',header=TRUE)
a<-table.element(a,'less',header=TRUE)
a<-table.row.end(a)
for (mypoint in kp3:nmkm3) {
a<-table.row.start(a)
a<-table.element(a,mypoint,header=TRUE)
a<-table.element(a,gqarr[mypoint-kp3+1,1])
a<-table.element(a,gqarr[mypoint-kp3+1,2])
a<-table.element(a,gqarr[mypoint-kp3+1,3])
a<-table.row.end(a)
}
a<-table.end(a)
table.save(a,file='mytable5.tab')
a<-table.start()
a<-table.row.start(a)
a<-table.element(a,'Meta Analysis of Goldfeld-Quandt test for Heteroskedasticity',4,TRUE)
a<-table.row.end(a)
a<-table.row.start(a)
a<-table.element(a,'Description',header=TRUE)
a<-table.element(a,'# significant tests',header=TRUE)
a<-table.element(a,'% significant tests',header=TRUE)
a<-table.element(a,'OK/NOK',header=TRUE)
a<-table.row.end(a)
a<-table.row.start(a)
a<-table.element(a,'1% type I error level',header=TRUE)
a<-table.element(a,numsignificant1)
a<-table.element(a,numsignificant1/numgqtests)
if (numsignificant1/numgqtests < 0.01) dum <- 'OK' else dum <- 'NOK'
a<-table.element(a,dum)
a<-table.row.end(a)
a<-table.row.start(a)
a<-table.element(a,'5% type I error level',header=TRUE)
a<-table.element(a,numsignificant5)
a<-table.element(a,numsignificant5/numgqtests)
if (numsignificant5/numgqtests < 0.05) dum <- 'OK' else dum <- 'NOK'
a<-table.element(a,dum)
a<-table.row.end(a)
a<-table.row.start(a)
a<-table.element(a,'10% type I error level',header=TRUE)
a<-table.element(a,numsignificant10)
a<-table.element(a,numsignificant10/numgqtests)
if (numsignificant10/numgqtests < 0.1) dum <- 'OK' else dum <- 'NOK'
a<-table.element(a,dum)
a<-table.row.end(a)
a<-table.end(a)
table.save(a,file='mytable6.tab')
}