Free Statistics

of Irreproducible Research!

Author's title

Author*Unverified author*
R Software Modulerwasp_exponentialsmoothing.wasp
Title produced by softwareExponential Smoothing
Date of computationWed, 16 May 2012 04:36:23 -0400
Cite this page as followsStatistical Computations at FreeStatistics.org, Office for Research Development and Education, URL https://freestatistics.org/blog/index.php?v=date/2012/May/16/t1337157649nmq9y35z0evuh0t.htm/, Retrieved Wed, 01 May 2024 20:58:20 +0000
Statistical Computations at FreeStatistics.org, Office for Research Development and Education, URL https://freestatistics.org/blog/index.php?pk=166493, Retrieved Wed, 01 May 2024 20:58:20 +0000
QR Codes:

Original text written by user:
IsPrivate?No (this computation is public)
User-defined keywords
Estimated Impact112
Family? (F = Feedback message, R = changed R code, M = changed R Module, P = changed Parameters, D = changed Data)
-       [Exponential Smoothing] [] [2012-05-16 08:36:23] [76c30f62b7052b57088120e90a652e05] [Current]
Feedback Forum

Post a new message
Dataseries X:
104,78
104,87
105,06
105,14
105,32
105,54
105,68
105,77
106,07
106,03
106,13
106,28
106,61
106,74
107,01
107,1
107,28
107,4
107,59
107,69
107,78
108,02
108
108,07
108,36
108,74
108,99
109,21
109,31
109,41
109,54
109,81
109,85
110,01
110,23
110,28
110,79
110,91
111,21
111,44
111,52
111,85
112,03
111,9
112,11
112,15
112,09
112,13
112,45
112,5
112,72
112,72
112,83
112,95
112,98
113,07
113,1
113,16
113,2
113,3
113,48
113,67
113,81
113,94
114,13
114,19
114,21
114,21
114,35
114,54
114,51
114,53


Summary of computational transaction
Raw Inputview raw input (R code)
Raw Outputview raw output of R engine
Computing time1 seconds
R Server'Gwilym Jenkins' @ jenkins.wessa.net

\begin{tabular}{lllllllll}
\hline
Summary of computational transaction \tabularnewline
Raw Input & view raw input (R code)  \tabularnewline
Raw Output & view raw output of R engine  \tabularnewline
Computing time & 1 seconds \tabularnewline
R Server & 'Gwilym Jenkins' @ jenkins.wessa.net \tabularnewline
\hline
\end{tabular}
%Source: https://freestatistics.org/blog/index.php?pk=166493&T=0

[TABLE]
[ROW][C]Summary of computational transaction[/C][/ROW]
[ROW][C]Raw Input[/C][C]view raw input (R code) [/C][/ROW]
[ROW][C]Raw Output[/C][C]view raw output of R engine [/C][/ROW]
[ROW][C]Computing time[/C][C]1 seconds[/C][/ROW]
[ROW][C]R Server[/C][C]'Gwilym Jenkins' @ jenkins.wessa.net[/C][/ROW]
[/TABLE]
Source: https://freestatistics.org/blog/index.php?pk=166493&T=0

Globally Unique Identifier (entire table): ba.freestatistics.org/blog/index.php?pk=166493&T=0

As an alternative you can also use a QR Code:  

The GUIDs for individual cells are displayed in the table below:

Summary of computational transaction
Raw Inputview raw input (R code)
Raw Outputview raw output of R engine
Computing time1 seconds
R Server'Gwilym Jenkins' @ jenkins.wessa.net


Estimated Parameters of Exponential Smoothing
ParameterValue
alpha0.819865360221212
beta0.0686375790750982
gamma0.350889833848575

\begin{tabular}{lllllllll}
\hline
Estimated Parameters of Exponential Smoothing \tabularnewline
Parameter & Value \tabularnewline
alpha & 0.819865360221212 \tabularnewline
beta & 0.0686375790750982 \tabularnewline
gamma & 0.350889833848575 \tabularnewline
\hline
\end{tabular}
%Source: https://freestatistics.org/blog/index.php?pk=166493&T=1

[TABLE]
[ROW][C]Estimated Parameters of Exponential Smoothing[/C][/ROW]
[ROW][C]Parameter[/C][C]Value[/C][/ROW]
[ROW][C]alpha[/C][C]0.819865360221212[/C][/ROW]
[ROW][C]beta[/C][C]0.0686375790750982[/C][/ROW]
[ROW][C]gamma[/C][C]0.350889833848575[/C][/ROW]
[/TABLE]
Source: https://freestatistics.org/blog/index.php?pk=166493&T=1

Globally Unique Identifier (entire table): ba.freestatistics.org/blog/index.php?pk=166493&T=1

As an alternative you can also use a QR Code:  

The GUIDs for individual cells are displayed in the table below:

Estimated Parameters of Exponential Smoothing
ParameterValue
alpha0.819865360221212
beta0.0686375790750982
gamma0.350889833848575


Interpolation Forecasts of Exponential Smoothing
tObservedFittedResiduals
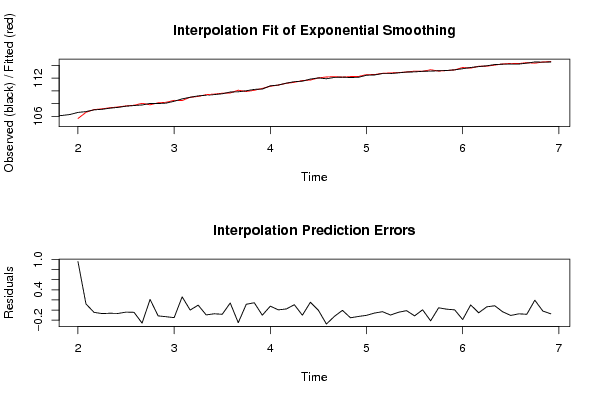
13106.61105.6512232905980.958776709401704
14106.74106.6197472254460.120252774554018
15107.01107.055894819076-0.0458948190755848
16107.1107.170324423863-0.0703244238633118
17107.28107.34410096862-0.0641009686203802
18107.4107.467706051517-0.0677060515167227
19107.59107.631212057026-0.041212057026371
20107.69107.735787087819-0.0457870878192637
21107.78108.039034606292-0.259034606291721
22108.02107.8091210682610.210878931738904
23108108.115923606757-0.11592360675742
24108.07108.202435295371-0.132435295370513
25108.36108.510642144692-0.150642144691531
26108.74108.4793419315510.260658068449217
27108.99108.990753179764-0.000753179764245715
28109.21109.1138409775790.0961590224213893
29109.31109.407065778747-0.0970657787465967
30109.41109.484122117323-0.0741221173232702
31109.54109.624387204228-0.084387204227653
32109.81109.6711904063490.138809593651033
33109.85110.100606595151-0.250606595151112
34110.01109.8960822550010.11391774499937
35110.23110.0860543234780.143945676522236
36110.28110.382524939277-0.102524939276947
37110.79110.7137313730080.0762686269919612
38110.91110.9068616715920.00313832840791406
39111.21111.1885237277950.0214762722050494
40111.44111.3351186349890.104881365011209
41111.52111.62292856219-0.102928562189931
42111.85111.6959457168860.154054283113908
43112.03112.034793502049-0.00479350204935258
44111.9112.177597139011-0.277597139011235
45112.11112.234205810038-0.124205810037935
46112.15112.156670688085-0.00667068808535021
47112.09112.243205475438-0.153205475438
48112.13112.25728263771-0.127282637709925
49112.45112.554908219789-0.10490821978928
50112.5112.560096100735-0.0600961007354641
51112.72112.752735685775-0.0327356857745968
52112.72112.818767358988-0.09876735898753
53112.83112.873629034488-0.0436290344876227
54112.95112.961995446027-0.0119954460267593
55112.98113.09580864802-0.115808648019609
56113.07113.0652485765090.00475142349100111
57113.1113.313826261771-0.213826261771459
58113.16113.1159860030150.0440139969852567
59113.2113.1834080074050.0165919925951385
60113.3113.2964845421960.00351545780361562
61113.48113.668271451998-0.188271451997622
62113.67113.5687642886540.101235711346035
63113.81113.865301460536-0.0553014605357447
64113.94113.8772865301610.0627134698386129
65114.13114.0457409824990.0842590175012816
66114.19114.225869660908-0.0358696609075082
67114.21114.317115775454-0.107115775454119
68114.21114.28536047673-0.0753604767299265
69114.35114.433990774309-0.0839907743090009
70114.54114.3457511714850.194248828514802
71114.51114.529922108299-0.0199221082987577
72114.53114.605490555855-0.0754905558546426

\begin{tabular}{lllllllll}
\hline
Interpolation Forecasts of Exponential Smoothing \tabularnewline
t & Observed & Fitted & Residuals \tabularnewline
13 & 106.61 & 105.651223290598 & 0.958776709401704 \tabularnewline
14 & 106.74 & 106.619747225446 & 0.120252774554018 \tabularnewline
15 & 107.01 & 107.055894819076 & -0.0458948190755848 \tabularnewline
16 & 107.1 & 107.170324423863 & -0.0703244238633118 \tabularnewline
17 & 107.28 & 107.34410096862 & -0.0641009686203802 \tabularnewline
18 & 107.4 & 107.467706051517 & -0.0677060515167227 \tabularnewline
19 & 107.59 & 107.631212057026 & -0.041212057026371 \tabularnewline
20 & 107.69 & 107.735787087819 & -0.0457870878192637 \tabularnewline
21 & 107.78 & 108.039034606292 & -0.259034606291721 \tabularnewline
22 & 108.02 & 107.809121068261 & 0.210878931738904 \tabularnewline
23 & 108 & 108.115923606757 & -0.11592360675742 \tabularnewline
24 & 108.07 & 108.202435295371 & -0.132435295370513 \tabularnewline
25 & 108.36 & 108.510642144692 & -0.150642144691531 \tabularnewline
26 & 108.74 & 108.479341931551 & 0.260658068449217 \tabularnewline
27 & 108.99 & 108.990753179764 & -0.000753179764245715 \tabularnewline
28 & 109.21 & 109.113840977579 & 0.0961590224213893 \tabularnewline
29 & 109.31 & 109.407065778747 & -0.0970657787465967 \tabularnewline
30 & 109.41 & 109.484122117323 & -0.0741221173232702 \tabularnewline
31 & 109.54 & 109.624387204228 & -0.084387204227653 \tabularnewline
32 & 109.81 & 109.671190406349 & 0.138809593651033 \tabularnewline
33 & 109.85 & 110.100606595151 & -0.250606595151112 \tabularnewline
34 & 110.01 & 109.896082255001 & 0.11391774499937 \tabularnewline
35 & 110.23 & 110.086054323478 & 0.143945676522236 \tabularnewline
36 & 110.28 & 110.382524939277 & -0.102524939276947 \tabularnewline
37 & 110.79 & 110.713731373008 & 0.0762686269919612 \tabularnewline
38 & 110.91 & 110.906861671592 & 0.00313832840791406 \tabularnewline
39 & 111.21 & 111.188523727795 & 0.0214762722050494 \tabularnewline
40 & 111.44 & 111.335118634989 & 0.104881365011209 \tabularnewline
41 & 111.52 & 111.62292856219 & -0.102928562189931 \tabularnewline
42 & 111.85 & 111.695945716886 & 0.154054283113908 \tabularnewline
43 & 112.03 & 112.034793502049 & -0.00479350204935258 \tabularnewline
44 & 111.9 & 112.177597139011 & -0.277597139011235 \tabularnewline
45 & 112.11 & 112.234205810038 & -0.124205810037935 \tabularnewline
46 & 112.15 & 112.156670688085 & -0.00667068808535021 \tabularnewline
47 & 112.09 & 112.243205475438 & -0.153205475438 \tabularnewline
48 & 112.13 & 112.25728263771 & -0.127282637709925 \tabularnewline
49 & 112.45 & 112.554908219789 & -0.10490821978928 \tabularnewline
50 & 112.5 & 112.560096100735 & -0.0600961007354641 \tabularnewline
51 & 112.72 & 112.752735685775 & -0.0327356857745968 \tabularnewline
52 & 112.72 & 112.818767358988 & -0.09876735898753 \tabularnewline
53 & 112.83 & 112.873629034488 & -0.0436290344876227 \tabularnewline
54 & 112.95 & 112.961995446027 & -0.0119954460267593 \tabularnewline
55 & 112.98 & 113.09580864802 & -0.115808648019609 \tabularnewline
56 & 113.07 & 113.065248576509 & 0.00475142349100111 \tabularnewline
57 & 113.1 & 113.313826261771 & -0.213826261771459 \tabularnewline
58 & 113.16 & 113.115986003015 & 0.0440139969852567 \tabularnewline
59 & 113.2 & 113.183408007405 & 0.0165919925951385 \tabularnewline
60 & 113.3 & 113.296484542196 & 0.00351545780361562 \tabularnewline
61 & 113.48 & 113.668271451998 & -0.188271451997622 \tabularnewline
62 & 113.67 & 113.568764288654 & 0.101235711346035 \tabularnewline
63 & 113.81 & 113.865301460536 & -0.0553014605357447 \tabularnewline
64 & 113.94 & 113.877286530161 & 0.0627134698386129 \tabularnewline
65 & 114.13 & 114.045740982499 & 0.0842590175012816 \tabularnewline
66 & 114.19 & 114.225869660908 & -0.0358696609075082 \tabularnewline
67 & 114.21 & 114.317115775454 & -0.107115775454119 \tabularnewline
68 & 114.21 & 114.28536047673 & -0.0753604767299265 \tabularnewline
69 & 114.35 & 114.433990774309 & -0.0839907743090009 \tabularnewline
70 & 114.54 & 114.345751171485 & 0.194248828514802 \tabularnewline
71 & 114.51 & 114.529922108299 & -0.0199221082987577 \tabularnewline
72 & 114.53 & 114.605490555855 & -0.0754905558546426 \tabularnewline
\hline
\end{tabular}
%Source: https://freestatistics.org/blog/index.php?pk=166493&T=2

[TABLE]
[ROW][C]Interpolation Forecasts of Exponential Smoothing[/C][/ROW]
[ROW][C]t[/C][C]Observed[/C][C]Fitted[/C][C]Residuals[/C][/ROW]
[ROW][C]13[/C][C]106.61[/C][C]105.651223290598[/C][C]0.958776709401704[/C][/ROW]
[ROW][C]14[/C][C]106.74[/C][C]106.619747225446[/C][C]0.120252774554018[/C][/ROW]
[ROW][C]15[/C][C]107.01[/C][C]107.055894819076[/C][C]-0.0458948190755848[/C][/ROW]
[ROW][C]16[/C][C]107.1[/C][C]107.170324423863[/C][C]-0.0703244238633118[/C][/ROW]
[ROW][C]17[/C][C]107.28[/C][C]107.34410096862[/C][C]-0.0641009686203802[/C][/ROW]
[ROW][C]18[/C][C]107.4[/C][C]107.467706051517[/C][C]-0.0677060515167227[/C][/ROW]
[ROW][C]19[/C][C]107.59[/C][C]107.631212057026[/C][C]-0.041212057026371[/C][/ROW]
[ROW][C]20[/C][C]107.69[/C][C]107.735787087819[/C][C]-0.0457870878192637[/C][/ROW]
[ROW][C]21[/C][C]107.78[/C][C]108.039034606292[/C][C]-0.259034606291721[/C][/ROW]
[ROW][C]22[/C][C]108.02[/C][C]107.809121068261[/C][C]0.210878931738904[/C][/ROW]
[ROW][C]23[/C][C]108[/C][C]108.115923606757[/C][C]-0.11592360675742[/C][/ROW]
[ROW][C]24[/C][C]108.07[/C][C]108.202435295371[/C][C]-0.132435295370513[/C][/ROW]
[ROW][C]25[/C][C]108.36[/C][C]108.510642144692[/C][C]-0.150642144691531[/C][/ROW]
[ROW][C]26[/C][C]108.74[/C][C]108.479341931551[/C][C]0.260658068449217[/C][/ROW]
[ROW][C]27[/C][C]108.99[/C][C]108.990753179764[/C][C]-0.000753179764245715[/C][/ROW]
[ROW][C]28[/C][C]109.21[/C][C]109.113840977579[/C][C]0.0961590224213893[/C][/ROW]
[ROW][C]29[/C][C]109.31[/C][C]109.407065778747[/C][C]-0.0970657787465967[/C][/ROW]
[ROW][C]30[/C][C]109.41[/C][C]109.484122117323[/C][C]-0.0741221173232702[/C][/ROW]
[ROW][C]31[/C][C]109.54[/C][C]109.624387204228[/C][C]-0.084387204227653[/C][/ROW]
[ROW][C]32[/C][C]109.81[/C][C]109.671190406349[/C][C]0.138809593651033[/C][/ROW]
[ROW][C]33[/C][C]109.85[/C][C]110.100606595151[/C][C]-0.250606595151112[/C][/ROW]
[ROW][C]34[/C][C]110.01[/C][C]109.896082255001[/C][C]0.11391774499937[/C][/ROW]
[ROW][C]35[/C][C]110.23[/C][C]110.086054323478[/C][C]0.143945676522236[/C][/ROW]
[ROW][C]36[/C][C]110.28[/C][C]110.382524939277[/C][C]-0.102524939276947[/C][/ROW]
[ROW][C]37[/C][C]110.79[/C][C]110.713731373008[/C][C]0.0762686269919612[/C][/ROW]
[ROW][C]38[/C][C]110.91[/C][C]110.906861671592[/C][C]0.00313832840791406[/C][/ROW]
[ROW][C]39[/C][C]111.21[/C][C]111.188523727795[/C][C]0.0214762722050494[/C][/ROW]
[ROW][C]40[/C][C]111.44[/C][C]111.335118634989[/C][C]0.104881365011209[/C][/ROW]
[ROW][C]41[/C][C]111.52[/C][C]111.62292856219[/C][C]-0.102928562189931[/C][/ROW]
[ROW][C]42[/C][C]111.85[/C][C]111.695945716886[/C][C]0.154054283113908[/C][/ROW]
[ROW][C]43[/C][C]112.03[/C][C]112.034793502049[/C][C]-0.00479350204935258[/C][/ROW]
[ROW][C]44[/C][C]111.9[/C][C]112.177597139011[/C][C]-0.277597139011235[/C][/ROW]
[ROW][C]45[/C][C]112.11[/C][C]112.234205810038[/C][C]-0.124205810037935[/C][/ROW]
[ROW][C]46[/C][C]112.15[/C][C]112.156670688085[/C][C]-0.00667068808535021[/C][/ROW]
[ROW][C]47[/C][C]112.09[/C][C]112.243205475438[/C][C]-0.153205475438[/C][/ROW]
[ROW][C]48[/C][C]112.13[/C][C]112.25728263771[/C][C]-0.127282637709925[/C][/ROW]
[ROW][C]49[/C][C]112.45[/C][C]112.554908219789[/C][C]-0.10490821978928[/C][/ROW]
[ROW][C]50[/C][C]112.5[/C][C]112.560096100735[/C][C]-0.0600961007354641[/C][/ROW]
[ROW][C]51[/C][C]112.72[/C][C]112.752735685775[/C][C]-0.0327356857745968[/C][/ROW]
[ROW][C]52[/C][C]112.72[/C][C]112.818767358988[/C][C]-0.09876735898753[/C][/ROW]
[ROW][C]53[/C][C]112.83[/C][C]112.873629034488[/C][C]-0.0436290344876227[/C][/ROW]
[ROW][C]54[/C][C]112.95[/C][C]112.961995446027[/C][C]-0.0119954460267593[/C][/ROW]
[ROW][C]55[/C][C]112.98[/C][C]113.09580864802[/C][C]-0.115808648019609[/C][/ROW]
[ROW][C]56[/C][C]113.07[/C][C]113.065248576509[/C][C]0.00475142349100111[/C][/ROW]
[ROW][C]57[/C][C]113.1[/C][C]113.313826261771[/C][C]-0.213826261771459[/C][/ROW]
[ROW][C]58[/C][C]113.16[/C][C]113.115986003015[/C][C]0.0440139969852567[/C][/ROW]
[ROW][C]59[/C][C]113.2[/C][C]113.183408007405[/C][C]0.0165919925951385[/C][/ROW]
[ROW][C]60[/C][C]113.3[/C][C]113.296484542196[/C][C]0.00351545780361562[/C][/ROW]
[ROW][C]61[/C][C]113.48[/C][C]113.668271451998[/C][C]-0.188271451997622[/C][/ROW]
[ROW][C]62[/C][C]113.67[/C][C]113.568764288654[/C][C]0.101235711346035[/C][/ROW]
[ROW][C]63[/C][C]113.81[/C][C]113.865301460536[/C][C]-0.0553014605357447[/C][/ROW]
[ROW][C]64[/C][C]113.94[/C][C]113.877286530161[/C][C]0.0627134698386129[/C][/ROW]
[ROW][C]65[/C][C]114.13[/C][C]114.045740982499[/C][C]0.0842590175012816[/C][/ROW]
[ROW][C]66[/C][C]114.19[/C][C]114.225869660908[/C][C]-0.0358696609075082[/C][/ROW]
[ROW][C]67[/C][C]114.21[/C][C]114.317115775454[/C][C]-0.107115775454119[/C][/ROW]
[ROW][C]68[/C][C]114.21[/C][C]114.28536047673[/C][C]-0.0753604767299265[/C][/ROW]
[ROW][C]69[/C][C]114.35[/C][C]114.433990774309[/C][C]-0.0839907743090009[/C][/ROW]
[ROW][C]70[/C][C]114.54[/C][C]114.345751171485[/C][C]0.194248828514802[/C][/ROW]
[ROW][C]71[/C][C]114.51[/C][C]114.529922108299[/C][C]-0.0199221082987577[/C][/ROW]
[ROW][C]72[/C][C]114.53[/C][C]114.605490555855[/C][C]-0.0754905558546426[/C][/ROW]
[/TABLE]
Source: https://freestatistics.org/blog/index.php?pk=166493&T=2

Globally Unique Identifier (entire table): ba.freestatistics.org/blog/index.php?pk=166493&T=2

As an alternative you can also use a QR Code:  

The GUIDs for individual cells are displayed in the table below:

Interpolation Forecasts of Exponential Smoothing
tObservedFittedResiduals
13106.61105.6512232905980.958776709401704
14106.74106.6197472254460.120252774554018
15107.01107.055894819076-0.0458948190755848
16107.1107.170324423863-0.0703244238633118
17107.28107.34410096862-0.0641009686203802
18107.4107.467706051517-0.0677060515167227
19107.59107.631212057026-0.041212057026371
20107.69107.735787087819-0.0457870878192637
21107.78108.039034606292-0.259034606291721
22108.02107.8091210682610.210878931738904
23108108.115923606757-0.11592360675742
24108.07108.202435295371-0.132435295370513
25108.36108.510642144692-0.150642144691531
26108.74108.4793419315510.260658068449217
27108.99108.990753179764-0.000753179764245715
28109.21109.1138409775790.0961590224213893
29109.31109.407065778747-0.0970657787465967
30109.41109.484122117323-0.0741221173232702
31109.54109.624387204228-0.084387204227653
32109.81109.6711904063490.138809593651033
33109.85110.100606595151-0.250606595151112
34110.01109.8960822550010.11391774499937
35110.23110.0860543234780.143945676522236
36110.28110.382524939277-0.102524939276947
37110.79110.7137313730080.0762686269919612
38110.91110.9068616715920.00313832840791406
39111.21111.1885237277950.0214762722050494
40111.44111.3351186349890.104881365011209
41111.52111.62292856219-0.102928562189931
42111.85111.6959457168860.154054283113908
43112.03112.034793502049-0.00479350204935258
44111.9112.177597139011-0.277597139011235
45112.11112.234205810038-0.124205810037935
46112.15112.156670688085-0.00667068808535021
47112.09112.243205475438-0.153205475438
48112.13112.25728263771-0.127282637709925
49112.45112.554908219789-0.10490821978928
50112.5112.560096100735-0.0600961007354641
51112.72112.752735685775-0.0327356857745968
52112.72112.818767358988-0.09876735898753
53112.83112.873629034488-0.0436290344876227
54112.95112.961995446027-0.0119954460267593
55112.98113.09580864802-0.115808648019609
56113.07113.0652485765090.00475142349100111
57113.1113.313826261771-0.213826261771459
58113.16113.1159860030150.0440139969852567
59113.2113.1834080074050.0165919925951385
60113.3113.2964845421960.00351545780361562
61113.48113.668271451998-0.188271451997622
62113.67113.5687642886540.101235711346035
63113.81113.865301460536-0.0553014605357447
64113.94113.8772865301610.0627134698386129
65114.13114.0457409824990.0842590175012816
66114.19114.225869660908-0.0358696609075082
67114.21114.317115775454-0.107115775454119
68114.21114.28536047673-0.0753604767299265
69114.35114.433990774309-0.0839907743090009
70114.54114.3457511714850.194248828514802
71114.51114.529922108299-0.0199221082987577
72114.53114.605490555855-0.0754905558546426


Extrapolation Forecasts of Exponential Smoothing
tForecast95% Lower Bound95% Upper Bound
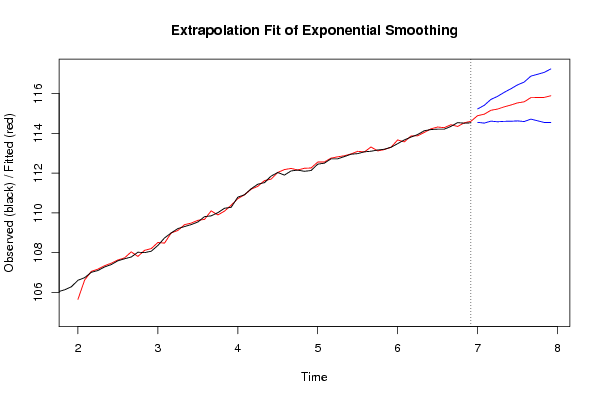
73114.889189959712114.553092375892115.225287543531
74114.961742887125114.514894932981115.408590841269
75115.15909305088114.613308188895115.704877912865
76115.220696256338114.581711839853115.859680672824
77115.332385799858114.603243539903116.061528059812
78115.424388703804114.606685455609116.242091951999
79115.531106640526114.625575294081116.436637986971
80115.58577362576114.592592312292116.578954939228
81115.796479272097114.715451824478116.877506719716
82115.800249465584114.630917982659116.969580948509
83115.806256114034114.547974794498117.064537433571
84115.890397546884114.542383057635117.238412036133

\begin{tabular}{lllllllll}
\hline
Extrapolation Forecasts of Exponential Smoothing \tabularnewline
t & Forecast & 95% Lower Bound & 95% Upper Bound \tabularnewline
73 & 114.889189959712 & 114.553092375892 & 115.225287543531 \tabularnewline
74 & 114.961742887125 & 114.514894932981 & 115.408590841269 \tabularnewline
75 & 115.15909305088 & 114.613308188895 & 115.704877912865 \tabularnewline
76 & 115.220696256338 & 114.581711839853 & 115.859680672824 \tabularnewline
77 & 115.332385799858 & 114.603243539903 & 116.061528059812 \tabularnewline
78 & 115.424388703804 & 114.606685455609 & 116.242091951999 \tabularnewline
79 & 115.531106640526 & 114.625575294081 & 116.436637986971 \tabularnewline
80 & 115.58577362576 & 114.592592312292 & 116.578954939228 \tabularnewline
81 & 115.796479272097 & 114.715451824478 & 116.877506719716 \tabularnewline
82 & 115.800249465584 & 114.630917982659 & 116.969580948509 \tabularnewline
83 & 115.806256114034 & 114.547974794498 & 117.064537433571 \tabularnewline
84 & 115.890397546884 & 114.542383057635 & 117.238412036133 \tabularnewline
\hline
\end{tabular}
%Source: https://freestatistics.org/blog/index.php?pk=166493&T=3

[TABLE]
[ROW][C]Extrapolation Forecasts of Exponential Smoothing[/C][/ROW]
[ROW][C]t[/C][C]Forecast[/C][C]95% Lower Bound[/C][C]95% Upper Bound[/C][/ROW]
[ROW][C]73[/C][C]114.889189959712[/C][C]114.553092375892[/C][C]115.225287543531[/C][/ROW]
[ROW][C]74[/C][C]114.961742887125[/C][C]114.514894932981[/C][C]115.408590841269[/C][/ROW]
[ROW][C]75[/C][C]115.15909305088[/C][C]114.613308188895[/C][C]115.704877912865[/C][/ROW]
[ROW][C]76[/C][C]115.220696256338[/C][C]114.581711839853[/C][C]115.859680672824[/C][/ROW]
[ROW][C]77[/C][C]115.332385799858[/C][C]114.603243539903[/C][C]116.061528059812[/C][/ROW]
[ROW][C]78[/C][C]115.424388703804[/C][C]114.606685455609[/C][C]116.242091951999[/C][/ROW]
[ROW][C]79[/C][C]115.531106640526[/C][C]114.625575294081[/C][C]116.436637986971[/C][/ROW]
[ROW][C]80[/C][C]115.58577362576[/C][C]114.592592312292[/C][C]116.578954939228[/C][/ROW]
[ROW][C]81[/C][C]115.796479272097[/C][C]114.715451824478[/C][C]116.877506719716[/C][/ROW]
[ROW][C]82[/C][C]115.800249465584[/C][C]114.630917982659[/C][C]116.969580948509[/C][/ROW]
[ROW][C]83[/C][C]115.806256114034[/C][C]114.547974794498[/C][C]117.064537433571[/C][/ROW]
[ROW][C]84[/C][C]115.890397546884[/C][C]114.542383057635[/C][C]117.238412036133[/C][/ROW]
[/TABLE]
Source: https://freestatistics.org/blog/index.php?pk=166493&T=3

Globally Unique Identifier (entire table): ba.freestatistics.org/blog/index.php?pk=166493&T=3

As an alternative you can also use a QR Code:  

The GUIDs for individual cells are displayed in the table below:

Extrapolation Forecasts of Exponential Smoothing
tForecast95% Lower Bound95% Upper Bound
73114.889189959712114.553092375892115.225287543531
74114.961742887125114.514894932981115.408590841269
75115.15909305088114.613308188895115.704877912865
76115.220696256338114.581711839853115.859680672824
77115.332385799858114.603243539903116.061528059812
78115.424388703804114.606685455609116.242091951999
79115.531106640526114.625575294081116.436637986971
80115.58577362576114.592592312292116.578954939228
81115.796479272097114.715451824478116.877506719716
82115.800249465584114.630917982659116.969580948509
83115.806256114034114.547974794498117.064537433571
84115.890397546884114.542383057635117.238412036133


Parameters (Session):
par1 = 12 ; par2 = Triple ; par3 = additive ;
Parameters (R input):
par1 = 12 ; par2 = Triple ; par3 = additive ;
R code (references can be found in the software module):
par1 <- as.numeric(par1)
if (par2 == 'Single') K <- 1
if (par2 == 'Double') K <- 2
if (par2 == 'Triple') K <- par1
nx <- length(x)
nxmK <- nx - K
x <- ts(x, frequency = par1)
if (par2 == 'Single') fit <- HoltWinters(x, gamma=F, beta=F)
if (par2 == 'Double') fit <- HoltWinters(x, gamma=F)
if (par2 == 'Triple') fit <- HoltWinters(x, seasonal=par3)
fit
myresid <- x - fit$fitted[,'xhat']
bitmap(file='test1.png')
op <- par(mfrow=c(2,1))
plot(fit,ylab='Observed (black) / Fitted (red)',main='Interpolation Fit of Exponential Smoothing')
plot(myresid,ylab='Residuals',main='Interpolation Prediction Errors')
par(op)
dev.off()
bitmap(file='test2.png')
p <- predict(fit, par1, prediction.interval=TRUE)
np <- length(p[,1])
plot(fit,p,ylab='Observed (black) / Fitted (red)',main='Extrapolation Fit of Exponential Smoothing')
dev.off()
bitmap(file='test3.png')
op <- par(mfrow = c(2,2))
acf(as.numeric(myresid),lag.max = nx/2,main='Residual ACF')
spectrum(myresid,main='Residals Periodogram')
cpgram(myresid,main='Residal Cumulative Periodogram')
qqnorm(myresid,main='Residual Normal QQ Plot')
qqline(myresid)
par(op)
dev.off()
load(file='createtable')
a<-table.start()
a<-table.row.start(a)
a<-table.element(a,'Estimated Parameters of Exponential Smoothing',2,TRUE)
a<-table.row.end(a)
a<-table.row.start(a)
a<-table.element(a,'Parameter',header=TRUE)
a<-table.element(a,'Value',header=TRUE)
a<-table.row.end(a)
a<-table.row.start(a)
a<-table.element(a,'alpha',header=TRUE)
a<-table.element(a,fit$alpha)
a<-table.row.end(a)
a<-table.row.start(a)
a<-table.element(a,'beta',header=TRUE)
a<-table.element(a,fit$beta)
a<-table.row.end(a)
a<-table.row.start(a)
a<-table.element(a,'gamma',header=TRUE)
a<-table.element(a,fit$gamma)
a<-table.row.end(a)
a<-table.end(a)
table.save(a,file='mytable.tab')
a<-table.start()
a<-table.row.start(a)
a<-table.element(a,'Interpolation Forecasts of Exponential Smoothing',4,TRUE)
a<-table.row.end(a)
a<-table.row.start(a)
a<-table.element(a,'t',header=TRUE)
a<-table.element(a,'Observed',header=TRUE)
a<-table.element(a,'Fitted',header=TRUE)
a<-table.element(a,'Residuals',header=TRUE)
a<-table.row.end(a)
for (i in 1:nxmK) {
a<-table.row.start(a)
a<-table.element(a,i+K,header=TRUE)
a<-table.element(a,x[i+K])
a<-table.element(a,fit$fitted[i,'xhat'])
a<-table.element(a,myresid[i])
a<-table.row.end(a)
}
a<-table.end(a)
table.save(a,file='mytable1.tab')
a<-table.start()
a<-table.row.start(a)
a<-table.element(a,'Extrapolation Forecasts of Exponential Smoothing',4,TRUE)
a<-table.row.end(a)
a<-table.row.start(a)
a<-table.element(a,'t',header=TRUE)
a<-table.element(a,'Forecast',header=TRUE)
a<-table.element(a,'95% Lower Bound',header=TRUE)
a<-table.element(a,'95% Upper Bound',header=TRUE)
a<-table.row.end(a)
for (i in 1:np) {
a<-table.row.start(a)
a<-table.element(a,nx+i,header=TRUE)
a<-table.element(a,p[i,'fit'])
a<-table.element(a,p[i,'lwr'])
a<-table.element(a,p[i,'upr'])
a<-table.row.end(a)
}
a<-table.end(a)
table.save(a,file='mytable2.tab')