Free Statistics

of Irreproducible Research!

Author's title

Author*Unverified author*
R Software Modulerwasp_exponentialsmoothing.wasp
Title produced by softwareExponential Smoothing
Date of computationThu, 17 May 2012 08:41:46 -0400
Cite this page as followsStatistical Computations at FreeStatistics.org, Office for Research Development and Education, URL https://freestatistics.org/blog/index.php?v=date/2012/May/17/t1337258567qk16vn1w7ngulwe.htm/, Retrieved Mon, 29 Apr 2024 19:54:33 +0000
Statistical Computations at FreeStatistics.org, Office for Research Development and Education, URL https://freestatistics.org/blog/index.php?pk=166609, Retrieved Mon, 29 Apr 2024 19:54:33 +0000
QR Codes:

Original text written by user:
IsPrivate?No (this computation is public)
User-defined keywords
Estimated Impact134
Family? (F = Feedback message, R = changed R code, M = changed R Module, P = changed Parameters, D = changed Data)
-       [Exponential Smoothing] [Exponential Smoot...] [2012-05-17 12:41:46] [1924da7ecb4a93ab5e2de1fdfa2878e4] [Current]
Feedback Forum

Post a new message
Dataseries X:
3440
2678
2981
2260
2844
2546
2456
2295
2379
2479
2057
2280
2351
2276
2548
2311
2201
2725
2408
2139
1898
2539
2070
2063
2565
2442
2194
2798
2074
2628
2289
2154
2468
2137
1850
2078
1791
1755
2232
1954
1822
2522
2074
2366
2173
2094
1833
1858
2040
2133
2921
3252
3318
3556
2305
1618
1314
1501
1414
1661


Summary of computational transaction
Raw Inputview raw input (R code)
Raw Outputview raw output of R engine
Computing time2 seconds
R Server'AstonUniversity' @ aston.wessa.net

\begin{tabular}{lllllllll}
\hline
Summary of computational transaction \tabularnewline
Raw Input & view raw input (R code)  \tabularnewline
Raw Output & view raw output of R engine  \tabularnewline
Computing time & 2 seconds \tabularnewline
R Server & 'AstonUniversity' @ aston.wessa.net \tabularnewline
\hline
\end{tabular}
%Source: https://freestatistics.org/blog/index.php?pk=166609&T=0

[TABLE]
[ROW][C]Summary of computational transaction[/C][/ROW]
[ROW][C]Raw Input[/C][C]view raw input (R code) [/C][/ROW]
[ROW][C]Raw Output[/C][C]view raw output of R engine [/C][/ROW]
[ROW][C]Computing time[/C][C]2 seconds[/C][/ROW]
[ROW][C]R Server[/C][C]'AstonUniversity' @ aston.wessa.net[/C][/ROW]
[/TABLE]
Source: https://freestatistics.org/blog/index.php?pk=166609&T=0

Globally Unique Identifier (entire table): ba.freestatistics.org/blog/index.php?pk=166609&T=0

As an alternative you can also use a QR Code:  

The GUIDs for individual cells are displayed in the table below:

Summary of computational transaction
Raw Inputview raw input (R code)
Raw Outputview raw output of R engine
Computing time2 seconds
R Server'AstonUniversity' @ aston.wessa.net


Estimated Parameters of Exponential Smoothing
ParameterValue
alpha0.95579371676362
beta0
gamma0

\begin{tabular}{lllllllll}
\hline
Estimated Parameters of Exponential Smoothing \tabularnewline
Parameter & Value \tabularnewline
alpha & 0.95579371676362 \tabularnewline
beta & 0 \tabularnewline
gamma & 0 \tabularnewline
\hline
\end{tabular}
%Source: https://freestatistics.org/blog/index.php?pk=166609&T=1

[TABLE]
[ROW][C]Estimated Parameters of Exponential Smoothing[/C][/ROW]
[ROW][C]Parameter[/C][C]Value[/C][/ROW]
[ROW][C]alpha[/C][C]0.95579371676362[/C][/ROW]
[ROW][C]beta[/C][C]0[/C][/ROW]
[ROW][C]gamma[/C][C]0[/C][/ROW]
[/TABLE]
Source: https://freestatistics.org/blog/index.php?pk=166609&T=1

Globally Unique Identifier (entire table): ba.freestatistics.org/blog/index.php?pk=166609&T=1

As an alternative you can also use a QR Code:  

The GUIDs for individual cells are displayed in the table below:

Estimated Parameters of Exponential Smoothing
ParameterValue
alpha0.95579371676362
beta0
gamma0


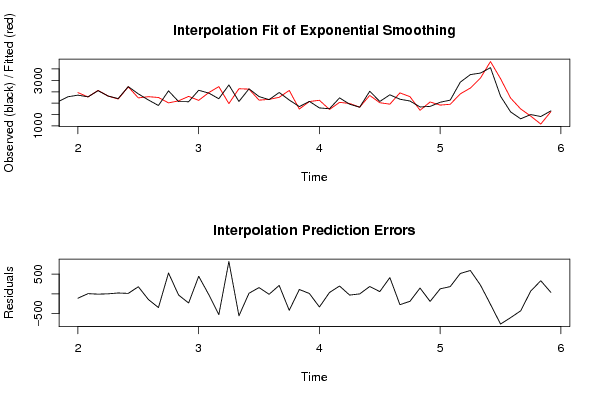
Interpolation Forecasts of Exponential Smoothing
tObservedFittedResiduals
1323512463.04754273504-112.047542735043
1422762272.909207741093.09079225891219
1525482557.86103655965-9.8610365596469
1623112312.43358877283-1.43358877282935
1722012181.4777092956719.522290704329
1827252716.09299441878.90700558129583
1924082229.64559005282178.354409947179
2021392284.69661676842-145.69661676842
2118982247.68837490512-349.688374905116
2225392012.83109234319526.168907656805
2320702101.86269723562-31.8626972356151
2420632297.19786708301-234.197867083008
2525652122.3506862433442.649313756703
2624422462.38812139268-20.3881213926834
2721942724.89895206661-530.898952066612
2827981981.46673844262816.533261557376
2920742632.318435032-558.318435032004
3026282614.6371852061213.3628147938798
3122892132.44861528872156.551384711278
3221542166.66044747741-12.6604474774076
3324682256.80734032475211.192659675246
3421372558.03662646662-421.036626466621
3518501741.73513336014108.264866639858
3620782071.00334830516.99665169489526
3717912126.68837303114-335.688373031138
3817551722.7955376283832.2044623716238
3922322035.57402941259196.425970587406
4019541987.3144069069-33.3144069069015
4118221825.88704177191-3.88704177191335
4225222338.12783400052183.872165999476
4320742018.9110306148855.0889693851236
4423661956.14572374716409.854276252837
4521732450.12953477599-277.129534775994
4620942284.62353570514-190.623535705144
4718331688.54942700857144.450572991429
4818582052.40371272102-194.403712721019
4920401915.59153458442124.408465415582
5021331951.45636647184181.543633528163
5129212406.97229971416514.027700285838
5232522662.27441488749589.725585112512
5333183096.34475941711221.655240582889
5435563824.15744798497-268.157447984967
5523053072.8935797619-767.893579761904
5616182223.52672341335-605.526723413355
5713141747.01575484008-433.015754840077
5815011432.5146861019568.4853138980548
5914141084.09518781396329.904812186041
6016611625.2054700957935.7945299042058

\begin{tabular}{lllllllll}
\hline
Interpolation Forecasts of Exponential Smoothing \tabularnewline
t & Observed & Fitted & Residuals \tabularnewline
13 & 2351 & 2463.04754273504 & -112.047542735043 \tabularnewline
14 & 2276 & 2272.90920774109 & 3.09079225891219 \tabularnewline
15 & 2548 & 2557.86103655965 & -9.8610365596469 \tabularnewline
16 & 2311 & 2312.43358877283 & -1.43358877282935 \tabularnewline
17 & 2201 & 2181.47770929567 & 19.522290704329 \tabularnewline
18 & 2725 & 2716.0929944187 & 8.90700558129583 \tabularnewline
19 & 2408 & 2229.64559005282 & 178.354409947179 \tabularnewline
20 & 2139 & 2284.69661676842 & -145.69661676842 \tabularnewline
21 & 1898 & 2247.68837490512 & -349.688374905116 \tabularnewline
22 & 2539 & 2012.83109234319 & 526.168907656805 \tabularnewline
23 & 2070 & 2101.86269723562 & -31.8626972356151 \tabularnewline
24 & 2063 & 2297.19786708301 & -234.197867083008 \tabularnewline
25 & 2565 & 2122.3506862433 & 442.649313756703 \tabularnewline
26 & 2442 & 2462.38812139268 & -20.3881213926834 \tabularnewline
27 & 2194 & 2724.89895206661 & -530.898952066612 \tabularnewline
28 & 2798 & 1981.46673844262 & 816.533261557376 \tabularnewline
29 & 2074 & 2632.318435032 & -558.318435032004 \tabularnewline
30 & 2628 & 2614.63718520612 & 13.3628147938798 \tabularnewline
31 & 2289 & 2132.44861528872 & 156.551384711278 \tabularnewline
32 & 2154 & 2166.66044747741 & -12.6604474774076 \tabularnewline
33 & 2468 & 2256.80734032475 & 211.192659675246 \tabularnewline
34 & 2137 & 2558.03662646662 & -421.036626466621 \tabularnewline
35 & 1850 & 1741.73513336014 & 108.264866639858 \tabularnewline
36 & 2078 & 2071.0033483051 & 6.99665169489526 \tabularnewline
37 & 1791 & 2126.68837303114 & -335.688373031138 \tabularnewline
38 & 1755 & 1722.79553762838 & 32.2044623716238 \tabularnewline
39 & 2232 & 2035.57402941259 & 196.425970587406 \tabularnewline
40 & 1954 & 1987.3144069069 & -33.3144069069015 \tabularnewline
41 & 1822 & 1825.88704177191 & -3.88704177191335 \tabularnewline
42 & 2522 & 2338.12783400052 & 183.872165999476 \tabularnewline
43 & 2074 & 2018.91103061488 & 55.0889693851236 \tabularnewline
44 & 2366 & 1956.14572374716 & 409.854276252837 \tabularnewline
45 & 2173 & 2450.12953477599 & -277.129534775994 \tabularnewline
46 & 2094 & 2284.62353570514 & -190.623535705144 \tabularnewline
47 & 1833 & 1688.54942700857 & 144.450572991429 \tabularnewline
48 & 1858 & 2052.40371272102 & -194.403712721019 \tabularnewline
49 & 2040 & 1915.59153458442 & 124.408465415582 \tabularnewline
50 & 2133 & 1951.45636647184 & 181.543633528163 \tabularnewline
51 & 2921 & 2406.97229971416 & 514.027700285838 \tabularnewline
52 & 3252 & 2662.27441488749 & 589.725585112512 \tabularnewline
53 & 3318 & 3096.34475941711 & 221.655240582889 \tabularnewline
54 & 3556 & 3824.15744798497 & -268.157447984967 \tabularnewline
55 & 2305 & 3072.8935797619 & -767.893579761904 \tabularnewline
56 & 1618 & 2223.52672341335 & -605.526723413355 \tabularnewline
57 & 1314 & 1747.01575484008 & -433.015754840077 \tabularnewline
58 & 1501 & 1432.51468610195 & 68.4853138980548 \tabularnewline
59 & 1414 & 1084.09518781396 & 329.904812186041 \tabularnewline
60 & 1661 & 1625.20547009579 & 35.7945299042058 \tabularnewline
\hline
\end{tabular}
%Source: https://freestatistics.org/blog/index.php?pk=166609&T=2

[TABLE]
[ROW][C]Interpolation Forecasts of Exponential Smoothing[/C][/ROW]
[ROW][C]t[/C][C]Observed[/C][C]Fitted[/C][C]Residuals[/C][/ROW]
[ROW][C]13[/C][C]2351[/C][C]2463.04754273504[/C][C]-112.047542735043[/C][/ROW]
[ROW][C]14[/C][C]2276[/C][C]2272.90920774109[/C][C]3.09079225891219[/C][/ROW]
[ROW][C]15[/C][C]2548[/C][C]2557.86103655965[/C][C]-9.8610365596469[/C][/ROW]
[ROW][C]16[/C][C]2311[/C][C]2312.43358877283[/C][C]-1.43358877282935[/C][/ROW]
[ROW][C]17[/C][C]2201[/C][C]2181.47770929567[/C][C]19.522290704329[/C][/ROW]
[ROW][C]18[/C][C]2725[/C][C]2716.0929944187[/C][C]8.90700558129583[/C][/ROW]
[ROW][C]19[/C][C]2408[/C][C]2229.64559005282[/C][C]178.354409947179[/C][/ROW]
[ROW][C]20[/C][C]2139[/C][C]2284.69661676842[/C][C]-145.69661676842[/C][/ROW]
[ROW][C]21[/C][C]1898[/C][C]2247.68837490512[/C][C]-349.688374905116[/C][/ROW]
[ROW][C]22[/C][C]2539[/C][C]2012.83109234319[/C][C]526.168907656805[/C][/ROW]
[ROW][C]23[/C][C]2070[/C][C]2101.86269723562[/C][C]-31.8626972356151[/C][/ROW]
[ROW][C]24[/C][C]2063[/C][C]2297.19786708301[/C][C]-234.197867083008[/C][/ROW]
[ROW][C]25[/C][C]2565[/C][C]2122.3506862433[/C][C]442.649313756703[/C][/ROW]
[ROW][C]26[/C][C]2442[/C][C]2462.38812139268[/C][C]-20.3881213926834[/C][/ROW]
[ROW][C]27[/C][C]2194[/C][C]2724.89895206661[/C][C]-530.898952066612[/C][/ROW]
[ROW][C]28[/C][C]2798[/C][C]1981.46673844262[/C][C]816.533261557376[/C][/ROW]
[ROW][C]29[/C][C]2074[/C][C]2632.318435032[/C][C]-558.318435032004[/C][/ROW]
[ROW][C]30[/C][C]2628[/C][C]2614.63718520612[/C][C]13.3628147938798[/C][/ROW]
[ROW][C]31[/C][C]2289[/C][C]2132.44861528872[/C][C]156.551384711278[/C][/ROW]
[ROW][C]32[/C][C]2154[/C][C]2166.66044747741[/C][C]-12.6604474774076[/C][/ROW]
[ROW][C]33[/C][C]2468[/C][C]2256.80734032475[/C][C]211.192659675246[/C][/ROW]
[ROW][C]34[/C][C]2137[/C][C]2558.03662646662[/C][C]-421.036626466621[/C][/ROW]
[ROW][C]35[/C][C]1850[/C][C]1741.73513336014[/C][C]108.264866639858[/C][/ROW]
[ROW][C]36[/C][C]2078[/C][C]2071.0033483051[/C][C]6.99665169489526[/C][/ROW]
[ROW][C]37[/C][C]1791[/C][C]2126.68837303114[/C][C]-335.688373031138[/C][/ROW]
[ROW][C]38[/C][C]1755[/C][C]1722.79553762838[/C][C]32.2044623716238[/C][/ROW]
[ROW][C]39[/C][C]2232[/C][C]2035.57402941259[/C][C]196.425970587406[/C][/ROW]
[ROW][C]40[/C][C]1954[/C][C]1987.3144069069[/C][C]-33.3144069069015[/C][/ROW]
[ROW][C]41[/C][C]1822[/C][C]1825.88704177191[/C][C]-3.88704177191335[/C][/ROW]
[ROW][C]42[/C][C]2522[/C][C]2338.12783400052[/C][C]183.872165999476[/C][/ROW]
[ROW][C]43[/C][C]2074[/C][C]2018.91103061488[/C][C]55.0889693851236[/C][/ROW]
[ROW][C]44[/C][C]2366[/C][C]1956.14572374716[/C][C]409.854276252837[/C][/ROW]
[ROW][C]45[/C][C]2173[/C][C]2450.12953477599[/C][C]-277.129534775994[/C][/ROW]
[ROW][C]46[/C][C]2094[/C][C]2284.62353570514[/C][C]-190.623535705144[/C][/ROW]
[ROW][C]47[/C][C]1833[/C][C]1688.54942700857[/C][C]144.450572991429[/C][/ROW]
[ROW][C]48[/C][C]1858[/C][C]2052.40371272102[/C][C]-194.403712721019[/C][/ROW]
[ROW][C]49[/C][C]2040[/C][C]1915.59153458442[/C][C]124.408465415582[/C][/ROW]
[ROW][C]50[/C][C]2133[/C][C]1951.45636647184[/C][C]181.543633528163[/C][/ROW]
[ROW][C]51[/C][C]2921[/C][C]2406.97229971416[/C][C]514.027700285838[/C][/ROW]
[ROW][C]52[/C][C]3252[/C][C]2662.27441488749[/C][C]589.725585112512[/C][/ROW]
[ROW][C]53[/C][C]3318[/C][C]3096.34475941711[/C][C]221.655240582889[/C][/ROW]
[ROW][C]54[/C][C]3556[/C][C]3824.15744798497[/C][C]-268.157447984967[/C][/ROW]
[ROW][C]55[/C][C]2305[/C][C]3072.8935797619[/C][C]-767.893579761904[/C][/ROW]
[ROW][C]56[/C][C]1618[/C][C]2223.52672341335[/C][C]-605.526723413355[/C][/ROW]
[ROW][C]57[/C][C]1314[/C][C]1747.01575484008[/C][C]-433.015754840077[/C][/ROW]
[ROW][C]58[/C][C]1501[/C][C]1432.51468610195[/C][C]68.4853138980548[/C][/ROW]
[ROW][C]59[/C][C]1414[/C][C]1084.09518781396[/C][C]329.904812186041[/C][/ROW]
[ROW][C]60[/C][C]1661[/C][C]1625.20547009579[/C][C]35.7945299042058[/C][/ROW]
[/TABLE]
Source: https://freestatistics.org/blog/index.php?pk=166609&T=2

Globally Unique Identifier (entire table): ba.freestatistics.org/blog/index.php?pk=166609&T=2

As an alternative you can also use a QR Code:  

The GUIDs for individual cells are displayed in the table below:

Interpolation Forecasts of Exponential Smoothing
tObservedFittedResiduals
1323512463.04754273504-112.047542735043
1422762272.909207741093.09079225891219
1525482557.86103655965-9.8610365596469
1623112312.43358877283-1.43358877282935
1722012181.4777092956719.522290704329
1827252716.09299441878.90700558129583
1924082229.64559005282178.354409947179
2021392284.69661676842-145.69661676842
2118982247.68837490512-349.688374905116
2225392012.83109234319526.168907656805
2320702101.86269723562-31.8626972356151
2420632297.19786708301-234.197867083008
2525652122.3506862433442.649313756703
2624422462.38812139268-20.3881213926834
2721942724.89895206661-530.898952066612
2827981981.46673844262816.533261557376
2920742632.318435032-558.318435032004
3026282614.6371852061213.3628147938798
3122892132.44861528872156.551384711278
3221542166.66044747741-12.6604474774076
3324682256.80734032475211.192659675246
3421372558.03662646662-421.036626466621
3518501741.73513336014108.264866639858
3620782071.00334830516.99665169489526
3717912126.68837303114-335.688373031138
3817551722.7955376283832.2044623716238
3922322035.57402941259196.425970587406
4019541987.3144069069-33.3144069069015
4118221825.88704177191-3.88704177191335
4225222338.12783400052183.872165999476
4320742018.9110306148855.0889693851236
4423661956.14572374716409.854276252837
4521732450.12953477599-277.129534775994
4620942284.62353570514-190.623535705144
4718331688.54942700857144.450572991429
4818582052.40371272102-194.403712721019
4920401915.59153458442124.408465415582
5021331951.45636647184181.543633528163
5129212406.97229971416514.027700285838
5232522662.27441488749589.725585112512
5333183096.34475941711221.655240582889
5435563824.15744798497-268.157447984967
5523053072.8935797619-767.893579761904
5616182223.52672341335-605.526723413355
5713141747.01575484008-433.015754840077
5815011432.5146861019568.4853138980548
5914141084.09518781396329.904812186041
6016611625.2054700957935.7945299042058


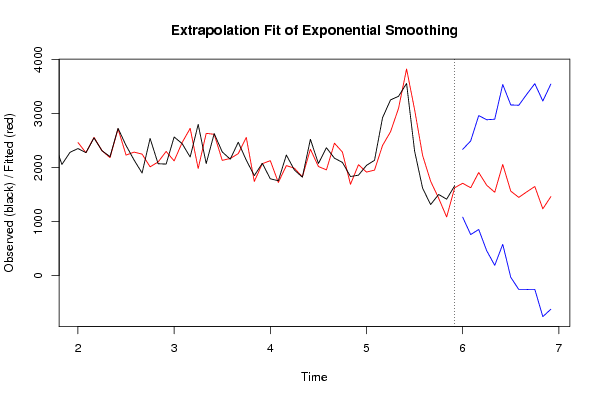
Extrapolation Forecasts of Exponential Smoothing
tForecast95% Lower Bound95% Upper Bound
611708.415325870411081.641750817492335.18890092333
621625.37132820141758.3502903216392492.39236608119
631907.36899719908853.516139411232961.22185498693
641671.36666619675459.1430021771412883.59033021636
651541.78100186109189.609941177332893.95206254484
662057.73700419209578.8026097404153536.67139864376
671562.77633985642-32.88255503108923158.43523474394
681447.35734218743-257.0509641098493151.7656484847
691549.6050111851-257.0183696878113356.228392058
701648.97768018276-254.3794607811043552.33482114663
711235.10034918043-760.3065696708723230.50726803174
721460.88968484477-622.5039739583783544.28334364792

\begin{tabular}{lllllllll}
\hline
Extrapolation Forecasts of Exponential Smoothing \tabularnewline
t & Forecast & 95% Lower Bound & 95% Upper Bound \tabularnewline
61 & 1708.41532587041 & 1081.64175081749 & 2335.18890092333 \tabularnewline
62 & 1625.37132820141 & 758.350290321639 & 2492.39236608119 \tabularnewline
63 & 1907.36899719908 & 853.51613941123 & 2961.22185498693 \tabularnewline
64 & 1671.36666619675 & 459.143002177141 & 2883.59033021636 \tabularnewline
65 & 1541.78100186109 & 189.60994117733 & 2893.95206254484 \tabularnewline
66 & 2057.73700419209 & 578.802609740415 & 3536.67139864376 \tabularnewline
67 & 1562.77633985642 & -32.8825550310892 & 3158.43523474394 \tabularnewline
68 & 1447.35734218743 & -257.050964109849 & 3151.7656484847 \tabularnewline
69 & 1549.6050111851 & -257.018369687811 & 3356.228392058 \tabularnewline
70 & 1648.97768018276 & -254.379460781104 & 3552.33482114663 \tabularnewline
71 & 1235.10034918043 & -760.306569670872 & 3230.50726803174 \tabularnewline
72 & 1460.88968484477 & -622.503973958378 & 3544.28334364792 \tabularnewline
\hline
\end{tabular}
%Source: https://freestatistics.org/blog/index.php?pk=166609&T=3

[TABLE]
[ROW][C]Extrapolation Forecasts of Exponential Smoothing[/C][/ROW]
[ROW][C]t[/C][C]Forecast[/C][C]95% Lower Bound[/C][C]95% Upper Bound[/C][/ROW]
[ROW][C]61[/C][C]1708.41532587041[/C][C]1081.64175081749[/C][C]2335.18890092333[/C][/ROW]
[ROW][C]62[/C][C]1625.37132820141[/C][C]758.350290321639[/C][C]2492.39236608119[/C][/ROW]
[ROW][C]63[/C][C]1907.36899719908[/C][C]853.51613941123[/C][C]2961.22185498693[/C][/ROW]
[ROW][C]64[/C][C]1671.36666619675[/C][C]459.143002177141[/C][C]2883.59033021636[/C][/ROW]
[ROW][C]65[/C][C]1541.78100186109[/C][C]189.60994117733[/C][C]2893.95206254484[/C][/ROW]
[ROW][C]66[/C][C]2057.73700419209[/C][C]578.802609740415[/C][C]3536.67139864376[/C][/ROW]
[ROW][C]67[/C][C]1562.77633985642[/C][C]-32.8825550310892[/C][C]3158.43523474394[/C][/ROW]
[ROW][C]68[/C][C]1447.35734218743[/C][C]-257.050964109849[/C][C]3151.7656484847[/C][/ROW]
[ROW][C]69[/C][C]1549.6050111851[/C][C]-257.018369687811[/C][C]3356.228392058[/C][/ROW]
[ROW][C]70[/C][C]1648.97768018276[/C][C]-254.379460781104[/C][C]3552.33482114663[/C][/ROW]
[ROW][C]71[/C][C]1235.10034918043[/C][C]-760.306569670872[/C][C]3230.50726803174[/C][/ROW]
[ROW][C]72[/C][C]1460.88968484477[/C][C]-622.503973958378[/C][C]3544.28334364792[/C][/ROW]
[/TABLE]
Source: https://freestatistics.org/blog/index.php?pk=166609&T=3

Globally Unique Identifier (entire table): ba.freestatistics.org/blog/index.php?pk=166609&T=3

As an alternative you can also use a QR Code:  

The GUIDs for individual cells are displayed in the table below:

Extrapolation Forecasts of Exponential Smoothing
tForecast95% Lower Bound95% Upper Bound
611708.415325870411081.641750817492335.18890092333
621625.37132820141758.3502903216392492.39236608119
631907.36899719908853.516139411232961.22185498693
641671.36666619675459.1430021771412883.59033021636
651541.78100186109189.609941177332893.95206254484
662057.73700419209578.8026097404153536.67139864376
671562.77633985642-32.88255503108923158.43523474394
681447.35734218743-257.0509641098493151.7656484847
691549.6050111851-257.0183696878113356.228392058
701648.97768018276-254.3794607811043552.33482114663
711235.10034918043-760.3065696708723230.50726803174
721460.88968484477-622.5039739583783544.28334364792


Parameters (Session):
par1 = 12 ; par2 = Triple ; par3 = additive ;
Parameters (R input):
par1 = 12 ; par2 = Triple ; par3 = additive ;
R code (references can be found in the software module):
par1 <- as.numeric(par1)
if (par2 == 'Single') K <- 1
if (par2 == 'Double') K <- 2
if (par2 == 'Triple') K <- par1
nx <- length(x)
nxmK <- nx - K
x <- ts(x, frequency = par1)
if (par2 == 'Single') fit <- HoltWinters(x, gamma=F, beta=F)
if (par2 == 'Double') fit <- HoltWinters(x, gamma=F)
if (par2 == 'Triple') fit <- HoltWinters(x, seasonal=par3)
fit
myresid <- x - fit$fitted[,'xhat']
bitmap(file='test1.png')
op <- par(mfrow=c(2,1))
plot(fit,ylab='Observed (black) / Fitted (red)',main='Interpolation Fit of Exponential Smoothing')
plot(myresid,ylab='Residuals',main='Interpolation Prediction Errors')
par(op)
dev.off()
bitmap(file='test2.png')
p <- predict(fit, par1, prediction.interval=TRUE)
np <- length(p[,1])
plot(fit,p,ylab='Observed (black) / Fitted (red)',main='Extrapolation Fit of Exponential Smoothing')
dev.off()
bitmap(file='test3.png')
op <- par(mfrow = c(2,2))
acf(as.numeric(myresid),lag.max = nx/2,main='Residual ACF')
spectrum(myresid,main='Residals Periodogram')
cpgram(myresid,main='Residal Cumulative Periodogram')
qqnorm(myresid,main='Residual Normal QQ Plot')
qqline(myresid)
par(op)
dev.off()
load(file='createtable')
a<-table.start()
a<-table.row.start(a)
a<-table.element(a,'Estimated Parameters of Exponential Smoothing',2,TRUE)
a<-table.row.end(a)
a<-table.row.start(a)
a<-table.element(a,'Parameter',header=TRUE)
a<-table.element(a,'Value',header=TRUE)
a<-table.row.end(a)
a<-table.row.start(a)
a<-table.element(a,'alpha',header=TRUE)
a<-table.element(a,fit$alpha)
a<-table.row.end(a)
a<-table.row.start(a)
a<-table.element(a,'beta',header=TRUE)
a<-table.element(a,fit$beta)
a<-table.row.end(a)
a<-table.row.start(a)
a<-table.element(a,'gamma',header=TRUE)
a<-table.element(a,fit$gamma)
a<-table.row.end(a)
a<-table.end(a)
table.save(a,file='mytable.tab')
a<-table.start()
a<-table.row.start(a)
a<-table.element(a,'Interpolation Forecasts of Exponential Smoothing',4,TRUE)
a<-table.row.end(a)
a<-table.row.start(a)
a<-table.element(a,'t',header=TRUE)
a<-table.element(a,'Observed',header=TRUE)
a<-table.element(a,'Fitted',header=TRUE)
a<-table.element(a,'Residuals',header=TRUE)
a<-table.row.end(a)
for (i in 1:nxmK) {
a<-table.row.start(a)
a<-table.element(a,i+K,header=TRUE)
a<-table.element(a,x[i+K])
a<-table.element(a,fit$fitted[i,'xhat'])
a<-table.element(a,myresid[i])
a<-table.row.end(a)
}
a<-table.end(a)
table.save(a,file='mytable1.tab')
a<-table.start()
a<-table.row.start(a)
a<-table.element(a,'Extrapolation Forecasts of Exponential Smoothing',4,TRUE)
a<-table.row.end(a)
a<-table.row.start(a)
a<-table.element(a,'t',header=TRUE)
a<-table.element(a,'Forecast',header=TRUE)
a<-table.element(a,'95% Lower Bound',header=TRUE)
a<-table.element(a,'95% Upper Bound',header=TRUE)
a<-table.row.end(a)
for (i in 1:np) {
a<-table.row.start(a)
a<-table.element(a,nx+i,header=TRUE)
a<-table.element(a,p[i,'fit'])
a<-table.element(a,p[i,'lwr'])
a<-table.element(a,p[i,'upr'])
a<-table.row.end(a)
}
a<-table.end(a)
table.save(a,file='mytable2.tab')