Free Statistics

of Irreproducible Research!

Author's title

Author*The author of this computation has been verified*
R Software Modulerwasp_hierarchicalclusteringdm.wasp
Title produced by softwareHierarchical Clustering
Date of computationThu, 24 May 2012 05:38:39 -0400
Cite this page as followsStatistical Computations at FreeStatistics.org, Office for Research Development and Education, URL https://freestatistics.org/blog/index.php?v=date/2012/May/24/t1337852339n6qv75mxngbubk3.htm/, Retrieved Sun, 05 May 2024 11:33:47 +0000
Statistical Computations at FreeStatistics.org, Office for Research Development and Education, URL https://freestatistics.org/blog/index.php?pk=167273, Retrieved Sun, 05 May 2024 11:33:47 +0000
QR Codes:

Original text written by user:
IsPrivate?No (this computation is public)
User-defined keywords
Estimated Impact112
Family? (F = Feedback message, R = changed R code, M = changed R Module, P = changed Parameters, D = changed Data)
-     [Hierarchical Clustering] [] [2012-04-22 11:59:33] [182e2e10fa38557ff81755a04c8c64c0]
- RMPD    [Hierarchical Clustering] [] [2012-05-24 09:38:39] [aedc5b8e4f26bdca34b1a0cf88d6dfa2] [Current]
Feedback Forum

Post a new message


Summary of computational transaction
Raw Inputview raw input (R code)
Raw Outputview raw output of R engine
Computing time3 seconds
R Server'AstonUniversity' @ aston.wessa.net

\begin{tabular}{lllllllll}
\hline
Summary of computational transaction \tabularnewline
Raw Input & view raw input (R code)  \tabularnewline
Raw Output & view raw output of R engine  \tabularnewline
Computing time & 3 seconds \tabularnewline
R Server & 'AstonUniversity' @ aston.wessa.net \tabularnewline
\hline
\end{tabular}
%Source: https://freestatistics.org/blog/index.php?pk=167273&T=0

[TABLE]
[ROW][C]Summary of computational transaction[/C][/ROW]
[ROW][C]Raw Input[/C][C]view raw input (R code) [/C][/ROW]
[ROW][C]Raw Output[/C][C]view raw output of R engine [/C][/ROW]
[ROW][C]Computing time[/C][C]3 seconds[/C][/ROW]
[ROW][C]R Server[/C][C]'AstonUniversity' @ aston.wessa.net[/C][/ROW]
[/TABLE]
Source: https://freestatistics.org/blog/index.php?pk=167273&T=0

Globally Unique Identifier (entire table): ba.freestatistics.org/blog/index.php?pk=167273&T=0

As an alternative you can also use a QR Code:  

The GUIDs for individual cells are displayed in the table below:

Summary of computational transaction
Raw Inputview raw input (R code)
Raw Outputview raw output of R engine
Computing time3 seconds
R Server'AstonUniversity' @ aston.wessa.net


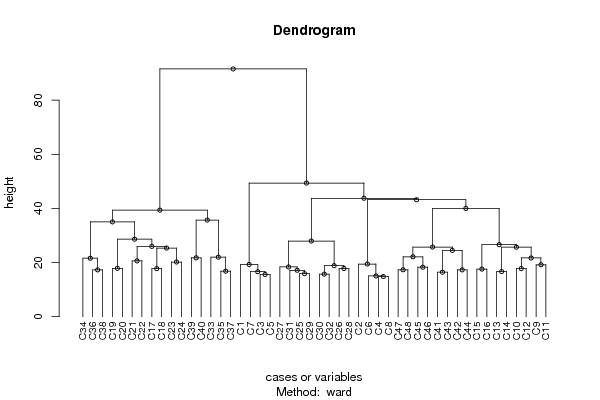
Summary of Dendrogram
LabelHeight
C114.8323969741913
C315.0558676752696
C515.5884572681199
C715.7162336455017
C915.9059737205869
C1116.431676725155
C1316.6099313760247
C1516.6733320005331
C1716.8226038412607
C1917.1478745197249
C2117.2916164657906
C2317.2916164657906
C2517.3205080756888
C2717.5783958312469
C2917.7482393492988
C3117.7763888346312
C3317.8044938147649
C3517.8605710994918
C3718.2756668824971
C3918.3637694532231
C4118.8427503350966
C4319.1833260932509
C4519.2942125999734
C4719.4522466426929
C220.1990098767242
C420.6155281280883
C621.6026581725575
C821.6805727565722
C1021.7485631709315
C1221.9863528817015
C1422.128090349909
C1624.484273780375
C1825.3614182307055
C2025.6902517113128
C2225.723990775379
C2425.9770484001298
C2626.6033765389708
C2827.9593873866853
C3028.6464120961956
C3235.0363350057974
C3435.6965422288751
C3639.3756849297846
C3840.0275979395902
C4043.2139278345544
C4243.7545419852259
C4449.393967125689
C4691.5540271681304

\begin{tabular}{lllllllll}
\hline
Summary of Dendrogram \tabularnewline
Label & Height \tabularnewline
C1 & 14.8323969741913 \tabularnewline
C3 & 15.0558676752696 \tabularnewline
C5 & 15.5884572681199 \tabularnewline
C7 & 15.7162336455017 \tabularnewline
C9 & 15.9059737205869 \tabularnewline
C11 & 16.431676725155 \tabularnewline
C13 & 16.6099313760247 \tabularnewline
C15 & 16.6733320005331 \tabularnewline
C17 & 16.8226038412607 \tabularnewline
C19 & 17.1478745197249 \tabularnewline
C21 & 17.2916164657906 \tabularnewline
C23 & 17.2916164657906 \tabularnewline
C25 & 17.3205080756888 \tabularnewline
C27 & 17.5783958312469 \tabularnewline
C29 & 17.7482393492988 \tabularnewline
C31 & 17.7763888346312 \tabularnewline
C33 & 17.8044938147649 \tabularnewline
C35 & 17.8605710994918 \tabularnewline
C37 & 18.2756668824971 \tabularnewline
C39 & 18.3637694532231 \tabularnewline
C41 & 18.8427503350966 \tabularnewline
C43 & 19.1833260932509 \tabularnewline
C45 & 19.2942125999734 \tabularnewline
C47 & 19.4522466426929 \tabularnewline
C2 & 20.1990098767242 \tabularnewline
C4 & 20.6155281280883 \tabularnewline
C6 & 21.6026581725575 \tabularnewline
C8 & 21.6805727565722 \tabularnewline
C10 & 21.7485631709315 \tabularnewline
C12 & 21.9863528817015 \tabularnewline
C14 & 22.128090349909 \tabularnewline
C16 & 24.484273780375 \tabularnewline
C18 & 25.3614182307055 \tabularnewline
C20 & 25.6902517113128 \tabularnewline
C22 & 25.723990775379 \tabularnewline
C24 & 25.9770484001298 \tabularnewline
C26 & 26.6033765389708 \tabularnewline
C28 & 27.9593873866853 \tabularnewline
C30 & 28.6464120961956 \tabularnewline
C32 & 35.0363350057974 \tabularnewline
C34 & 35.6965422288751 \tabularnewline
C36 & 39.3756849297846 \tabularnewline
C38 & 40.0275979395902 \tabularnewline
C40 & 43.2139278345544 \tabularnewline
C42 & 43.7545419852259 \tabularnewline
C44 & 49.393967125689 \tabularnewline
C46 & 91.5540271681304 \tabularnewline
\hline
\end{tabular}
%Source: https://freestatistics.org/blog/index.php?pk=167273&T=1

[TABLE]
[ROW][C]Summary of Dendrogram[/C][/ROW]
[ROW][C]Label[/C][C]Height[/C][/ROW]
[ROW][C]C1[/C][C]14.8323969741913[/C][/ROW]
[ROW][C]C3[/C][C]15.0558676752696[/C][/ROW]
[ROW][C]C5[/C][C]15.5884572681199[/C][/ROW]
[ROW][C]C7[/C][C]15.7162336455017[/C][/ROW]
[ROW][C]C9[/C][C]15.9059737205869[/C][/ROW]
[ROW][C]C11[/C][C]16.431676725155[/C][/ROW]
[ROW][C]C13[/C][C]16.6099313760247[/C][/ROW]
[ROW][C]C15[/C][C]16.6733320005331[/C][/ROW]
[ROW][C]C17[/C][C]16.8226038412607[/C][/ROW]
[ROW][C]C19[/C][C]17.1478745197249[/C][/ROW]
[ROW][C]C21[/C][C]17.2916164657906[/C][/ROW]
[ROW][C]C23[/C][C]17.2916164657906[/C][/ROW]
[ROW][C]C25[/C][C]17.3205080756888[/C][/ROW]
[ROW][C]C27[/C][C]17.5783958312469[/C][/ROW]
[ROW][C]C29[/C][C]17.7482393492988[/C][/ROW]
[ROW][C]C31[/C][C]17.7763888346312[/C][/ROW]
[ROW][C]C33[/C][C]17.8044938147649[/C][/ROW]
[ROW][C]C35[/C][C]17.8605710994918[/C][/ROW]
[ROW][C]C37[/C][C]18.2756668824971[/C][/ROW]
[ROW][C]C39[/C][C]18.3637694532231[/C][/ROW]
[ROW][C]C41[/C][C]18.8427503350966[/C][/ROW]
[ROW][C]C43[/C][C]19.1833260932509[/C][/ROW]
[ROW][C]C45[/C][C]19.2942125999734[/C][/ROW]
[ROW][C]C47[/C][C]19.4522466426929[/C][/ROW]
[ROW][C]C2[/C][C]20.1990098767242[/C][/ROW]
[ROW][C]C4[/C][C]20.6155281280883[/C][/ROW]
[ROW][C]C6[/C][C]21.6026581725575[/C][/ROW]
[ROW][C]C8[/C][C]21.6805727565722[/C][/ROW]
[ROW][C]C10[/C][C]21.7485631709315[/C][/ROW]
[ROW][C]C12[/C][C]21.9863528817015[/C][/ROW]
[ROW][C]C14[/C][C]22.128090349909[/C][/ROW]
[ROW][C]C16[/C][C]24.484273780375[/C][/ROW]
[ROW][C]C18[/C][C]25.3614182307055[/C][/ROW]
[ROW][C]C20[/C][C]25.6902517113128[/C][/ROW]
[ROW][C]C22[/C][C]25.723990775379[/C][/ROW]
[ROW][C]C24[/C][C]25.9770484001298[/C][/ROW]
[ROW][C]C26[/C][C]26.6033765389708[/C][/ROW]
[ROW][C]C28[/C][C]27.9593873866853[/C][/ROW]
[ROW][C]C30[/C][C]28.6464120961956[/C][/ROW]
[ROW][C]C32[/C][C]35.0363350057974[/C][/ROW]
[ROW][C]C34[/C][C]35.6965422288751[/C][/ROW]
[ROW][C]C36[/C][C]39.3756849297846[/C][/ROW]
[ROW][C]C38[/C][C]40.0275979395902[/C][/ROW]
[ROW][C]C40[/C][C]43.2139278345544[/C][/ROW]
[ROW][C]C42[/C][C]43.7545419852259[/C][/ROW]
[ROW][C]C44[/C][C]49.393967125689[/C][/ROW]
[ROW][C]C46[/C][C]91.5540271681304[/C][/ROW]
[/TABLE]
Source: https://freestatistics.org/blog/index.php?pk=167273&T=1

Globally Unique Identifier (entire table): ba.freestatistics.org/blog/index.php?pk=167273&T=1

As an alternative you can also use a QR Code:  

The GUIDs for individual cells are displayed in the table below:

Summary of Dendrogram
LabelHeight
C114.8323969741913
C315.0558676752696
C515.5884572681199
C715.7162336455017
C915.9059737205869
C1116.431676725155
C1316.6099313760247
C1516.6733320005331
C1716.8226038412607
C1917.1478745197249
C2117.2916164657906
C2317.2916164657906
C2517.3205080756888
C2717.5783958312469
C2917.7482393492988
C3117.7763888346312
C3317.8044938147649
C3517.8605710994918
C3718.2756668824971
C3918.3637694532231
C4118.8427503350966
C4319.1833260932509
C4519.2942125999734
C4719.4522466426929
C220.1990098767242
C420.6155281280883
C621.6026581725575
C821.6805727565722
C1021.7485631709315
C1221.9863528817015
C1422.128090349909
C1624.484273780375
C1825.3614182307055
C2025.6902517113128
C2225.723990775379
C2425.9770484001298
C2626.6033765389708
C2827.9593873866853
C3028.6464120961956
C3235.0363350057974
C3435.6965422288751
C3639.3756849297846
C3840.0275979395902
C4043.2139278345544
C4243.7545419852259
C4449.393967125689
C4691.5540271681304


Parameters (Session):
par1 = ward ; par2 = ALL ; par3 = FALSE ; par4 = FALSE ; par5 = male ; par6 = all ; par7 = all ; par8 = COLLES all ; par9 = variables ;
Parameters (R input):
par1 = ward ; par2 = ALL ; par3 = FALSE ; par4 = FALSE ; par5 = male ; par6 = all ; par7 = all ; par8 = COLLES all ; par9 = variables ;
R code (references can be found in the software module):
x <- as.data.frame(read.table(file='https://automated.biganalytics.eu/download/utaut.csv',sep=',',header=T))
x$U25 <- 6-x$U25
if(par5 == 'female') x <- x[x$Gender==0,]
if(par5 == 'male') x <- x[x$Gender==1,]
if(par6 == 'prep') x <- x[x$Pop==1,]
if(par6 == 'bachelor') x <- x[x$Pop==0,]
if(par7 != 'all') {
x <- x[x$Year==as.numeric(par7),]
}
cAc <- with(x,cbind( A1, A2, A3, A4, A5, A6, A7, A8, A9,A10))
cAs <- with(x,cbind(A11,A12,A13,A14,A15,A16,A17,A18,A19,A20))
cA <- cbind(cAc,cAs)
cCa <- with(x,cbind(C1,C3,C5,C7, C9,C11,C13,C15,C17,C19,C21,C23,C25,C27,C29,C31,C33,C35,C37,C39,C41,C43,C45,C47))
cCp <- with(x,cbind(C2,C4,C6,C8,C10,C12,C14,C16,C18,C20,C22,C24,C26,C28,C30,C32,C34,C36,C38,C40,C42,C44,C46,C48))
cC <- cbind(cCa,cCp)
cU <- with(x,cbind(U1,U2,U3,U4,U5,U6,U7,U8,U9,U10,U11,U12,U13,U14,U15,U16,U17,U18,U19,U20,U21,U22,U23,U24,U25,U26,U27,U28,U29,U30,U31,U32,U33))
cE <- with(x,cbind(BC,NNZFG,MRT,AFL,LPM,LPC,W,WPA))
cX <- with(x,cbind(X1,X2,X3,X4,X5,X6,X7,X8,X9,X10,X11,X12,X13,X14,X15,X16,X17,X18))
if (par8=='ATTLES connected') x <- cAc
if (par8=='ATTLES separate') x <- cAs
if (par8=='ATTLES all') x <- cA
if (par8=='COLLES actuals') x <- cCa
if (par8=='COLLES preferred') x <- cCp
if (par8=='COLLES all') x <- cC
if (par8=='CSUQ') x <- cU
if (par8=='Learning Activities') x <- cE
if (par8=='Exam Items') x <- cX
ncol <- length(x[1,])
for (jjj in 1:ncol) {
x <- x[!is.na(x[,jjj]),]
}
par3 <- as.logical(par3)
par4 <- as.logical(par4)
if (par3 == TRUE){
dum = xlab
xlab = ylab
ylab = dum
}
if (par9=='variables') {
x <- t(x)
} else {
ncol <- length(x[1,])
colnames(x) <- 1:ncol
}
hc <- hclust(dist(x),method=par1)
d <- as.dendrogram(hc)
str(d)
mysub <- paste('Method: ',par1)
bitmap(file='test1.png')
if (par4 == TRUE){
plot(d,main=main,ylab=ylab,xlab=xlab,horiz=par3, nodePar=list(pch = c(1,NA), cex=0.8, lab.cex = 0.8),type='t',center=T, sub=mysub)
} else {
plot(d,main=main,ylab=ylab,xlab=xlab,horiz=par3, nodePar=list(pch = c(1,NA), cex=0.8, lab.cex = 0.8), sub=mysub)
}
dev.off()
if (par2 != 'ALL'){
if (par3 == TRUE){
ylab = 'cluster'
} else {
xlab = 'cluster'
}
par2 <- as.numeric(par2)
memb <- cutree(hc, k = par2)
cent <- NULL
for(k in 1:par2){
cent <- rbind(cent, colMeans(x[memb == k, , drop = FALSE]))
}
hc1 <- hclust(dist(cent),method=par1, members = table(memb))
de <- as.dendrogram(hc1)
bitmap(file='test2.png')
if (par4 == TRUE){
plot(de,main=main,ylab=ylab,xlab=xlab,horiz=par3, nodePar=list(pch = c(1,NA), cex=0.8, lab.cex = 0.8),type='t',center=T, sub=mysub)
} else {
plot(de,main=main,ylab=ylab,xlab=xlab,horiz=par3, nodePar=list(pch = c(1,NA), cex=0.8, lab.cex = 0.8), sub=mysub)
}
dev.off()
str(de)
}
load(file='createtable')
a<-table.start()
a<-table.row.start(a)
a<-table.element(a,'Summary of Dendrogram',2,TRUE)
a<-table.row.end(a)
a<-table.row.start(a)
a<-table.element(a,'Label',header=TRUE)
a<-table.element(a,'Height',header=TRUE)
a<-table.row.end(a)
num <- length(x[,1])-1
for (i in 1:num)
{
a<-table.row.start(a)
a<-table.element(a,hc$labels[i])
a<-table.element(a,hc$height[i])
a<-table.row.end(a)
}
a<-table.end(a)
table.save(a,file='mytable1.tab')
if (par2 != 'ALL'){
a<-table.start()
a<-table.row.start(a)
a<-table.element(a,'Summary of Cut Dendrogram',2,TRUE)
a<-table.row.end(a)
a<-table.row.start(a)
a<-table.element(a,'Label',header=TRUE)
a<-table.element(a,'Height',header=TRUE)
a<-table.row.end(a)
num <- par2-1
for (i in 1:num)
{
a<-table.row.start(a)
a<-table.element(a,i)
a<-table.element(a,hc1$height[i])
a<-table.row.end(a)
}
a<-table.end(a)
table.save(a,file='mytable2.tab')
}