Free Statistics

of Irreproducible Research!

Author's title

Author*The author of this computation has been verified*
R Software Modulerwasp_hierarchicalclusteringdm.wasp
Title produced by softwareHierarchical Clustering
Date of computationThu, 24 May 2012 05:39:58 -0400
Cite this page as followsStatistical Computations at FreeStatistics.org, Office for Research Development and Education, URL https://freestatistics.org/blog/index.php?v=date/2012/May/24/t1337852404iihbr93gz0cnck5.htm/, Retrieved Sun, 05 May 2024 17:12:19 +0000
Statistical Computations at FreeStatistics.org, Office for Research Development and Education, URL https://freestatistics.org/blog/index.php?pk=167274, Retrieved Sun, 05 May 2024 17:12:19 +0000
QR Codes:

Original text written by user:
IsPrivate?No (this computation is public)
User-defined keywords
Estimated Impact119
Family? (F = Feedback message, R = changed R code, M = changed R Module, P = changed Parameters, D = changed Data)
-     [Hierarchical Clustering] [] [2012-04-22 11:59:33] [182e2e10fa38557ff81755a04c8c64c0]
- RMPD    [Hierarchical Clustering] [] [2012-05-24 09:39:58] [aedc5b8e4f26bdca34b1a0cf88d6dfa2] [Current]
Feedback Forum

Post a new message


Summary of computational transaction
Raw Inputview raw input (R code)
Raw Outputview raw output of R engine
Computing time1 seconds
R Server'Gwilym Jenkins' @ jenkins.wessa.net

\begin{tabular}{lllllllll}
\hline
Summary of computational transaction \tabularnewline
Raw Input & view raw input (R code)  \tabularnewline
Raw Output & view raw output of R engine  \tabularnewline
Computing time & 1 seconds \tabularnewline
R Server & 'Gwilym Jenkins' @ jenkins.wessa.net \tabularnewline
\hline
\end{tabular}
%Source: https://freestatistics.org/blog/index.php?pk=167274&T=0

[TABLE]
[ROW][C]Summary of computational transaction[/C][/ROW]
[ROW][C]Raw Input[/C][C]view raw input (R code) [/C][/ROW]
[ROW][C]Raw Output[/C][C]view raw output of R engine [/C][/ROW]
[ROW][C]Computing time[/C][C]1 seconds[/C][/ROW]
[ROW][C]R Server[/C][C]'Gwilym Jenkins' @ jenkins.wessa.net[/C][/ROW]
[/TABLE]
Source: https://freestatistics.org/blog/index.php?pk=167274&T=0

Globally Unique Identifier (entire table): ba.freestatistics.org/blog/index.php?pk=167274&T=0

As an alternative you can also use a QR Code:  

The GUIDs for individual cells are displayed in the table below:

Summary of computational transaction
Raw Inputview raw input (R code)
Raw Outputview raw output of R engine
Computing time1 seconds
R Server'Gwilym Jenkins' @ jenkins.wessa.net


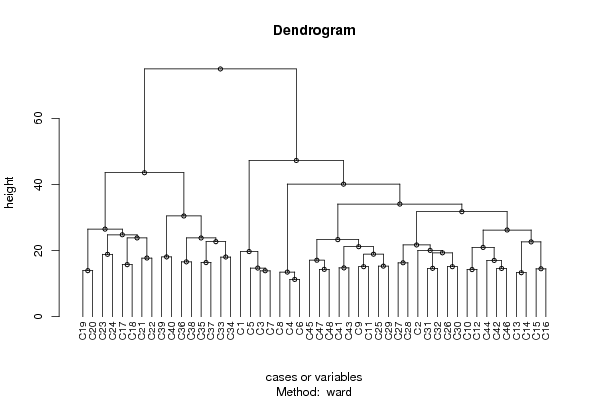
Summary of Dendrogram
LabelHeight
C111.2694276695846
C313.3041346956501
C513.4895802148428
C713.8924439894498
C913.9283882771841
C1114.247806848775
C1314.3178210632764
C1514.4913767461894
C1714.5945195193264
C1914.6287388383278
C2114.7100646638505
C2314.7648230602334
C2515.1327459504216
C2715.1327459504216
C2915.2970585407784
C3115.7480157480236
C3316.3095064303001
C3516.3707055437449
C3716.583123951777
C3917.018782172524
C4117.0817501306891
C4317.7482393492988
C4518.0554700852678
C4718.0831413200251
C218.8679622641132
C418.9125530536779
C619.3217339337558
C819.7074456136149
C1020.0568360195401
C1220.9585723095542
C1421.1775178978163
C1621.6995074512478
C1822.6277108114024
C2022.697821182888
C2223.3223360928611
C2423.8166017271198
C2623.8402399898649
C2824.7890875611148
C3026.2284376534791
C3226.4921977347733
C3430.4767280594658
C3631.768062462608
C3834.0848775485782
C4040.1131715610706
C4243.5761198201662
C4447.2750710575001
C4674.9845404252375

\begin{tabular}{lllllllll}
\hline
Summary of Dendrogram \tabularnewline
Label & Height \tabularnewline
C1 & 11.2694276695846 \tabularnewline
C3 & 13.3041346956501 \tabularnewline
C5 & 13.4895802148428 \tabularnewline
C7 & 13.8924439894498 \tabularnewline
C9 & 13.9283882771841 \tabularnewline
C11 & 14.247806848775 \tabularnewline
C13 & 14.3178210632764 \tabularnewline
C15 & 14.4913767461894 \tabularnewline
C17 & 14.5945195193264 \tabularnewline
C19 & 14.6287388383278 \tabularnewline
C21 & 14.7100646638505 \tabularnewline
C23 & 14.7648230602334 \tabularnewline
C25 & 15.1327459504216 \tabularnewline
C27 & 15.1327459504216 \tabularnewline
C29 & 15.2970585407784 \tabularnewline
C31 & 15.7480157480236 \tabularnewline
C33 & 16.3095064303001 \tabularnewline
C35 & 16.3707055437449 \tabularnewline
C37 & 16.583123951777 \tabularnewline
C39 & 17.018782172524 \tabularnewline
C41 & 17.0817501306891 \tabularnewline
C43 & 17.7482393492988 \tabularnewline
C45 & 18.0554700852678 \tabularnewline
C47 & 18.0831413200251 \tabularnewline
C2 & 18.8679622641132 \tabularnewline
C4 & 18.9125530536779 \tabularnewline
C6 & 19.3217339337558 \tabularnewline
C8 & 19.7074456136149 \tabularnewline
C10 & 20.0568360195401 \tabularnewline
C12 & 20.9585723095542 \tabularnewline
C14 & 21.1775178978163 \tabularnewline
C16 & 21.6995074512478 \tabularnewline
C18 & 22.6277108114024 \tabularnewline
C20 & 22.697821182888 \tabularnewline
C22 & 23.3223360928611 \tabularnewline
C24 & 23.8166017271198 \tabularnewline
C26 & 23.8402399898649 \tabularnewline
C28 & 24.7890875611148 \tabularnewline
C30 & 26.2284376534791 \tabularnewline
C32 & 26.4921977347733 \tabularnewline
C34 & 30.4767280594658 \tabularnewline
C36 & 31.768062462608 \tabularnewline
C38 & 34.0848775485782 \tabularnewline
C40 & 40.1131715610706 \tabularnewline
C42 & 43.5761198201662 \tabularnewline
C44 & 47.2750710575001 \tabularnewline
C46 & 74.9845404252375 \tabularnewline
\hline
\end{tabular}
%Source: https://freestatistics.org/blog/index.php?pk=167274&T=1

[TABLE]
[ROW][C]Summary of Dendrogram[/C][/ROW]
[ROW][C]Label[/C][C]Height[/C][/ROW]
[ROW][C]C1[/C][C]11.2694276695846[/C][/ROW]
[ROW][C]C3[/C][C]13.3041346956501[/C][/ROW]
[ROW][C]C5[/C][C]13.4895802148428[/C][/ROW]
[ROW][C]C7[/C][C]13.8924439894498[/C][/ROW]
[ROW][C]C9[/C][C]13.9283882771841[/C][/ROW]
[ROW][C]C11[/C][C]14.247806848775[/C][/ROW]
[ROW][C]C13[/C][C]14.3178210632764[/C][/ROW]
[ROW][C]C15[/C][C]14.4913767461894[/C][/ROW]
[ROW][C]C17[/C][C]14.5945195193264[/C][/ROW]
[ROW][C]C19[/C][C]14.6287388383278[/C][/ROW]
[ROW][C]C21[/C][C]14.7100646638505[/C][/ROW]
[ROW][C]C23[/C][C]14.7648230602334[/C][/ROW]
[ROW][C]C25[/C][C]15.1327459504216[/C][/ROW]
[ROW][C]C27[/C][C]15.1327459504216[/C][/ROW]
[ROW][C]C29[/C][C]15.2970585407784[/C][/ROW]
[ROW][C]C31[/C][C]15.7480157480236[/C][/ROW]
[ROW][C]C33[/C][C]16.3095064303001[/C][/ROW]
[ROW][C]C35[/C][C]16.3707055437449[/C][/ROW]
[ROW][C]C37[/C][C]16.583123951777[/C][/ROW]
[ROW][C]C39[/C][C]17.018782172524[/C][/ROW]
[ROW][C]C41[/C][C]17.0817501306891[/C][/ROW]
[ROW][C]C43[/C][C]17.7482393492988[/C][/ROW]
[ROW][C]C45[/C][C]18.0554700852678[/C][/ROW]
[ROW][C]C47[/C][C]18.0831413200251[/C][/ROW]
[ROW][C]C2[/C][C]18.8679622641132[/C][/ROW]
[ROW][C]C4[/C][C]18.9125530536779[/C][/ROW]
[ROW][C]C6[/C][C]19.3217339337558[/C][/ROW]
[ROW][C]C8[/C][C]19.7074456136149[/C][/ROW]
[ROW][C]C10[/C][C]20.0568360195401[/C][/ROW]
[ROW][C]C12[/C][C]20.9585723095542[/C][/ROW]
[ROW][C]C14[/C][C]21.1775178978163[/C][/ROW]
[ROW][C]C16[/C][C]21.6995074512478[/C][/ROW]
[ROW][C]C18[/C][C]22.6277108114024[/C][/ROW]
[ROW][C]C20[/C][C]22.697821182888[/C][/ROW]
[ROW][C]C22[/C][C]23.3223360928611[/C][/ROW]
[ROW][C]C24[/C][C]23.8166017271198[/C][/ROW]
[ROW][C]C26[/C][C]23.8402399898649[/C][/ROW]
[ROW][C]C28[/C][C]24.7890875611148[/C][/ROW]
[ROW][C]C30[/C][C]26.2284376534791[/C][/ROW]
[ROW][C]C32[/C][C]26.4921977347733[/C][/ROW]
[ROW][C]C34[/C][C]30.4767280594658[/C][/ROW]
[ROW][C]C36[/C][C]31.768062462608[/C][/ROW]
[ROW][C]C38[/C][C]34.0848775485782[/C][/ROW]
[ROW][C]C40[/C][C]40.1131715610706[/C][/ROW]
[ROW][C]C42[/C][C]43.5761198201662[/C][/ROW]
[ROW][C]C44[/C][C]47.2750710575001[/C][/ROW]
[ROW][C]C46[/C][C]74.9845404252375[/C][/ROW]
[/TABLE]
Source: https://freestatistics.org/blog/index.php?pk=167274&T=1

Globally Unique Identifier (entire table): ba.freestatistics.org/blog/index.php?pk=167274&T=1

As an alternative you can also use a QR Code:  

The GUIDs for individual cells are displayed in the table below:

Summary of Dendrogram
LabelHeight
C111.2694276695846
C313.3041346956501
C513.4895802148428
C713.8924439894498
C913.9283882771841
C1114.247806848775
C1314.3178210632764
C1514.4913767461894
C1714.5945195193264
C1914.6287388383278
C2114.7100646638505
C2314.7648230602334
C2515.1327459504216
C2715.1327459504216
C2915.2970585407784
C3115.7480157480236
C3316.3095064303001
C3516.3707055437449
C3716.583123951777
C3917.018782172524
C4117.0817501306891
C4317.7482393492988
C4518.0554700852678
C4718.0831413200251
C218.8679622641132
C418.9125530536779
C619.3217339337558
C819.7074456136149
C1020.0568360195401
C1220.9585723095542
C1421.1775178978163
C1621.6995074512478
C1822.6277108114024
C2022.697821182888
C2223.3223360928611
C2423.8166017271198
C2623.8402399898649
C2824.7890875611148
C3026.2284376534791
C3226.4921977347733
C3430.4767280594658
C3631.768062462608
C3834.0848775485782
C4040.1131715610706
C4243.5761198201662
C4447.2750710575001
C4674.9845404252375


Parameters (Session):
par1 = ward ; par2 = ALL ; par3 = FALSE ; par4 = FALSE ; par5 = female ; par6 = all ; par7 = all ; par8 = COLLES all ; par9 = variables ;
Parameters (R input):
par1 = ward ; par2 = ALL ; par3 = FALSE ; par4 = FALSE ; par5 = female ; par6 = all ; par7 = all ; par8 = COLLES all ; par9 = variables ;
R code (references can be found in the software module):
x <- as.data.frame(read.table(file='https://automated.biganalytics.eu/download/utaut.csv',sep=',',header=T))
x$U25 <- 6-x$U25
if(par5 == 'female') x <- x[x$Gender==0,]
if(par5 == 'male') x <- x[x$Gender==1,]
if(par6 == 'prep') x <- x[x$Pop==1,]
if(par6 == 'bachelor') x <- x[x$Pop==0,]
if(par7 != 'all') {
x <- x[x$Year==as.numeric(par7),]
}
cAc <- with(x,cbind( A1, A2, A3, A4, A5, A6, A7, A8, A9,A10))
cAs <- with(x,cbind(A11,A12,A13,A14,A15,A16,A17,A18,A19,A20))
cA <- cbind(cAc,cAs)
cCa <- with(x,cbind(C1,C3,C5,C7, C9,C11,C13,C15,C17,C19,C21,C23,C25,C27,C29,C31,C33,C35,C37,C39,C41,C43,C45,C47))
cCp <- with(x,cbind(C2,C4,C6,C8,C10,C12,C14,C16,C18,C20,C22,C24,C26,C28,C30,C32,C34,C36,C38,C40,C42,C44,C46,C48))
cC <- cbind(cCa,cCp)
cU <- with(x,cbind(U1,U2,U3,U4,U5,U6,U7,U8,U9,U10,U11,U12,U13,U14,U15,U16,U17,U18,U19,U20,U21,U22,U23,U24,U25,U26,U27,U28,U29,U30,U31,U32,U33))
cE <- with(x,cbind(BC,NNZFG,MRT,AFL,LPM,LPC,W,WPA))
cX <- with(x,cbind(X1,X2,X3,X4,X5,X6,X7,X8,X9,X10,X11,X12,X13,X14,X15,X16,X17,X18))
if (par8=='ATTLES connected') x <- cAc
if (par8=='ATTLES separate') x <- cAs
if (par8=='ATTLES all') x <- cA
if (par8=='COLLES actuals') x <- cCa
if (par8=='COLLES preferred') x <- cCp
if (par8=='COLLES all') x <- cC
if (par8=='CSUQ') x <- cU
if (par8=='Learning Activities') x <- cE
if (par8=='Exam Items') x <- cX
ncol <- length(x[1,])
for (jjj in 1:ncol) {
x <- x[!is.na(x[,jjj]),]
}
par3 <- as.logical(par3)
par4 <- as.logical(par4)
if (par3 == TRUE){
dum = xlab
xlab = ylab
ylab = dum
}
if (par9=='variables') {
x <- t(x)
} else {
ncol <- length(x[1,])
colnames(x) <- 1:ncol
}
hc <- hclust(dist(x),method=par1)
d <- as.dendrogram(hc)
str(d)
mysub <- paste('Method: ',par1)
bitmap(file='test1.png')
if (par4 == TRUE){
plot(d,main=main,ylab=ylab,xlab=xlab,horiz=par3, nodePar=list(pch = c(1,NA), cex=0.8, lab.cex = 0.8),type='t',center=T, sub=mysub)
} else {
plot(d,main=main,ylab=ylab,xlab=xlab,horiz=par3, nodePar=list(pch = c(1,NA), cex=0.8, lab.cex = 0.8), sub=mysub)
}
dev.off()
if (par2 != 'ALL'){
if (par3 == TRUE){
ylab = 'cluster'
} else {
xlab = 'cluster'
}
par2 <- as.numeric(par2)
memb <- cutree(hc, k = par2)
cent <- NULL
for(k in 1:par2){
cent <- rbind(cent, colMeans(x[memb == k, , drop = FALSE]))
}
hc1 <- hclust(dist(cent),method=par1, members = table(memb))
de <- as.dendrogram(hc1)
bitmap(file='test2.png')
if (par4 == TRUE){
plot(de,main=main,ylab=ylab,xlab=xlab,horiz=par3, nodePar=list(pch = c(1,NA), cex=0.8, lab.cex = 0.8),type='t',center=T, sub=mysub)
} else {
plot(de,main=main,ylab=ylab,xlab=xlab,horiz=par3, nodePar=list(pch = c(1,NA), cex=0.8, lab.cex = 0.8), sub=mysub)
}
dev.off()
str(de)
}
load(file='createtable')
a<-table.start()
a<-table.row.start(a)
a<-table.element(a,'Summary of Dendrogram',2,TRUE)
a<-table.row.end(a)
a<-table.row.start(a)
a<-table.element(a,'Label',header=TRUE)
a<-table.element(a,'Height',header=TRUE)
a<-table.row.end(a)
num <- length(x[,1])-1
for (i in 1:num)
{
a<-table.row.start(a)
a<-table.element(a,hc$labels[i])
a<-table.element(a,hc$height[i])
a<-table.row.end(a)
}
a<-table.end(a)
table.save(a,file='mytable1.tab')
if (par2 != 'ALL'){
a<-table.start()
a<-table.row.start(a)
a<-table.element(a,'Summary of Cut Dendrogram',2,TRUE)
a<-table.row.end(a)
a<-table.row.start(a)
a<-table.element(a,'Label',header=TRUE)
a<-table.element(a,'Height',header=TRUE)
a<-table.row.end(a)
num <- par2-1
for (i in 1:num)
{
a<-table.row.start(a)
a<-table.element(a,i)
a<-table.element(a,hc1$height[i])
a<-table.row.end(a)
}
a<-table.end(a)
table.save(a,file='mytable2.tab')
}