Free Statistics

of Irreproducible Research!

Author's title

Author*Unverified author*
R Software Modulerwasp_exponentialsmoothing.wasp
Title produced by softwareExponential Smoothing
Date of computationMon, 28 May 2012 12:58:25 -0400
Cite this page as followsStatistical Computations at FreeStatistics.org, Office for Research Development and Education, URL https://freestatistics.org/blog/index.php?v=date/2012/May/28/t1338224348hniqmo3dikhnq5a.htm/, Retrieved Wed, 01 May 2024 23:20:07 +0000
Statistical Computations at FreeStatistics.org, Office for Research Development and Education, URL https://freestatistics.org/blog/index.php?pk=167841, Retrieved Wed, 01 May 2024 23:20:07 +0000
QR Codes:

Original text written by user:
IsPrivate?No (this computation is public)
User-defined keywordsKDGP2W102
Estimated Impact96
Family? (F = Feedback message, R = changed R code, M = changed R Module, P = changed Parameters, D = changed Data)
-       [Exponential Smoothing] [Exponential Smoot...] [2012-05-28 16:58:25] [d41d8cd98f00b204e9800998ecf8427e] [Current]
Feedback Forum

Post a new message
Dataseries X:
15,579
16,348
15,928
16,171
15,937
15,713
15,594
15,683
16,438
17,032
17,696
17,745
19,394
20,148
20,108
18,584
18,441
18,391
19,178
18,079
18,483
19,644
19,195
19,650
20,830
23,595
22,937
21,814
21,928
21,777
21,383
21,467
22,052
22,680
24,320
24,977
25,204
25,739
26,434
27,525
30,695
32,436
30,160
30,236
31,293
31,077
32,226
33,865
32,810
32,242
32,700
32,819
33,947
34,148
35,261
39,506
41,591
39,148
41,216
40,225


Summary of computational transaction
Raw Inputview raw input (R code)
Raw Outputview raw output of R engine
Computing time2 seconds
R Server'Gertrude Mary Cox' @ cox.wessa.net

\begin{tabular}{lllllllll}
\hline
Summary of computational transaction \tabularnewline
Raw Input & view raw input (R code)  \tabularnewline
Raw Output & view raw output of R engine  \tabularnewline
Computing time & 2 seconds \tabularnewline
R Server & 'Gertrude Mary Cox' @ cox.wessa.net \tabularnewline
\hline
\end{tabular}
%Source: https://freestatistics.org/blog/index.php?pk=167841&T=0

[TABLE]
[ROW][C]Summary of computational transaction[/C][/ROW]
[ROW][C]Raw Input[/C][C]view raw input (R code) [/C][/ROW]
[ROW][C]Raw Output[/C][C]view raw output of R engine [/C][/ROW]
[ROW][C]Computing time[/C][C]2 seconds[/C][/ROW]
[ROW][C]R Server[/C][C]'Gertrude Mary Cox' @ cox.wessa.net[/C][/ROW]
[/TABLE]
Source: https://freestatistics.org/blog/index.php?pk=167841&T=0

Globally Unique Identifier (entire table): ba.freestatistics.org/blog/index.php?pk=167841&T=0

As an alternative you can also use a QR Code:  

The GUIDs for individual cells are displayed in the table below:

Summary of computational transaction
Raw Inputview raw input (R code)
Raw Outputview raw output of R engine
Computing time2 seconds
R Server'Gertrude Mary Cox' @ cox.wessa.net


Estimated Parameters of Exponential Smoothing
ParameterValue
alpha1
beta0.00387070960176997
gamma0

\begin{tabular}{lllllllll}
\hline
Estimated Parameters of Exponential Smoothing \tabularnewline
Parameter & Value \tabularnewline
alpha & 1 \tabularnewline
beta & 0.00387070960176997 \tabularnewline
gamma & 0 \tabularnewline
\hline
\end{tabular}
%Source: https://freestatistics.org/blog/index.php?pk=167841&T=1

[TABLE]
[ROW][C]Estimated Parameters of Exponential Smoothing[/C][/ROW]
[ROW][C]Parameter[/C][C]Value[/C][/ROW]
[ROW][C]alpha[/C][C]1[/C][/ROW]
[ROW][C]beta[/C][C]0.00387070960176997[/C][/ROW]
[ROW][C]gamma[/C][C]0[/C][/ROW]
[/TABLE]
Source: https://freestatistics.org/blog/index.php?pk=167841&T=1

Globally Unique Identifier (entire table): ba.freestatistics.org/blog/index.php?pk=167841&T=1

As an alternative you can also use a QR Code:  

The GUIDs for individual cells are displayed in the table below:

Estimated Parameters of Exponential Smoothing
ParameterValue
alpha1
beta0.00387070960176997
gamma0


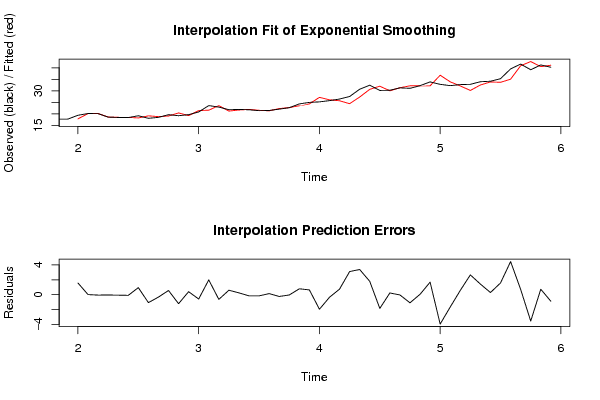
Interpolation Forecasts of Exponential Smoothing
tObservedFittedResiduals
1319.39417.82023183452911.57376816547088
1420.14820.13353338471870.0144666152812576
1520.10820.1633799151727-0.0553799151727219
1618.58418.6255191063339-0.0415191063338938
1718.44118.503881064581-0.0628810645810276
1818.39118.4814735669015-0.0904735669014798
1919.17818.22690916908570.951090830914325
2018.07919.1462525094123-1.06725250941227
2118.48318.8066105053578-0.32361050535777
2219.64419.07687827719760.567121722802447
2319.19520.4090165498728-1.21401654987283
2419.6519.24476803897570.405231961024263
2520.8321.4153987252728-0.585398725272849
2623.59521.5987941752451.996205824755
2722.93723.5705252231181-0.633525223118049
2821.81421.21219457965270.601805420347276
2921.92821.68161555575810.246384444241926
3021.77721.935924083957-0.158924083956965
3121.38321.5442530707898-0.16125307078984
3221.46721.32017578522050.146824214779482
3322.05222.291793787028-0.239793787028038
3422.6822.7198784215574-0.0398784215574359
3524.3223.52775394570960.79224605429042
3624.97724.33046927986270.646530720137342
3725.20427.1638776204566-1.95987762045663
3825.73926.0863447627398-0.347344762739834
3926.43425.68511159792490.748888402075121
4027.52524.41208259996363.11291740003644
4130.69527.30824437532443.38675562467565
4232.43630.63687571681651.79912428318352
4330.1632.0090649941266-1.84906499412657
4430.23630.0035271035980.232472896402008
4531.29331.3285161460034-0.0355161460034097
4631.07732.1689369749665-1.09193697496649
4732.22632.17236243490640.0536375650936378
4833.86532.1810451352111.68395486478902
4932.8136.7621676062264-3.95216760622635
5032.24233.8978588269265-1.65585882692645
5132.732.12233255857270.577667441427273
5232.81930.15347950564782.66552049435221
5333.94732.52233229595321.42466770404678
5434.14833.85674936199160.291250638008449
5535.26133.68021686210761.58078313789236
5639.50635.04503752551444.46096247448556
5741.59140.88154737533820.709452624661772
5839.14842.6994497088011-3.55144970880112
5941.21640.48024709056170.735752909438261
6040.22541.1089674192379-0.883967419237869

\begin{tabular}{lllllllll}
\hline
Interpolation Forecasts of Exponential Smoothing \tabularnewline
t & Observed & Fitted & Residuals \tabularnewline
13 & 19.394 & 17.8202318345291 & 1.57376816547088 \tabularnewline
14 & 20.148 & 20.1335333847187 & 0.0144666152812576 \tabularnewline
15 & 20.108 & 20.1633799151727 & -0.0553799151727219 \tabularnewline
16 & 18.584 & 18.6255191063339 & -0.0415191063338938 \tabularnewline
17 & 18.441 & 18.503881064581 & -0.0628810645810276 \tabularnewline
18 & 18.391 & 18.4814735669015 & -0.0904735669014798 \tabularnewline
19 & 19.178 & 18.2269091690857 & 0.951090830914325 \tabularnewline
20 & 18.079 & 19.1462525094123 & -1.06725250941227 \tabularnewline
21 & 18.483 & 18.8066105053578 & -0.32361050535777 \tabularnewline
22 & 19.644 & 19.0768782771976 & 0.567121722802447 \tabularnewline
23 & 19.195 & 20.4090165498728 & -1.21401654987283 \tabularnewline
24 & 19.65 & 19.2447680389757 & 0.405231961024263 \tabularnewline
25 & 20.83 & 21.4153987252728 & -0.585398725272849 \tabularnewline
26 & 23.595 & 21.598794175245 & 1.996205824755 \tabularnewline
27 & 22.937 & 23.5705252231181 & -0.633525223118049 \tabularnewline
28 & 21.814 & 21.2121945796527 & 0.601805420347276 \tabularnewline
29 & 21.928 & 21.6816155557581 & 0.246384444241926 \tabularnewline
30 & 21.777 & 21.935924083957 & -0.158924083956965 \tabularnewline
31 & 21.383 & 21.5442530707898 & -0.16125307078984 \tabularnewline
32 & 21.467 & 21.3201757852205 & 0.146824214779482 \tabularnewline
33 & 22.052 & 22.291793787028 & -0.239793787028038 \tabularnewline
34 & 22.68 & 22.7198784215574 & -0.0398784215574359 \tabularnewline
35 & 24.32 & 23.5277539457096 & 0.79224605429042 \tabularnewline
36 & 24.977 & 24.3304692798627 & 0.646530720137342 \tabularnewline
37 & 25.204 & 27.1638776204566 & -1.95987762045663 \tabularnewline
38 & 25.739 & 26.0863447627398 & -0.347344762739834 \tabularnewline
39 & 26.434 & 25.6851115979249 & 0.748888402075121 \tabularnewline
40 & 27.525 & 24.4120825999636 & 3.11291740003644 \tabularnewline
41 & 30.695 & 27.3082443753244 & 3.38675562467565 \tabularnewline
42 & 32.436 & 30.6368757168165 & 1.79912428318352 \tabularnewline
43 & 30.16 & 32.0090649941266 & -1.84906499412657 \tabularnewline
44 & 30.236 & 30.003527103598 & 0.232472896402008 \tabularnewline
45 & 31.293 & 31.3285161460034 & -0.0355161460034097 \tabularnewline
46 & 31.077 & 32.1689369749665 & -1.09193697496649 \tabularnewline
47 & 32.226 & 32.1723624349064 & 0.0536375650936378 \tabularnewline
48 & 33.865 & 32.181045135211 & 1.68395486478902 \tabularnewline
49 & 32.81 & 36.7621676062264 & -3.95216760622635 \tabularnewline
50 & 32.242 & 33.8978588269265 & -1.65585882692645 \tabularnewline
51 & 32.7 & 32.1223325585727 & 0.577667441427273 \tabularnewline
52 & 32.819 & 30.1534795056478 & 2.66552049435221 \tabularnewline
53 & 33.947 & 32.5223322959532 & 1.42466770404678 \tabularnewline
54 & 34.148 & 33.8567493619916 & 0.291250638008449 \tabularnewline
55 & 35.261 & 33.6802168621076 & 1.58078313789236 \tabularnewline
56 & 39.506 & 35.0450375255144 & 4.46096247448556 \tabularnewline
57 & 41.591 & 40.8815473753382 & 0.709452624661772 \tabularnewline
58 & 39.148 & 42.6994497088011 & -3.55144970880112 \tabularnewline
59 & 41.216 & 40.4802470905617 & 0.735752909438261 \tabularnewline
60 & 40.225 & 41.1089674192379 & -0.883967419237869 \tabularnewline
\hline
\end{tabular}
%Source: https://freestatistics.org/blog/index.php?pk=167841&T=2

[TABLE]
[ROW][C]Interpolation Forecasts of Exponential Smoothing[/C][/ROW]
[ROW][C]t[/C][C]Observed[/C][C]Fitted[/C][C]Residuals[/C][/ROW]
[ROW][C]13[/C][C]19.394[/C][C]17.8202318345291[/C][C]1.57376816547088[/C][/ROW]
[ROW][C]14[/C][C]20.148[/C][C]20.1335333847187[/C][C]0.0144666152812576[/C][/ROW]
[ROW][C]15[/C][C]20.108[/C][C]20.1633799151727[/C][C]-0.0553799151727219[/C][/ROW]
[ROW][C]16[/C][C]18.584[/C][C]18.6255191063339[/C][C]-0.0415191063338938[/C][/ROW]
[ROW][C]17[/C][C]18.441[/C][C]18.503881064581[/C][C]-0.0628810645810276[/C][/ROW]
[ROW][C]18[/C][C]18.391[/C][C]18.4814735669015[/C][C]-0.0904735669014798[/C][/ROW]
[ROW][C]19[/C][C]19.178[/C][C]18.2269091690857[/C][C]0.951090830914325[/C][/ROW]
[ROW][C]20[/C][C]18.079[/C][C]19.1462525094123[/C][C]-1.06725250941227[/C][/ROW]
[ROW][C]21[/C][C]18.483[/C][C]18.8066105053578[/C][C]-0.32361050535777[/C][/ROW]
[ROW][C]22[/C][C]19.644[/C][C]19.0768782771976[/C][C]0.567121722802447[/C][/ROW]
[ROW][C]23[/C][C]19.195[/C][C]20.4090165498728[/C][C]-1.21401654987283[/C][/ROW]
[ROW][C]24[/C][C]19.65[/C][C]19.2447680389757[/C][C]0.405231961024263[/C][/ROW]
[ROW][C]25[/C][C]20.83[/C][C]21.4153987252728[/C][C]-0.585398725272849[/C][/ROW]
[ROW][C]26[/C][C]23.595[/C][C]21.598794175245[/C][C]1.996205824755[/C][/ROW]
[ROW][C]27[/C][C]22.937[/C][C]23.5705252231181[/C][C]-0.633525223118049[/C][/ROW]
[ROW][C]28[/C][C]21.814[/C][C]21.2121945796527[/C][C]0.601805420347276[/C][/ROW]
[ROW][C]29[/C][C]21.928[/C][C]21.6816155557581[/C][C]0.246384444241926[/C][/ROW]
[ROW][C]30[/C][C]21.777[/C][C]21.935924083957[/C][C]-0.158924083956965[/C][/ROW]
[ROW][C]31[/C][C]21.383[/C][C]21.5442530707898[/C][C]-0.16125307078984[/C][/ROW]
[ROW][C]32[/C][C]21.467[/C][C]21.3201757852205[/C][C]0.146824214779482[/C][/ROW]
[ROW][C]33[/C][C]22.052[/C][C]22.291793787028[/C][C]-0.239793787028038[/C][/ROW]
[ROW][C]34[/C][C]22.68[/C][C]22.7198784215574[/C][C]-0.0398784215574359[/C][/ROW]
[ROW][C]35[/C][C]24.32[/C][C]23.5277539457096[/C][C]0.79224605429042[/C][/ROW]
[ROW][C]36[/C][C]24.977[/C][C]24.3304692798627[/C][C]0.646530720137342[/C][/ROW]
[ROW][C]37[/C][C]25.204[/C][C]27.1638776204566[/C][C]-1.95987762045663[/C][/ROW]
[ROW][C]38[/C][C]25.739[/C][C]26.0863447627398[/C][C]-0.347344762739834[/C][/ROW]
[ROW][C]39[/C][C]26.434[/C][C]25.6851115979249[/C][C]0.748888402075121[/C][/ROW]
[ROW][C]40[/C][C]27.525[/C][C]24.4120825999636[/C][C]3.11291740003644[/C][/ROW]
[ROW][C]41[/C][C]30.695[/C][C]27.3082443753244[/C][C]3.38675562467565[/C][/ROW]
[ROW][C]42[/C][C]32.436[/C][C]30.6368757168165[/C][C]1.79912428318352[/C][/ROW]
[ROW][C]43[/C][C]30.16[/C][C]32.0090649941266[/C][C]-1.84906499412657[/C][/ROW]
[ROW][C]44[/C][C]30.236[/C][C]30.003527103598[/C][C]0.232472896402008[/C][/ROW]
[ROW][C]45[/C][C]31.293[/C][C]31.3285161460034[/C][C]-0.0355161460034097[/C][/ROW]
[ROW][C]46[/C][C]31.077[/C][C]32.1689369749665[/C][C]-1.09193697496649[/C][/ROW]
[ROW][C]47[/C][C]32.226[/C][C]32.1723624349064[/C][C]0.0536375650936378[/C][/ROW]
[ROW][C]48[/C][C]33.865[/C][C]32.181045135211[/C][C]1.68395486478902[/C][/ROW]
[ROW][C]49[/C][C]32.81[/C][C]36.7621676062264[/C][C]-3.95216760622635[/C][/ROW]
[ROW][C]50[/C][C]32.242[/C][C]33.8978588269265[/C][C]-1.65585882692645[/C][/ROW]
[ROW][C]51[/C][C]32.7[/C][C]32.1223325585727[/C][C]0.577667441427273[/C][/ROW]
[ROW][C]52[/C][C]32.819[/C][C]30.1534795056478[/C][C]2.66552049435221[/C][/ROW]
[ROW][C]53[/C][C]33.947[/C][C]32.5223322959532[/C][C]1.42466770404678[/C][/ROW]
[ROW][C]54[/C][C]34.148[/C][C]33.8567493619916[/C][C]0.291250638008449[/C][/ROW]
[ROW][C]55[/C][C]35.261[/C][C]33.6802168621076[/C][C]1.58078313789236[/C][/ROW]
[ROW][C]56[/C][C]39.506[/C][C]35.0450375255144[/C][C]4.46096247448556[/C][/ROW]
[ROW][C]57[/C][C]41.591[/C][C]40.8815473753382[/C][C]0.709452624661772[/C][/ROW]
[ROW][C]58[/C][C]39.148[/C][C]42.6994497088011[/C][C]-3.55144970880112[/C][/ROW]
[ROW][C]59[/C][C]41.216[/C][C]40.4802470905617[/C][C]0.735752909438261[/C][/ROW]
[ROW][C]60[/C][C]40.225[/C][C]41.1089674192379[/C][C]-0.883967419237869[/C][/ROW]
[/TABLE]
Source: https://freestatistics.org/blog/index.php?pk=167841&T=2

Globally Unique Identifier (entire table): ba.freestatistics.org/blog/index.php?pk=167841&T=2

As an alternative you can also use a QR Code:  

The GUIDs for individual cells are displayed in the table below:

Interpolation Forecasts of Exponential Smoothing
tObservedFittedResiduals
1319.39417.82023183452911.57376816547088
1420.14820.13353338471870.0144666152812576
1520.10820.1633799151727-0.0553799151727219
1618.58418.6255191063339-0.0415191063338938
1718.44118.503881064581-0.0628810645810276
1818.39118.4814735669015-0.0904735669014798
1919.17818.22690916908570.951090830914325
2018.07919.1462525094123-1.06725250941227
2118.48318.8066105053578-0.32361050535777
2219.64419.07687827719760.567121722802447
2319.19520.4090165498728-1.21401654987283
2419.6519.24476803897570.405231961024263
2520.8321.4153987252728-0.585398725272849
2623.59521.5987941752451.996205824755
2722.93723.5705252231181-0.633525223118049
2821.81421.21219457965270.601805420347276
2921.92821.68161555575810.246384444241926
3021.77721.935924083957-0.158924083956965
3121.38321.5442530707898-0.16125307078984
3221.46721.32017578522050.146824214779482
3322.05222.291793787028-0.239793787028038
3422.6822.7198784215574-0.0398784215574359
3524.3223.52775394570960.79224605429042
3624.97724.33046927986270.646530720137342
3725.20427.1638776204566-1.95987762045663
3825.73926.0863447627398-0.347344762739834
3926.43425.68511159792490.748888402075121
4027.52524.41208259996363.11291740003644
4130.69527.30824437532443.38675562467565
4232.43630.63687571681651.79912428318352
4330.1632.0090649941266-1.84906499412657
4430.23630.0035271035980.232472896402008
4531.29331.3285161460034-0.0355161460034097
4631.07732.1689369749665-1.09193697496649
4732.22632.17236243490640.0536375650936378
4833.86532.1810451352111.68395486478902
4932.8136.7621676062264-3.95216760622635
5032.24233.8978588269265-1.65585882692645
5132.732.12233255857270.577667441427273
5232.81930.15347950564782.66552049435221
5333.94732.52233229595321.42466770404678
5434.14833.85674936199160.291250638008449
5535.26133.68021686210761.58078313789236
5639.50635.04503752551444.46096247448556
5741.59140.88154737533820.709452624661772
5839.14842.6994497088011-3.55144970880112
5941.21640.48024709056170.735752909438261
6040.22541.1089674192379-0.883967419237869


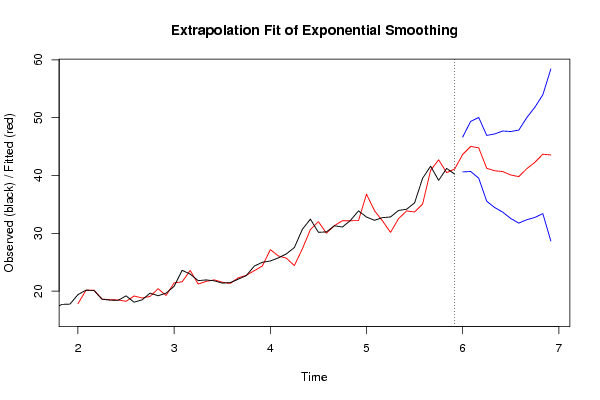
Extrapolation Forecasts of Exponential Smoothing
tForecast95% Lower Bound95% Upper Bound
6143.626142982490140.608690729584246.643595235396
6245.011052486414440.682001735623949.3401032372049
6344.77393110721539.525896548612550.0219656658176
6441.226787256777935.541457581758546.9121169317973
6540.809271208576434.437549765426447.1809926517265
6640.663262212406633.649661770653647.6768626541596
6740.071012451368932.546914651774947.5951102509629
6839.797390830731431.757157230907147.8376244305557
6941.169725466256732.342646314988549.9968046175249
7042.255504443648532.72895588562651.782053001671
7143.670731404519633.397547781270253.943915027769
7243.537259621362428.661810169328558.4127090733962

\begin{tabular}{lllllllll}
\hline
Extrapolation Forecasts of Exponential Smoothing \tabularnewline
t & Forecast & 95% Lower Bound & 95% Upper Bound \tabularnewline
61 & 43.6261429824901 & 40.6086907295842 & 46.643595235396 \tabularnewline
62 & 45.0110524864144 & 40.6820017356239 & 49.3401032372049 \tabularnewline
63 & 44.773931107215 & 39.5258965486125 & 50.0219656658176 \tabularnewline
64 & 41.2267872567779 & 35.5414575817585 & 46.9121169317973 \tabularnewline
65 & 40.8092712085764 & 34.4375497654264 & 47.1809926517265 \tabularnewline
66 & 40.6632622124066 & 33.6496617706536 & 47.6768626541596 \tabularnewline
67 & 40.0710124513689 & 32.5469146517749 & 47.5951102509629 \tabularnewline
68 & 39.7973908307314 & 31.7571572309071 & 47.8376244305557 \tabularnewline
69 & 41.1697254662567 & 32.3426463149885 & 49.9968046175249 \tabularnewline
70 & 42.2555044436485 & 32.728955885626 & 51.782053001671 \tabularnewline
71 & 43.6707314045196 & 33.3975477812702 & 53.943915027769 \tabularnewline
72 & 43.5372596213624 & 28.6618101693285 & 58.4127090733962 \tabularnewline
\hline
\end{tabular}
%Source: https://freestatistics.org/blog/index.php?pk=167841&T=3

[TABLE]
[ROW][C]Extrapolation Forecasts of Exponential Smoothing[/C][/ROW]
[ROW][C]t[/C][C]Forecast[/C][C]95% Lower Bound[/C][C]95% Upper Bound[/C][/ROW]
[ROW][C]61[/C][C]43.6261429824901[/C][C]40.6086907295842[/C][C]46.643595235396[/C][/ROW]
[ROW][C]62[/C][C]45.0110524864144[/C][C]40.6820017356239[/C][C]49.3401032372049[/C][/ROW]
[ROW][C]63[/C][C]44.773931107215[/C][C]39.5258965486125[/C][C]50.0219656658176[/C][/ROW]
[ROW][C]64[/C][C]41.2267872567779[/C][C]35.5414575817585[/C][C]46.9121169317973[/C][/ROW]
[ROW][C]65[/C][C]40.8092712085764[/C][C]34.4375497654264[/C][C]47.1809926517265[/C][/ROW]
[ROW][C]66[/C][C]40.6632622124066[/C][C]33.6496617706536[/C][C]47.6768626541596[/C][/ROW]
[ROW][C]67[/C][C]40.0710124513689[/C][C]32.5469146517749[/C][C]47.5951102509629[/C][/ROW]
[ROW][C]68[/C][C]39.7973908307314[/C][C]31.7571572309071[/C][C]47.8376244305557[/C][/ROW]
[ROW][C]69[/C][C]41.1697254662567[/C][C]32.3426463149885[/C][C]49.9968046175249[/C][/ROW]
[ROW][C]70[/C][C]42.2555044436485[/C][C]32.728955885626[/C][C]51.782053001671[/C][/ROW]
[ROW][C]71[/C][C]43.6707314045196[/C][C]33.3975477812702[/C][C]53.943915027769[/C][/ROW]
[ROW][C]72[/C][C]43.5372596213624[/C][C]28.6618101693285[/C][C]58.4127090733962[/C][/ROW]
[/TABLE]
Source: https://freestatistics.org/blog/index.php?pk=167841&T=3

Globally Unique Identifier (entire table): ba.freestatistics.org/blog/index.php?pk=167841&T=3

As an alternative you can also use a QR Code:  

The GUIDs for individual cells are displayed in the table below:

Extrapolation Forecasts of Exponential Smoothing
tForecast95% Lower Bound95% Upper Bound
6143.626142982490140.608690729584246.643595235396
6245.011052486414440.682001735623949.3401032372049
6344.77393110721539.525896548612550.0219656658176
6441.226787256777935.541457581758546.9121169317973
6540.809271208576434.437549765426447.1809926517265
6640.663262212406633.649661770653647.6768626541596
6740.071012451368932.546914651774947.5951102509629
6839.797390830731431.757157230907147.8376244305557
6941.169725466256732.342646314988549.9968046175249
7042.255504443648532.72895588562651.782053001671
7143.670731404519633.397547781270253.943915027769
7243.537259621362428.661810169328558.4127090733962


Parameters (Session):
par1 = 12 ; par2 = Triple ; par3 = multiplicative ;
Parameters (R input):
par1 = 12 ; par2 = Triple ; par3 = multiplicative ;
R code (references can be found in the software module):
par1 <- as.numeric(par1)
if (par2 == 'Single') K <- 1
if (par2 == 'Double') K <- 2
if (par2 == 'Triple') K <- par1
nx <- length(x)
nxmK <- nx - K
x <- ts(x, frequency = par1)
if (par2 == 'Single') fit <- HoltWinters(x, gamma=F, beta=F)
if (par2 == 'Double') fit <- HoltWinters(x, gamma=F)
if (par2 == 'Triple') fit <- HoltWinters(x, seasonal=par3)
fit
myresid <- x - fit$fitted[,'xhat']
bitmap(file='test1.png')
op <- par(mfrow=c(2,1))
plot(fit,ylab='Observed (black) / Fitted (red)',main='Interpolation Fit of Exponential Smoothing')
plot(myresid,ylab='Residuals',main='Interpolation Prediction Errors')
par(op)
dev.off()
bitmap(file='test2.png')
p <- predict(fit, par1, prediction.interval=TRUE)
np <- length(p[,1])
plot(fit,p,ylab='Observed (black) / Fitted (red)',main='Extrapolation Fit of Exponential Smoothing')
dev.off()
bitmap(file='test3.png')
op <- par(mfrow = c(2,2))
acf(as.numeric(myresid),lag.max = nx/2,main='Residual ACF')
spectrum(myresid,main='Residals Periodogram')
cpgram(myresid,main='Residal Cumulative Periodogram')
qqnorm(myresid,main='Residual Normal QQ Plot')
qqline(myresid)
par(op)
dev.off()
load(file='createtable')
a<-table.start()
a<-table.row.start(a)
a<-table.element(a,'Estimated Parameters of Exponential Smoothing',2,TRUE)
a<-table.row.end(a)
a<-table.row.start(a)
a<-table.element(a,'Parameter',header=TRUE)
a<-table.element(a,'Value',header=TRUE)
a<-table.row.end(a)
a<-table.row.start(a)
a<-table.element(a,'alpha',header=TRUE)
a<-table.element(a,fit$alpha)
a<-table.row.end(a)
a<-table.row.start(a)
a<-table.element(a,'beta',header=TRUE)
a<-table.element(a,fit$beta)
a<-table.row.end(a)
a<-table.row.start(a)
a<-table.element(a,'gamma',header=TRUE)
a<-table.element(a,fit$gamma)
a<-table.row.end(a)
a<-table.end(a)
table.save(a,file='mytable.tab')
a<-table.start()
a<-table.row.start(a)
a<-table.element(a,'Interpolation Forecasts of Exponential Smoothing',4,TRUE)
a<-table.row.end(a)
a<-table.row.start(a)
a<-table.element(a,'t',header=TRUE)
a<-table.element(a,'Observed',header=TRUE)
a<-table.element(a,'Fitted',header=TRUE)
a<-table.element(a,'Residuals',header=TRUE)
a<-table.row.end(a)
for (i in 1:nxmK) {
a<-table.row.start(a)
a<-table.element(a,i+K,header=TRUE)
a<-table.element(a,x[i+K])
a<-table.element(a,fit$fitted[i,'xhat'])
a<-table.element(a,myresid[i])
a<-table.row.end(a)
}
a<-table.end(a)
table.save(a,file='mytable1.tab')
a<-table.start()
a<-table.row.start(a)
a<-table.element(a,'Extrapolation Forecasts of Exponential Smoothing',4,TRUE)
a<-table.row.end(a)
a<-table.row.start(a)
a<-table.element(a,'t',header=TRUE)
a<-table.element(a,'Forecast',header=TRUE)
a<-table.element(a,'95% Lower Bound',header=TRUE)
a<-table.element(a,'95% Upper Bound',header=TRUE)
a<-table.row.end(a)
for (i in 1:np) {
a<-table.row.start(a)
a<-table.element(a,nx+i,header=TRUE)
a<-table.element(a,p[i,'fit'])
a<-table.element(a,p[i,'lwr'])
a<-table.element(a,p[i,'upr'])
a<-table.row.end(a)
}
a<-table.end(a)
table.save(a,file='mytable2.tab')