Free Statistics

of Irreproducible Research!

Author's title

Author*Unverified author*
R Software Modulerwasp_autocorrelation.wasp
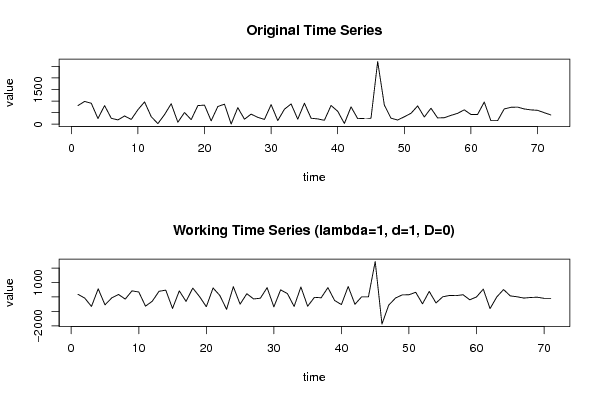
Title produced by software(Partial) Autocorrelation Function
Date of computationMon, 28 May 2012 13:22:52 -0400
Cite this page as followsStatistical Computations at FreeStatistics.org, Office for Research Development and Education, URL https://freestatistics.org/blog/index.php?v=date/2012/May/28/t1338225822xxk2ycbrzilbfy6.htm/, Retrieved Thu, 02 May 2024 07:59:26 +0000
Statistical Computations at FreeStatistics.org, Office for Research Development and Education, URL https://freestatistics.org/blog/index.php?pk=167843, Retrieved Thu, 02 May 2024 07:59:26 +0000
QR Codes:

Original text written by user:
IsPrivate?No (this computation is public)
User-defined keywords
Estimated Impact85
Family? (F = Feedback message, R = changed R code, M = changed R Module, P = changed Parameters, D = changed Data)
-     [(Partial) Autocorrelation Function] [Autoccorrelation ...] [2012-05-25 17:41:43] [6e19e206170da9d6a6e3a083e1919afa]
-   PD    [(Partial) Autocorrelation Function] [Correlatie werklo...] [2012-05-28 17:22:52] [bc909d11ab9ae813672fa3903785080c] [Current]
Feedback Forum

Post a new message
Dataseries X:
804,7
984,8
904,7
244,7
804,6
254,6
184,7
354,7
204,5
624,4
964,5
324,4
24,6
414,5
884,4
84,5
504,4
194,6
804,7
824,6
144,7
764,7
864,7
5
715
214,9
435,1
295
205,4
845,6
155,8
646,1
876,1
216,5
906,8
257,3
227,8
168,3
808,7
558,9
29,4
749,5
239,5
249,6
259,8
2710
829,9
259,9
179,7
319,8
469,8
789,9
309,6
689,4
269,5
279,6
379,5
469,5
619,8
419,4
419,1
959
148,9
149
659
729,1
739,1
659,1
619
598,9
498,7
398,5


Summary of computational transaction
Raw Inputview raw input (R code)
Raw Outputview raw output of R engine
Computing time2 seconds
R Server'Gertrude Mary Cox' @ cox.wessa.net

\begin{tabular}{lllllllll}
\hline
Summary of computational transaction \tabularnewline
Raw Input & view raw input (R code)  \tabularnewline
Raw Output & view raw output of R engine  \tabularnewline
Computing time & 2 seconds \tabularnewline
R Server & 'Gertrude Mary Cox' @ cox.wessa.net \tabularnewline
\hline
\end{tabular}
%Source: https://freestatistics.org/blog/index.php?pk=167843&T=0

[TABLE]
[ROW][C]Summary of computational transaction[/C][/ROW]
[ROW][C]Raw Input[/C][C]view raw input (R code) [/C][/ROW]
[ROW][C]Raw Output[/C][C]view raw output of R engine [/C][/ROW]
[ROW][C]Computing time[/C][C]2 seconds[/C][/ROW]
[ROW][C]R Server[/C][C]'Gertrude Mary Cox' @ cox.wessa.net[/C][/ROW]
[/TABLE]
Source: https://freestatistics.org/blog/index.php?pk=167843&T=0

Globally Unique Identifier (entire table): ba.freestatistics.org/blog/index.php?pk=167843&T=0

As an alternative you can also use a QR Code:  

The GUIDs for individual cells are displayed in the table below:

Summary of computational transaction
Raw Inputview raw input (R code)
Raw Outputview raw output of R engine
Computing time2 seconds
R Server'Gertrude Mary Cox' @ cox.wessa.net


Autocorrelation Function
Time lag kACF(k)T-STATP-value
1-0.454052-3.82590.000139
2-0.091561-0.77150.221483
30.0407640.34350.366126
40.0040810.03440.486331
50.0031220.02630.489544
6-0.043907-0.370.356254
70.0516830.43550.332264
80.0937910.79030.215993
9-0.162439-1.36870.087699
100.0649440.54720.29297
11-0.03724-0.31380.3773
120.0064730.05450.478328
130.0716490.60370.273974
14-0.028731-0.24210.404703
15-0.081176-0.6840.248101
160.154931.30550.097975
17-0.05424-0.4570.32452
18-0.135218-1.13940.129189
190.0644980.54350.294255
200.0790450.6660.25377
21-0.023014-0.19390.423397
22-0.065824-0.55460.290441
230.036990.31170.378097
240.0752780.63430.26396
25-0.05438-0.45820.324099
26-0.108149-0.91130.182615
270.1922351.61980.054854
28-0.133604-1.12580.132028
290.080030.67430.25114
30-0.110218-0.92870.178092
310.0537240.45270.326079
320.1149750.96880.167968
33-0.141722-1.19420.118192
34-0.040043-0.33740.368403
350.1180420.99460.161646
36-0.036582-0.30820.379399
370.0673410.56740.286108
38-0.098044-0.82610.205749
390.0240420.20260.42002
40-0.019622-0.16530.434575
410.0471040.39690.346313
42-0.084274-0.71010.239982
430.0645490.54390.294107
440.013010.10960.456509
45-0.010571-0.08910.464637
46-0.036026-0.30360.381175
470.0494570.41670.339065
48-0.014915-0.12570.450173

\begin{tabular}{lllllllll}
\hline
Autocorrelation Function \tabularnewline
Time lag k & ACF(k) & T-STAT & P-value \tabularnewline
1 & -0.454052 & -3.8259 & 0.000139 \tabularnewline
2 & -0.091561 & -0.7715 & 0.221483 \tabularnewline
3 & 0.040764 & 0.3435 & 0.366126 \tabularnewline
4 & 0.004081 & 0.0344 & 0.486331 \tabularnewline
5 & 0.003122 & 0.0263 & 0.489544 \tabularnewline
6 & -0.043907 & -0.37 & 0.356254 \tabularnewline
7 & 0.051683 & 0.4355 & 0.332264 \tabularnewline
8 & 0.093791 & 0.7903 & 0.215993 \tabularnewline
9 & -0.162439 & -1.3687 & 0.087699 \tabularnewline
10 & 0.064944 & 0.5472 & 0.29297 \tabularnewline
11 & -0.03724 & -0.3138 & 0.3773 \tabularnewline
12 & 0.006473 & 0.0545 & 0.478328 \tabularnewline
13 & 0.071649 & 0.6037 & 0.273974 \tabularnewline
14 & -0.028731 & -0.2421 & 0.404703 \tabularnewline
15 & -0.081176 & -0.684 & 0.248101 \tabularnewline
16 & 0.15493 & 1.3055 & 0.097975 \tabularnewline
17 & -0.05424 & -0.457 & 0.32452 \tabularnewline
18 & -0.135218 & -1.1394 & 0.129189 \tabularnewline
19 & 0.064498 & 0.5435 & 0.294255 \tabularnewline
20 & 0.079045 & 0.666 & 0.25377 \tabularnewline
21 & -0.023014 & -0.1939 & 0.423397 \tabularnewline
22 & -0.065824 & -0.5546 & 0.290441 \tabularnewline
23 & 0.03699 & 0.3117 & 0.378097 \tabularnewline
24 & 0.075278 & 0.6343 & 0.26396 \tabularnewline
25 & -0.05438 & -0.4582 & 0.324099 \tabularnewline
26 & -0.108149 & -0.9113 & 0.182615 \tabularnewline
27 & 0.192235 & 1.6198 & 0.054854 \tabularnewline
28 & -0.133604 & -1.1258 & 0.132028 \tabularnewline
29 & 0.08003 & 0.6743 & 0.25114 \tabularnewline
30 & -0.110218 & -0.9287 & 0.178092 \tabularnewline
31 & 0.053724 & 0.4527 & 0.326079 \tabularnewline
32 & 0.114975 & 0.9688 & 0.167968 \tabularnewline
33 & -0.141722 & -1.1942 & 0.118192 \tabularnewline
34 & -0.040043 & -0.3374 & 0.368403 \tabularnewline
35 & 0.118042 & 0.9946 & 0.161646 \tabularnewline
36 & -0.036582 & -0.3082 & 0.379399 \tabularnewline
37 & 0.067341 & 0.5674 & 0.286108 \tabularnewline
38 & -0.098044 & -0.8261 & 0.205749 \tabularnewline
39 & 0.024042 & 0.2026 & 0.42002 \tabularnewline
40 & -0.019622 & -0.1653 & 0.434575 \tabularnewline
41 & 0.047104 & 0.3969 & 0.346313 \tabularnewline
42 & -0.084274 & -0.7101 & 0.239982 \tabularnewline
43 & 0.064549 & 0.5439 & 0.294107 \tabularnewline
44 & 0.01301 & 0.1096 & 0.456509 \tabularnewline
45 & -0.010571 & -0.0891 & 0.464637 \tabularnewline
46 & -0.036026 & -0.3036 & 0.381175 \tabularnewline
47 & 0.049457 & 0.4167 & 0.339065 \tabularnewline
48 & -0.014915 & -0.1257 & 0.450173 \tabularnewline
\hline
\end{tabular}
%Source: https://freestatistics.org/blog/index.php?pk=167843&T=1

[TABLE]
[ROW][C]Autocorrelation Function[/C][/ROW]
[ROW][C]Time lag k[/C][C]ACF(k)[/C][C]T-STAT[/C][C]P-value[/C][/ROW]
[ROW][C]1[/C][C]-0.454052[/C][C]-3.8259[/C][C]0.000139[/C][/ROW]
[ROW][C]2[/C][C]-0.091561[/C][C]-0.7715[/C][C]0.221483[/C][/ROW]
[ROW][C]3[/C][C]0.040764[/C][C]0.3435[/C][C]0.366126[/C][/ROW]
[ROW][C]4[/C][C]0.004081[/C][C]0.0344[/C][C]0.486331[/C][/ROW]
[ROW][C]5[/C][C]0.003122[/C][C]0.0263[/C][C]0.489544[/C][/ROW]
[ROW][C]6[/C][C]-0.043907[/C][C]-0.37[/C][C]0.356254[/C][/ROW]
[ROW][C]7[/C][C]0.051683[/C][C]0.4355[/C][C]0.332264[/C][/ROW]
[ROW][C]8[/C][C]0.093791[/C][C]0.7903[/C][C]0.215993[/C][/ROW]
[ROW][C]9[/C][C]-0.162439[/C][C]-1.3687[/C][C]0.087699[/C][/ROW]
[ROW][C]10[/C][C]0.064944[/C][C]0.5472[/C][C]0.29297[/C][/ROW]
[ROW][C]11[/C][C]-0.03724[/C][C]-0.3138[/C][C]0.3773[/C][/ROW]
[ROW][C]12[/C][C]0.006473[/C][C]0.0545[/C][C]0.478328[/C][/ROW]
[ROW][C]13[/C][C]0.071649[/C][C]0.6037[/C][C]0.273974[/C][/ROW]
[ROW][C]14[/C][C]-0.028731[/C][C]-0.2421[/C][C]0.404703[/C][/ROW]
[ROW][C]15[/C][C]-0.081176[/C][C]-0.684[/C][C]0.248101[/C][/ROW]
[ROW][C]16[/C][C]0.15493[/C][C]1.3055[/C][C]0.097975[/C][/ROW]
[ROW][C]17[/C][C]-0.05424[/C][C]-0.457[/C][C]0.32452[/C][/ROW]
[ROW][C]18[/C][C]-0.135218[/C][C]-1.1394[/C][C]0.129189[/C][/ROW]
[ROW][C]19[/C][C]0.064498[/C][C]0.5435[/C][C]0.294255[/C][/ROW]
[ROW][C]20[/C][C]0.079045[/C][C]0.666[/C][C]0.25377[/C][/ROW]
[ROW][C]21[/C][C]-0.023014[/C][C]-0.1939[/C][C]0.423397[/C][/ROW]
[ROW][C]22[/C][C]-0.065824[/C][C]-0.5546[/C][C]0.290441[/C][/ROW]
[ROW][C]23[/C][C]0.03699[/C][C]0.3117[/C][C]0.378097[/C][/ROW]
[ROW][C]24[/C][C]0.075278[/C][C]0.6343[/C][C]0.26396[/C][/ROW]
[ROW][C]25[/C][C]-0.05438[/C][C]-0.4582[/C][C]0.324099[/C][/ROW]
[ROW][C]26[/C][C]-0.108149[/C][C]-0.9113[/C][C]0.182615[/C][/ROW]
[ROW][C]27[/C][C]0.192235[/C][C]1.6198[/C][C]0.054854[/C][/ROW]
[ROW][C]28[/C][C]-0.133604[/C][C]-1.1258[/C][C]0.132028[/C][/ROW]
[ROW][C]29[/C][C]0.08003[/C][C]0.6743[/C][C]0.25114[/C][/ROW]
[ROW][C]30[/C][C]-0.110218[/C][C]-0.9287[/C][C]0.178092[/C][/ROW]
[ROW][C]31[/C][C]0.053724[/C][C]0.4527[/C][C]0.326079[/C][/ROW]
[ROW][C]32[/C][C]0.114975[/C][C]0.9688[/C][C]0.167968[/C][/ROW]
[ROW][C]33[/C][C]-0.141722[/C][C]-1.1942[/C][C]0.118192[/C][/ROW]
[ROW][C]34[/C][C]-0.040043[/C][C]-0.3374[/C][C]0.368403[/C][/ROW]
[ROW][C]35[/C][C]0.118042[/C][C]0.9946[/C][C]0.161646[/C][/ROW]
[ROW][C]36[/C][C]-0.036582[/C][C]-0.3082[/C][C]0.379399[/C][/ROW]
[ROW][C]37[/C][C]0.067341[/C][C]0.5674[/C][C]0.286108[/C][/ROW]
[ROW][C]38[/C][C]-0.098044[/C][C]-0.8261[/C][C]0.205749[/C][/ROW]
[ROW][C]39[/C][C]0.024042[/C][C]0.2026[/C][C]0.42002[/C][/ROW]
[ROW][C]40[/C][C]-0.019622[/C][C]-0.1653[/C][C]0.434575[/C][/ROW]
[ROW][C]41[/C][C]0.047104[/C][C]0.3969[/C][C]0.346313[/C][/ROW]
[ROW][C]42[/C][C]-0.084274[/C][C]-0.7101[/C][C]0.239982[/C][/ROW]
[ROW][C]43[/C][C]0.064549[/C][C]0.5439[/C][C]0.294107[/C][/ROW]
[ROW][C]44[/C][C]0.01301[/C][C]0.1096[/C][C]0.456509[/C][/ROW]
[ROW][C]45[/C][C]-0.010571[/C][C]-0.0891[/C][C]0.464637[/C][/ROW]
[ROW][C]46[/C][C]-0.036026[/C][C]-0.3036[/C][C]0.381175[/C][/ROW]
[ROW][C]47[/C][C]0.049457[/C][C]0.4167[/C][C]0.339065[/C][/ROW]
[ROW][C]48[/C][C]-0.014915[/C][C]-0.1257[/C][C]0.450173[/C][/ROW]
[/TABLE]
Source: https://freestatistics.org/blog/index.php?pk=167843&T=1

Globally Unique Identifier (entire table): ba.freestatistics.org/blog/index.php?pk=167843&T=1

As an alternative you can also use a QR Code:  

The GUIDs for individual cells are displayed in the table below:

Autocorrelation Function
Time lag kACF(k)T-STATP-value
1-0.454052-3.82590.000139
2-0.091561-0.77150.221483
30.0407640.34350.366126
40.0040810.03440.486331
50.0031220.02630.489544
6-0.043907-0.370.356254
70.0516830.43550.332264
80.0937910.79030.215993
9-0.162439-1.36870.087699
100.0649440.54720.29297
11-0.03724-0.31380.3773
120.0064730.05450.478328
130.0716490.60370.273974
14-0.028731-0.24210.404703
15-0.081176-0.6840.248101
160.154931.30550.097975
17-0.05424-0.4570.32452
18-0.135218-1.13940.129189
190.0644980.54350.294255
200.0790450.6660.25377
21-0.023014-0.19390.423397
22-0.065824-0.55460.290441
230.036990.31170.378097
240.0752780.63430.26396
25-0.05438-0.45820.324099
26-0.108149-0.91130.182615
270.1922351.61980.054854
28-0.133604-1.12580.132028
290.080030.67430.25114
30-0.110218-0.92870.178092
310.0537240.45270.326079
320.1149750.96880.167968
33-0.141722-1.19420.118192
34-0.040043-0.33740.368403
350.1180420.99460.161646
36-0.036582-0.30820.379399
370.0673410.56740.286108
38-0.098044-0.82610.205749
390.0240420.20260.42002
40-0.019622-0.16530.434575
410.0471040.39690.346313
42-0.084274-0.71010.239982
430.0645490.54390.294107
440.013010.10960.456509
45-0.010571-0.08910.464637
46-0.036026-0.30360.381175
470.0494570.41670.339065
48-0.014915-0.12570.450173


Partial Autocorrelation Function
Time lag kPACF(k)T-STATP-value
1-0.454052-3.82590.000139
2-0.375045-3.16020.001159
3-0.273672-2.3060.012017
4-0.22268-1.87630.03236
5-0.179133-1.50940.067817
6-0.224443-1.89120.031339
7-0.171855-1.44810.075999
80.0281430.23710.406615
9-0.089984-0.75820.225416
10-0.036541-0.30790.379531
11-0.113768-0.95860.170499
12-0.145342-1.22470.112374
13-0.0489-0.4120.340776
14-0.014648-0.12340.451058
15-0.150102-1.26480.105042
160.0517570.43610.332041
170.1243271.04760.149189
18-0.07043-0.59350.277382
19-0.093257-0.78580.2173
20-0.046926-0.39540.346864
21-0.045724-0.38530.350591
22-0.084064-0.70830.240528
23-0.082136-0.69210.245568
24-0.003071-0.02590.489713
250.104680.8820.190364
26-0.052339-0.4410.33027
270.1222391.030.153252
28-0.000234-0.0020.499215
290.0894710.75390.226701
30-0.080048-0.67450.251093
31-0.053524-0.4510.326682
320.1101320.9280.178279
330.025390.21390.415605
34-0.069345-0.58430.280432
35-0.005292-0.04460.48228
36-0.019165-0.16150.436084
370.0625240.52680.299975
380.0796450.67110.252168
390.0248820.20970.417267
40-0.092673-0.78090.218735
410.0318780.26860.394504
42-0.058675-0.49440.311275
43-0.100513-0.84690.199939
44-0.084436-0.71150.239561
45-0.099593-0.83920.202091
46-0.059433-0.50080.309033
470.0235310.19830.421697
48-0.080134-0.67520.250866

\begin{tabular}{lllllllll}
\hline
Partial Autocorrelation Function \tabularnewline
Time lag k & PACF(k) & T-STAT & P-value \tabularnewline
1 & -0.454052 & -3.8259 & 0.000139 \tabularnewline
2 & -0.375045 & -3.1602 & 0.001159 \tabularnewline
3 & -0.273672 & -2.306 & 0.012017 \tabularnewline
4 & -0.22268 & -1.8763 & 0.03236 \tabularnewline
5 & -0.179133 & -1.5094 & 0.067817 \tabularnewline
6 & -0.224443 & -1.8912 & 0.031339 \tabularnewline
7 & -0.171855 & -1.4481 & 0.075999 \tabularnewline
8 & 0.028143 & 0.2371 & 0.406615 \tabularnewline
9 & -0.089984 & -0.7582 & 0.225416 \tabularnewline
10 & -0.036541 & -0.3079 & 0.379531 \tabularnewline
11 & -0.113768 & -0.9586 & 0.170499 \tabularnewline
12 & -0.145342 & -1.2247 & 0.112374 \tabularnewline
13 & -0.0489 & -0.412 & 0.340776 \tabularnewline
14 & -0.014648 & -0.1234 & 0.451058 \tabularnewline
15 & -0.150102 & -1.2648 & 0.105042 \tabularnewline
16 & 0.051757 & 0.4361 & 0.332041 \tabularnewline
17 & 0.124327 & 1.0476 & 0.149189 \tabularnewline
18 & -0.07043 & -0.5935 & 0.277382 \tabularnewline
19 & -0.093257 & -0.7858 & 0.2173 \tabularnewline
20 & -0.046926 & -0.3954 & 0.346864 \tabularnewline
21 & -0.045724 & -0.3853 & 0.350591 \tabularnewline
22 & -0.084064 & -0.7083 & 0.240528 \tabularnewline
23 & -0.082136 & -0.6921 & 0.245568 \tabularnewline
24 & -0.003071 & -0.0259 & 0.489713 \tabularnewline
25 & 0.10468 & 0.882 & 0.190364 \tabularnewline
26 & -0.052339 & -0.441 & 0.33027 \tabularnewline
27 & 0.122239 & 1.03 & 0.153252 \tabularnewline
28 & -0.000234 & -0.002 & 0.499215 \tabularnewline
29 & 0.089471 & 0.7539 & 0.226701 \tabularnewline
30 & -0.080048 & -0.6745 & 0.251093 \tabularnewline
31 & -0.053524 & -0.451 & 0.326682 \tabularnewline
32 & 0.110132 & 0.928 & 0.178279 \tabularnewline
33 & 0.02539 & 0.2139 & 0.415605 \tabularnewline
34 & -0.069345 & -0.5843 & 0.280432 \tabularnewline
35 & -0.005292 & -0.0446 & 0.48228 \tabularnewline
36 & -0.019165 & -0.1615 & 0.436084 \tabularnewline
37 & 0.062524 & 0.5268 & 0.299975 \tabularnewline
38 & 0.079645 & 0.6711 & 0.252168 \tabularnewline
39 & 0.024882 & 0.2097 & 0.417267 \tabularnewline
40 & -0.092673 & -0.7809 & 0.218735 \tabularnewline
41 & 0.031878 & 0.2686 & 0.394504 \tabularnewline
42 & -0.058675 & -0.4944 & 0.311275 \tabularnewline
43 & -0.100513 & -0.8469 & 0.199939 \tabularnewline
44 & -0.084436 & -0.7115 & 0.239561 \tabularnewline
45 & -0.099593 & -0.8392 & 0.202091 \tabularnewline
46 & -0.059433 & -0.5008 & 0.309033 \tabularnewline
47 & 0.023531 & 0.1983 & 0.421697 \tabularnewline
48 & -0.080134 & -0.6752 & 0.250866 \tabularnewline
\hline
\end{tabular}
%Source: https://freestatistics.org/blog/index.php?pk=167843&T=2

[TABLE]
[ROW][C]Partial Autocorrelation Function[/C][/ROW]
[ROW][C]Time lag k[/C][C]PACF(k)[/C][C]T-STAT[/C][C]P-value[/C][/ROW]
[ROW][C]1[/C][C]-0.454052[/C][C]-3.8259[/C][C]0.000139[/C][/ROW]
[ROW][C]2[/C][C]-0.375045[/C][C]-3.1602[/C][C]0.001159[/C][/ROW]
[ROW][C]3[/C][C]-0.273672[/C][C]-2.306[/C][C]0.012017[/C][/ROW]
[ROW][C]4[/C][C]-0.22268[/C][C]-1.8763[/C][C]0.03236[/C][/ROW]
[ROW][C]5[/C][C]-0.179133[/C][C]-1.5094[/C][C]0.067817[/C][/ROW]
[ROW][C]6[/C][C]-0.224443[/C][C]-1.8912[/C][C]0.031339[/C][/ROW]
[ROW][C]7[/C][C]-0.171855[/C][C]-1.4481[/C][C]0.075999[/C][/ROW]
[ROW][C]8[/C][C]0.028143[/C][C]0.2371[/C][C]0.406615[/C][/ROW]
[ROW][C]9[/C][C]-0.089984[/C][C]-0.7582[/C][C]0.225416[/C][/ROW]
[ROW][C]10[/C][C]-0.036541[/C][C]-0.3079[/C][C]0.379531[/C][/ROW]
[ROW][C]11[/C][C]-0.113768[/C][C]-0.9586[/C][C]0.170499[/C][/ROW]
[ROW][C]12[/C][C]-0.145342[/C][C]-1.2247[/C][C]0.112374[/C][/ROW]
[ROW][C]13[/C][C]-0.0489[/C][C]-0.412[/C][C]0.340776[/C][/ROW]
[ROW][C]14[/C][C]-0.014648[/C][C]-0.1234[/C][C]0.451058[/C][/ROW]
[ROW][C]15[/C][C]-0.150102[/C][C]-1.2648[/C][C]0.105042[/C][/ROW]
[ROW][C]16[/C][C]0.051757[/C][C]0.4361[/C][C]0.332041[/C][/ROW]
[ROW][C]17[/C][C]0.124327[/C][C]1.0476[/C][C]0.149189[/C][/ROW]
[ROW][C]18[/C][C]-0.07043[/C][C]-0.5935[/C][C]0.277382[/C][/ROW]
[ROW][C]19[/C][C]-0.093257[/C][C]-0.7858[/C][C]0.2173[/C][/ROW]
[ROW][C]20[/C][C]-0.046926[/C][C]-0.3954[/C][C]0.346864[/C][/ROW]
[ROW][C]21[/C][C]-0.045724[/C][C]-0.3853[/C][C]0.350591[/C][/ROW]
[ROW][C]22[/C][C]-0.084064[/C][C]-0.7083[/C][C]0.240528[/C][/ROW]
[ROW][C]23[/C][C]-0.082136[/C][C]-0.6921[/C][C]0.245568[/C][/ROW]
[ROW][C]24[/C][C]-0.003071[/C][C]-0.0259[/C][C]0.489713[/C][/ROW]
[ROW][C]25[/C][C]0.10468[/C][C]0.882[/C][C]0.190364[/C][/ROW]
[ROW][C]26[/C][C]-0.052339[/C][C]-0.441[/C][C]0.33027[/C][/ROW]
[ROW][C]27[/C][C]0.122239[/C][C]1.03[/C][C]0.153252[/C][/ROW]
[ROW][C]28[/C][C]-0.000234[/C][C]-0.002[/C][C]0.499215[/C][/ROW]
[ROW][C]29[/C][C]0.089471[/C][C]0.7539[/C][C]0.226701[/C][/ROW]
[ROW][C]30[/C][C]-0.080048[/C][C]-0.6745[/C][C]0.251093[/C][/ROW]
[ROW][C]31[/C][C]-0.053524[/C][C]-0.451[/C][C]0.326682[/C][/ROW]
[ROW][C]32[/C][C]0.110132[/C][C]0.928[/C][C]0.178279[/C][/ROW]
[ROW][C]33[/C][C]0.02539[/C][C]0.2139[/C][C]0.415605[/C][/ROW]
[ROW][C]34[/C][C]-0.069345[/C][C]-0.5843[/C][C]0.280432[/C][/ROW]
[ROW][C]35[/C][C]-0.005292[/C][C]-0.0446[/C][C]0.48228[/C][/ROW]
[ROW][C]36[/C][C]-0.019165[/C][C]-0.1615[/C][C]0.436084[/C][/ROW]
[ROW][C]37[/C][C]0.062524[/C][C]0.5268[/C][C]0.299975[/C][/ROW]
[ROW][C]38[/C][C]0.079645[/C][C]0.6711[/C][C]0.252168[/C][/ROW]
[ROW][C]39[/C][C]0.024882[/C][C]0.2097[/C][C]0.417267[/C][/ROW]
[ROW][C]40[/C][C]-0.092673[/C][C]-0.7809[/C][C]0.218735[/C][/ROW]
[ROW][C]41[/C][C]0.031878[/C][C]0.2686[/C][C]0.394504[/C][/ROW]
[ROW][C]42[/C][C]-0.058675[/C][C]-0.4944[/C][C]0.311275[/C][/ROW]
[ROW][C]43[/C][C]-0.100513[/C][C]-0.8469[/C][C]0.199939[/C][/ROW]
[ROW][C]44[/C][C]-0.084436[/C][C]-0.7115[/C][C]0.239561[/C][/ROW]
[ROW][C]45[/C][C]-0.099593[/C][C]-0.8392[/C][C]0.202091[/C][/ROW]
[ROW][C]46[/C][C]-0.059433[/C][C]-0.5008[/C][C]0.309033[/C][/ROW]
[ROW][C]47[/C][C]0.023531[/C][C]0.1983[/C][C]0.421697[/C][/ROW]
[ROW][C]48[/C][C]-0.080134[/C][C]-0.6752[/C][C]0.250866[/C][/ROW]
[/TABLE]
Source: https://freestatistics.org/blog/index.php?pk=167843&T=2

Globally Unique Identifier (entire table): ba.freestatistics.org/blog/index.php?pk=167843&T=2

As an alternative you can also use a QR Code:  

The GUIDs for individual cells are displayed in the table below:

Partial Autocorrelation Function
Time lag kPACF(k)T-STATP-value
1-0.454052-3.82590.000139
2-0.375045-3.16020.001159
3-0.273672-2.3060.012017
4-0.22268-1.87630.03236
5-0.179133-1.50940.067817
6-0.224443-1.89120.031339
7-0.171855-1.44810.075999
80.0281430.23710.406615
9-0.089984-0.75820.225416
10-0.036541-0.30790.379531
11-0.113768-0.95860.170499
12-0.145342-1.22470.112374
13-0.0489-0.4120.340776
14-0.014648-0.12340.451058
15-0.150102-1.26480.105042
160.0517570.43610.332041
170.1243271.04760.149189
18-0.07043-0.59350.277382
19-0.093257-0.78580.2173
20-0.046926-0.39540.346864
21-0.045724-0.38530.350591
22-0.084064-0.70830.240528
23-0.082136-0.69210.245568
24-0.003071-0.02590.489713
250.104680.8820.190364
26-0.052339-0.4410.33027
270.1222391.030.153252
28-0.000234-0.0020.499215
290.0894710.75390.226701
30-0.080048-0.67450.251093
31-0.053524-0.4510.326682
320.1101320.9280.178279
330.025390.21390.415605
34-0.069345-0.58430.280432
35-0.005292-0.04460.48228
36-0.019165-0.16150.436084
370.0625240.52680.299975
380.0796450.67110.252168
390.0248820.20970.417267
40-0.092673-0.78090.218735
410.0318780.26860.394504
42-0.058675-0.49440.311275
43-0.100513-0.84690.199939
44-0.084436-0.71150.239561
45-0.099593-0.83920.202091
46-0.059433-0.50080.309033
470.0235310.19830.421697
48-0.080134-0.67520.250866


Parameters (Session):
par1 = 48 ; par2 = 1 ; par3 = 1 ; par4 = 0 ; par5 = 12 ; par6 = White Noise ; par7 = 0.95 ;
Parameters (R input):
par1 = 48 ; par2 = 1 ; par3 = 1 ; par4 = 0 ; par5 = 12 ; par6 = White Noise ; par7 = 0.95 ; par8 = ;
R code (references can be found in the software module):
if (par1 == 'Default') {
par1 = 10*log10(length(x))
} else {
par1 <- as.numeric(par1)
}
par2 <- as.numeric(par2)
par3 <- as.numeric(par3)
par4 <- as.numeric(par4)
par5 <- as.numeric(par5)
if (par6 == 'White Noise') par6 <- 'white' else par6 <- 'ma'
par7 <- as.numeric(par7)
if (par8 != '') par8 <- as.numeric(par8)
ox <- x
if (par8 == '') {
if (par2 == 0) {
x <- log(x)
} else {
x <- (x ^ par2 - 1) / par2
}
} else {
x <- log(x,base=par8)
}
if (par3 > 0) x <- diff(x,lag=1,difference=par3)
if (par4 > 0) x <- diff(x,lag=par5,difference=par4)
bitmap(file='picts.png')
op <- par(mfrow=c(2,1))
plot(ox,type='l',main='Original Time Series',xlab='time',ylab='value')
if (par8=='') {
mytitle <- paste('Working Time Series (lambda=',par2,', d=',par3,', D=',par4,')',sep='')
mysub <- paste('(lambda=',par2,', d=',par3,', D=',par4,', CI=', par7, ', CI type=',par6,')',sep='')
} else {
mytitle <- paste('Working Time Series (base=',par8,', d=',par3,', D=',par4,')',sep='')
mysub <- paste('(base=',par8,', d=',par3,', D=',par4,', CI=', par7, ', CI type=',par6,')',sep='')
}
plot(x,type='l', main=mytitle,xlab='time',ylab='value')
par(op)
dev.off()
bitmap(file='pic1.png')
racf <- acf(x, par1, main='Autocorrelation', xlab='time lag', ylab='ACF', ci.type=par6, ci=par7, sub=mysub)
dev.off()
bitmap(file='pic2.png')
rpacf <- pacf(x,par1,main='Partial Autocorrelation',xlab='lags',ylab='PACF',sub=mysub)
dev.off()
(myacf <- c(racf$acf))
(mypacf <- c(rpacf$acf))
lengthx <- length(x)
sqrtn <- sqrt(lengthx)
load(file='createtable')
a<-table.start()
a<-table.row.start(a)
a<-table.element(a,'Autocorrelation Function',4,TRUE)
a<-table.row.end(a)
a<-table.row.start(a)
a<-table.element(a,'Time lag k',header=TRUE)
a<-table.element(a,hyperlink('basics.htm','ACF(k)','click here for more information about the Autocorrelation Function'),header=TRUE)
a<-table.element(a,'T-STAT',header=TRUE)
a<-table.element(a,'P-value',header=TRUE)
a<-table.row.end(a)
for (i in 2:(par1+1)) {
a<-table.row.start(a)
a<-table.element(a,i-1,header=TRUE)
a<-table.element(a,round(myacf[i],6))
mytstat <- myacf[i]*sqrtn
a<-table.element(a,round(mytstat,4))
a<-table.element(a,round(1-pt(abs(mytstat),lengthx),6))
a<-table.row.end(a)
}
a<-table.end(a)
table.save(a,file='mytable.tab')
a<-table.start()
a<-table.row.start(a)
a<-table.element(a,'Partial Autocorrelation Function',4,TRUE)
a<-table.row.end(a)
a<-table.row.start(a)
a<-table.element(a,'Time lag k',header=TRUE)
a<-table.element(a,hyperlink('basics.htm','PACF(k)','click here for more information about the Partial Autocorrelation Function'),header=TRUE)
a<-table.element(a,'T-STAT',header=TRUE)
a<-table.element(a,'P-value',header=TRUE)
a<-table.row.end(a)
for (i in 1:par1) {
a<-table.row.start(a)
a<-table.element(a,i,header=TRUE)
a<-table.element(a,round(mypacf[i],6))
mytstat <- mypacf[i]*sqrtn
a<-table.element(a,round(mytstat,4))
a<-table.element(a,round(1-pt(abs(mytstat),lengthx),6))
a<-table.row.end(a)
}
a<-table.end(a)
table.save(a,file='mytable1.tab')