Free Statistics

of Irreproducible Research!

Author's title

Author*Unverified author*
R Software Modulerwasp_autocorrelation.wasp
Title produced by software(Partial) Autocorrelation Function
Date of computationMon, 28 May 2012 17:42:59 -0400
Cite this page as followsStatistical Computations at FreeStatistics.org, Office for Research Development and Education, URL https://freestatistics.org/blog/index.php?v=date/2012/May/28/t1338241399ui3cxsw3onsd7do.htm/, Retrieved Thu, 02 May 2024 02:53:24 +0000
Statistical Computations at FreeStatistics.org, Office for Research Development and Education, URL https://freestatistics.org/blog/index.php?pk=167888, Retrieved Thu, 02 May 2024 02:53:24 +0000
QR Codes:

Original text written by user:
IsPrivate?No (this computation is public)
User-defined keywords
Estimated Impact115
Family? (F = Feedback message, R = changed R code, M = changed R Module, P = changed Parameters, D = changed Data)
-     [(Partial) Autocorrelation Function] [] [2012-04-04 13:33:22] [0112d3169e5bff4e2f0b3452278280c8]
- R P     [(Partial) Autocorrelation Function] [] [2012-05-28 21:42:59] [abc5d27992aad9340ff76ee686cd681b] [Current]
Feedback Forum

Post a new message
Dataseries X:
4.143
4.429
5.219
4.929
5.761
5.592
4.163
4.962
5.208
4.755
4.491
5.732
5.731
5.040
6.102
4.904
5.369
5.578
4.619
4.731
5.011
5.227
4.146
4.625
4.736
4.219
5.116
4.205
4.121
5.103
4.300
4.578
3.809
5.657
4.249
3.830
4.736
4.840
4.412
4.570
4.105
4.801
3.953
3.828
4.444
4.027
4.118
4.791
3.232
3.554
3.950
3.948
3.683
4.311
3.865
4.140
4.095
3.814
3.377
3.443
3.494
4.015
5.401
5.122
5.507
6.425
4.948
2.977
2.937
2.972
2.732
3.172
3.102
3.360
3.705
3.171
3.980
3.342
2.766
4.022
4.459


Summary of computational transaction
Raw Inputview raw input (R code)
Raw Outputview raw output of R engine
Computing time1 seconds
R Server'Gwilym Jenkins' @ jenkins.wessa.net

\begin{tabular}{lllllllll}
\hline
Summary of computational transaction \tabularnewline
Raw Input & view raw input (R code)  \tabularnewline
Raw Output & view raw output of R engine  \tabularnewline
Computing time & 1 seconds \tabularnewline
R Server & 'Gwilym Jenkins' @ jenkins.wessa.net \tabularnewline
\hline
\end{tabular}
%Source: https://freestatistics.org/blog/index.php?pk=167888&T=0

[TABLE]
[ROW][C]Summary of computational transaction[/C][/ROW]
[ROW][C]Raw Input[/C][C]view raw input (R code) [/C][/ROW]
[ROW][C]Raw Output[/C][C]view raw output of R engine [/C][/ROW]
[ROW][C]Computing time[/C][C]1 seconds[/C][/ROW]
[ROW][C]R Server[/C][C]'Gwilym Jenkins' @ jenkins.wessa.net[/C][/ROW]
[/TABLE]
Source: https://freestatistics.org/blog/index.php?pk=167888&T=0

Globally Unique Identifier (entire table): ba.freestatistics.org/blog/index.php?pk=167888&T=0

As an alternative you can also use a QR Code:  

The GUIDs for individual cells are displayed in the table below:

Summary of computational transaction
Raw Inputview raw input (R code)
Raw Outputview raw output of R engine
Computing time1 seconds
R Server'Gwilym Jenkins' @ jenkins.wessa.net


Autocorrelation Function
Time lag kACF(k)T-STATP-value
10.6137445.52370
20.4694.2213.2e-05
30.4570934.11384.6e-05
40.2465312.21880.01465
50.1472091.32490.094469
60.1561891.40570.081819
70.1794131.61470.05513
80.2035361.83180.035327
90.2559862.30390.011896
100.2398982.15910.016901
110.1214081.09270.138888
120.1517771.3660.087861
130.0462520.41630.339156
140.0399370.35940.360103
150.0867010.78030.218741
160.0927590.83480.203135
170.134391.20950.114992
180.1845781.66120.05027
190.1647891.48310.070964
200.1160461.04440.1497
210.1309421.17850.121029
220.1038910.9350.176279
230.0468340.42150.337249
240.1147761.0330.152343
250.1046750.94210.174478
260.0877390.78960.21602
270.0582450.52420.300785
280.0238570.21470.415267
290.0675820.60820.272365
30-0.01359-0.12230.451477
31-0.085031-0.76530.223165
32-0.019537-0.17580.430431
33-0.033476-0.30130.381984
34-0.118418-1.06580.144849
35-0.078209-0.70390.241764
36-0.06894-0.62050.268349
37-0.148472-1.33620.092606
38-0.155906-1.40320.082197
39-0.103439-0.9310.177322
40-0.138948-1.25050.107353
41-0.158624-1.42760.078623
42-0.10371-0.93340.176697
43-0.105381-0.94840.172866
44-0.149069-1.34160.091734
45-0.105626-0.95060.172308
46-0.126088-1.13480.129904
47-0.12203-1.09830.13767
48-0.047432-0.42690.335296
49-0.071195-0.64080.261745
50-0.049029-0.44130.330099
51-0.038513-0.34660.364889
52-0.09725-0.87520.192013
53-0.119787-1.07810.142099
54-0.149357-1.34420.091316
55-0.208589-1.87730.032038
56-0.24081-2.16730.016575
57-0.184358-1.65920.050469
58-0.170102-1.53090.064842
59-0.157397-1.41660.080221
60-0.096297-0.86670.19434

\begin{tabular}{lllllllll}
\hline
Autocorrelation Function \tabularnewline
Time lag k & ACF(k) & T-STAT & P-value \tabularnewline
1 & 0.613744 & 5.5237 & 0 \tabularnewline
2 & 0.469 & 4.221 & 3.2e-05 \tabularnewline
3 & 0.457093 & 4.1138 & 4.6e-05 \tabularnewline
4 & 0.246531 & 2.2188 & 0.01465 \tabularnewline
5 & 0.147209 & 1.3249 & 0.094469 \tabularnewline
6 & 0.156189 & 1.4057 & 0.081819 \tabularnewline
7 & 0.179413 & 1.6147 & 0.05513 \tabularnewline
8 & 0.203536 & 1.8318 & 0.035327 \tabularnewline
9 & 0.255986 & 2.3039 & 0.011896 \tabularnewline
10 & 0.239898 & 2.1591 & 0.016901 \tabularnewline
11 & 0.121408 & 1.0927 & 0.138888 \tabularnewline
12 & 0.151777 & 1.366 & 0.087861 \tabularnewline
13 & 0.046252 & 0.4163 & 0.339156 \tabularnewline
14 & 0.039937 & 0.3594 & 0.360103 \tabularnewline
15 & 0.086701 & 0.7803 & 0.218741 \tabularnewline
16 & 0.092759 & 0.8348 & 0.203135 \tabularnewline
17 & 0.13439 & 1.2095 & 0.114992 \tabularnewline
18 & 0.184578 & 1.6612 & 0.05027 \tabularnewline
19 & 0.164789 & 1.4831 & 0.070964 \tabularnewline
20 & 0.116046 & 1.0444 & 0.1497 \tabularnewline
21 & 0.130942 & 1.1785 & 0.121029 \tabularnewline
22 & 0.103891 & 0.935 & 0.176279 \tabularnewline
23 & 0.046834 & 0.4215 & 0.337249 \tabularnewline
24 & 0.114776 & 1.033 & 0.152343 \tabularnewline
25 & 0.104675 & 0.9421 & 0.174478 \tabularnewline
26 & 0.087739 & 0.7896 & 0.21602 \tabularnewline
27 & 0.058245 & 0.5242 & 0.300785 \tabularnewline
28 & 0.023857 & 0.2147 & 0.415267 \tabularnewline
29 & 0.067582 & 0.6082 & 0.272365 \tabularnewline
30 & -0.01359 & -0.1223 & 0.451477 \tabularnewline
31 & -0.085031 & -0.7653 & 0.223165 \tabularnewline
32 & -0.019537 & -0.1758 & 0.430431 \tabularnewline
33 & -0.033476 & -0.3013 & 0.381984 \tabularnewline
34 & -0.118418 & -1.0658 & 0.144849 \tabularnewline
35 & -0.078209 & -0.7039 & 0.241764 \tabularnewline
36 & -0.06894 & -0.6205 & 0.268349 \tabularnewline
37 & -0.148472 & -1.3362 & 0.092606 \tabularnewline
38 & -0.155906 & -1.4032 & 0.082197 \tabularnewline
39 & -0.103439 & -0.931 & 0.177322 \tabularnewline
40 & -0.138948 & -1.2505 & 0.107353 \tabularnewline
41 & -0.158624 & -1.4276 & 0.078623 \tabularnewline
42 & -0.10371 & -0.9334 & 0.176697 \tabularnewline
43 & -0.105381 & -0.9484 & 0.172866 \tabularnewline
44 & -0.149069 & -1.3416 & 0.091734 \tabularnewline
45 & -0.105626 & -0.9506 & 0.172308 \tabularnewline
46 & -0.126088 & -1.1348 & 0.129904 \tabularnewline
47 & -0.12203 & -1.0983 & 0.13767 \tabularnewline
48 & -0.047432 & -0.4269 & 0.335296 \tabularnewline
49 & -0.071195 & -0.6408 & 0.261745 \tabularnewline
50 & -0.049029 & -0.4413 & 0.330099 \tabularnewline
51 & -0.038513 & -0.3466 & 0.364889 \tabularnewline
52 & -0.09725 & -0.8752 & 0.192013 \tabularnewline
53 & -0.119787 & -1.0781 & 0.142099 \tabularnewline
54 & -0.149357 & -1.3442 & 0.091316 \tabularnewline
55 & -0.208589 & -1.8773 & 0.032038 \tabularnewline
56 & -0.24081 & -2.1673 & 0.016575 \tabularnewline
57 & -0.184358 & -1.6592 & 0.050469 \tabularnewline
58 & -0.170102 & -1.5309 & 0.064842 \tabularnewline
59 & -0.157397 & -1.4166 & 0.080221 \tabularnewline
60 & -0.096297 & -0.8667 & 0.19434 \tabularnewline
\hline
\end{tabular}
%Source: https://freestatistics.org/blog/index.php?pk=167888&T=1

[TABLE]
[ROW][C]Autocorrelation Function[/C][/ROW]
[ROW][C]Time lag k[/C][C]ACF(k)[/C][C]T-STAT[/C][C]P-value[/C][/ROW]
[ROW][C]1[/C][C]0.613744[/C][C]5.5237[/C][C]0[/C][/ROW]
[ROW][C]2[/C][C]0.469[/C][C]4.221[/C][C]3.2e-05[/C][/ROW]
[ROW][C]3[/C][C]0.457093[/C][C]4.1138[/C][C]4.6e-05[/C][/ROW]
[ROW][C]4[/C][C]0.246531[/C][C]2.2188[/C][C]0.01465[/C][/ROW]
[ROW][C]5[/C][C]0.147209[/C][C]1.3249[/C][C]0.094469[/C][/ROW]
[ROW][C]6[/C][C]0.156189[/C][C]1.4057[/C][C]0.081819[/C][/ROW]
[ROW][C]7[/C][C]0.179413[/C][C]1.6147[/C][C]0.05513[/C][/ROW]
[ROW][C]8[/C][C]0.203536[/C][C]1.8318[/C][C]0.035327[/C][/ROW]
[ROW][C]9[/C][C]0.255986[/C][C]2.3039[/C][C]0.011896[/C][/ROW]
[ROW][C]10[/C][C]0.239898[/C][C]2.1591[/C][C]0.016901[/C][/ROW]
[ROW][C]11[/C][C]0.121408[/C][C]1.0927[/C][C]0.138888[/C][/ROW]
[ROW][C]12[/C][C]0.151777[/C][C]1.366[/C][C]0.087861[/C][/ROW]
[ROW][C]13[/C][C]0.046252[/C][C]0.4163[/C][C]0.339156[/C][/ROW]
[ROW][C]14[/C][C]0.039937[/C][C]0.3594[/C][C]0.360103[/C][/ROW]
[ROW][C]15[/C][C]0.086701[/C][C]0.7803[/C][C]0.218741[/C][/ROW]
[ROW][C]16[/C][C]0.092759[/C][C]0.8348[/C][C]0.203135[/C][/ROW]
[ROW][C]17[/C][C]0.13439[/C][C]1.2095[/C][C]0.114992[/C][/ROW]
[ROW][C]18[/C][C]0.184578[/C][C]1.6612[/C][C]0.05027[/C][/ROW]
[ROW][C]19[/C][C]0.164789[/C][C]1.4831[/C][C]0.070964[/C][/ROW]
[ROW][C]20[/C][C]0.116046[/C][C]1.0444[/C][C]0.1497[/C][/ROW]
[ROW][C]21[/C][C]0.130942[/C][C]1.1785[/C][C]0.121029[/C][/ROW]
[ROW][C]22[/C][C]0.103891[/C][C]0.935[/C][C]0.176279[/C][/ROW]
[ROW][C]23[/C][C]0.046834[/C][C]0.4215[/C][C]0.337249[/C][/ROW]
[ROW][C]24[/C][C]0.114776[/C][C]1.033[/C][C]0.152343[/C][/ROW]
[ROW][C]25[/C][C]0.104675[/C][C]0.9421[/C][C]0.174478[/C][/ROW]
[ROW][C]26[/C][C]0.087739[/C][C]0.7896[/C][C]0.21602[/C][/ROW]
[ROW][C]27[/C][C]0.058245[/C][C]0.5242[/C][C]0.300785[/C][/ROW]
[ROW][C]28[/C][C]0.023857[/C][C]0.2147[/C][C]0.415267[/C][/ROW]
[ROW][C]29[/C][C]0.067582[/C][C]0.6082[/C][C]0.272365[/C][/ROW]
[ROW][C]30[/C][C]-0.01359[/C][C]-0.1223[/C][C]0.451477[/C][/ROW]
[ROW][C]31[/C][C]-0.085031[/C][C]-0.7653[/C][C]0.223165[/C][/ROW]
[ROW][C]32[/C][C]-0.019537[/C][C]-0.1758[/C][C]0.430431[/C][/ROW]
[ROW][C]33[/C][C]-0.033476[/C][C]-0.3013[/C][C]0.381984[/C][/ROW]
[ROW][C]34[/C][C]-0.118418[/C][C]-1.0658[/C][C]0.144849[/C][/ROW]
[ROW][C]35[/C][C]-0.078209[/C][C]-0.7039[/C][C]0.241764[/C][/ROW]
[ROW][C]36[/C][C]-0.06894[/C][C]-0.6205[/C][C]0.268349[/C][/ROW]
[ROW][C]37[/C][C]-0.148472[/C][C]-1.3362[/C][C]0.092606[/C][/ROW]
[ROW][C]38[/C][C]-0.155906[/C][C]-1.4032[/C][C]0.082197[/C][/ROW]
[ROW][C]39[/C][C]-0.103439[/C][C]-0.931[/C][C]0.177322[/C][/ROW]
[ROW][C]40[/C][C]-0.138948[/C][C]-1.2505[/C][C]0.107353[/C][/ROW]
[ROW][C]41[/C][C]-0.158624[/C][C]-1.4276[/C][C]0.078623[/C][/ROW]
[ROW][C]42[/C][C]-0.10371[/C][C]-0.9334[/C][C]0.176697[/C][/ROW]
[ROW][C]43[/C][C]-0.105381[/C][C]-0.9484[/C][C]0.172866[/C][/ROW]
[ROW][C]44[/C][C]-0.149069[/C][C]-1.3416[/C][C]0.091734[/C][/ROW]
[ROW][C]45[/C][C]-0.105626[/C][C]-0.9506[/C][C]0.172308[/C][/ROW]
[ROW][C]46[/C][C]-0.126088[/C][C]-1.1348[/C][C]0.129904[/C][/ROW]
[ROW][C]47[/C][C]-0.12203[/C][C]-1.0983[/C][C]0.13767[/C][/ROW]
[ROW][C]48[/C][C]-0.047432[/C][C]-0.4269[/C][C]0.335296[/C][/ROW]
[ROW][C]49[/C][C]-0.071195[/C][C]-0.6408[/C][C]0.261745[/C][/ROW]
[ROW][C]50[/C][C]-0.049029[/C][C]-0.4413[/C][C]0.330099[/C][/ROW]
[ROW][C]51[/C][C]-0.038513[/C][C]-0.3466[/C][C]0.364889[/C][/ROW]
[ROW][C]52[/C][C]-0.09725[/C][C]-0.8752[/C][C]0.192013[/C][/ROW]
[ROW][C]53[/C][C]-0.119787[/C][C]-1.0781[/C][C]0.142099[/C][/ROW]
[ROW][C]54[/C][C]-0.149357[/C][C]-1.3442[/C][C]0.091316[/C][/ROW]
[ROW][C]55[/C][C]-0.208589[/C][C]-1.8773[/C][C]0.032038[/C][/ROW]
[ROW][C]56[/C][C]-0.24081[/C][C]-2.1673[/C][C]0.016575[/C][/ROW]
[ROW][C]57[/C][C]-0.184358[/C][C]-1.6592[/C][C]0.050469[/C][/ROW]
[ROW][C]58[/C][C]-0.170102[/C][C]-1.5309[/C][C]0.064842[/C][/ROW]
[ROW][C]59[/C][C]-0.157397[/C][C]-1.4166[/C][C]0.080221[/C][/ROW]
[ROW][C]60[/C][C]-0.096297[/C][C]-0.8667[/C][C]0.19434[/C][/ROW]
[/TABLE]
Source: https://freestatistics.org/blog/index.php?pk=167888&T=1

Globally Unique Identifier (entire table): ba.freestatistics.org/blog/index.php?pk=167888&T=1

As an alternative you can also use a QR Code:  

The GUIDs for individual cells are displayed in the table below:

Autocorrelation Function
Time lag kACF(k)T-STATP-value
10.6137445.52370
20.4694.2213.2e-05
30.4570934.11384.6e-05
40.2465312.21880.01465
50.1472091.32490.094469
60.1561891.40570.081819
70.1794131.61470.05513
80.2035361.83180.035327
90.2559862.30390.011896
100.2398982.15910.016901
110.1214081.09270.138888
120.1517771.3660.087861
130.0462520.41630.339156
140.0399370.35940.360103
150.0867010.78030.218741
160.0927590.83480.203135
170.134391.20950.114992
180.1845781.66120.05027
190.1647891.48310.070964
200.1160461.04440.1497
210.1309421.17850.121029
220.1038910.9350.176279
230.0468340.42150.337249
240.1147761.0330.152343
250.1046750.94210.174478
260.0877390.78960.21602
270.0582450.52420.300785
280.0238570.21470.415267
290.0675820.60820.272365
30-0.01359-0.12230.451477
31-0.085031-0.76530.223165
32-0.019537-0.17580.430431
33-0.033476-0.30130.381984
34-0.118418-1.06580.144849
35-0.078209-0.70390.241764
36-0.06894-0.62050.268349
37-0.148472-1.33620.092606
38-0.155906-1.40320.082197
39-0.103439-0.9310.177322
40-0.138948-1.25050.107353
41-0.158624-1.42760.078623
42-0.10371-0.93340.176697
43-0.105381-0.94840.172866
44-0.149069-1.34160.091734
45-0.105626-0.95060.172308
46-0.126088-1.13480.129904
47-0.12203-1.09830.13767
48-0.047432-0.42690.335296
49-0.071195-0.64080.261745
50-0.049029-0.44130.330099
51-0.038513-0.34660.364889
52-0.09725-0.87520.192013
53-0.119787-1.07810.142099
54-0.149357-1.34420.091316
55-0.208589-1.87730.032038
56-0.24081-2.16730.016575
57-0.184358-1.65920.050469
58-0.170102-1.53090.064842
59-0.157397-1.41660.080221
60-0.096297-0.86670.19434


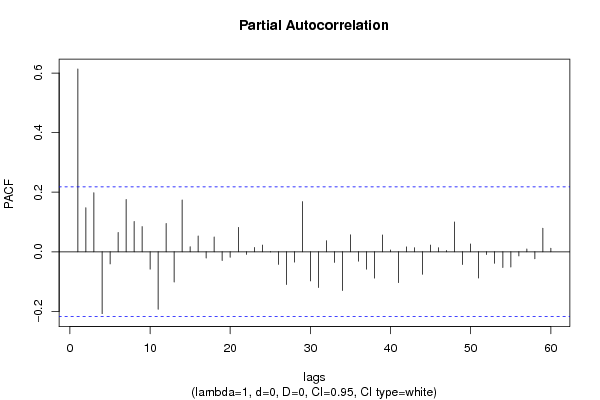
Partial Autocorrelation Function
Time lag kPACF(k)T-STATP-value
10.6137445.52370
20.1481091.3330.093138
30.1984421.7860.038923
4-0.207666-1.8690.032619
5-0.040619-0.36560.357818
60.0645340.58080.281493
70.1754881.57940.059072
80.1016340.91470.18153
90.0844320.75990.224763
10-0.058265-0.52440.30072
11-0.193107-1.7380.043009
120.0949690.85470.197613
13-0.10125-0.91120.182434
140.1739851.56590.06064
150.0169020.15210.439734
160.0528480.47560.317809
17-0.02086-0.18770.425776
180.0497070.44740.327905
19-0.029135-0.26220.39691
20-0.018595-0.16740.433755
210.0818440.73660.231748
22-0.008633-0.07770.469129
230.0145120.13060.448204
240.0224020.20160.42036
25-0.000509-0.00460.498177
26-0.042334-0.3810.352097
27-0.109772-0.98790.163061
28-0.034664-0.3120.377931
290.1683961.51560.066761
30-0.097637-0.87870.191072
31-0.120107-1.0810.14146
320.0367980.33120.370681
33-0.035562-0.32010.374875
34-0.130184-1.17170.122385
350.0567480.51070.305463
36-0.031489-0.28340.388796
37-0.058389-0.52550.300334
38-0.088372-0.79530.214369
390.0560810.50470.30756
400.0062690.05640.477574
41-0.103456-0.93110.177282
420.0163740.14740.441605
430.0138350.12450.450608
44-0.075453-0.67910.249513
450.0224120.20170.420324
460.0138160.12430.450677
470.0043690.03930.484364
480.0998270.89840.185806
49-0.042638-0.38370.351087
500.0261490.23530.407269
51-0.088235-0.79410.214724
52-0.0089-0.08010.468176
53-0.038497-0.34650.364944
54-0.052919-0.47630.317583
55-0.051245-0.46120.322944
56-0.013881-0.12490.450443
570.0093960.08460.466408
58-0.023568-0.21210.416277
590.0789960.7110.239575
600.0119970.1080.457141

\begin{tabular}{lllllllll}
\hline
Partial Autocorrelation Function \tabularnewline
Time lag k & PACF(k) & T-STAT & P-value \tabularnewline
1 & 0.613744 & 5.5237 & 0 \tabularnewline
2 & 0.148109 & 1.333 & 0.093138 \tabularnewline
3 & 0.198442 & 1.786 & 0.038923 \tabularnewline
4 & -0.207666 & -1.869 & 0.032619 \tabularnewline
5 & -0.040619 & -0.3656 & 0.357818 \tabularnewline
6 & 0.064534 & 0.5808 & 0.281493 \tabularnewline
7 & 0.175488 & 1.5794 & 0.059072 \tabularnewline
8 & 0.101634 & 0.9147 & 0.18153 \tabularnewline
9 & 0.084432 & 0.7599 & 0.224763 \tabularnewline
10 & -0.058265 & -0.5244 & 0.30072 \tabularnewline
11 & -0.193107 & -1.738 & 0.043009 \tabularnewline
12 & 0.094969 & 0.8547 & 0.197613 \tabularnewline
13 & -0.10125 & -0.9112 & 0.182434 \tabularnewline
14 & 0.173985 & 1.5659 & 0.06064 \tabularnewline
15 & 0.016902 & 0.1521 & 0.439734 \tabularnewline
16 & 0.052848 & 0.4756 & 0.317809 \tabularnewline
17 & -0.02086 & -0.1877 & 0.425776 \tabularnewline
18 & 0.049707 & 0.4474 & 0.327905 \tabularnewline
19 & -0.029135 & -0.2622 & 0.39691 \tabularnewline
20 & -0.018595 & -0.1674 & 0.433755 \tabularnewline
21 & 0.081844 & 0.7366 & 0.231748 \tabularnewline
22 & -0.008633 & -0.0777 & 0.469129 \tabularnewline
23 & 0.014512 & 0.1306 & 0.448204 \tabularnewline
24 & 0.022402 & 0.2016 & 0.42036 \tabularnewline
25 & -0.000509 & -0.0046 & 0.498177 \tabularnewline
26 & -0.042334 & -0.381 & 0.352097 \tabularnewline
27 & -0.109772 & -0.9879 & 0.163061 \tabularnewline
28 & -0.034664 & -0.312 & 0.377931 \tabularnewline
29 & 0.168396 & 1.5156 & 0.066761 \tabularnewline
30 & -0.097637 & -0.8787 & 0.191072 \tabularnewline
31 & -0.120107 & -1.081 & 0.14146 \tabularnewline
32 & 0.036798 & 0.3312 & 0.370681 \tabularnewline
33 & -0.035562 & -0.3201 & 0.374875 \tabularnewline
34 & -0.130184 & -1.1717 & 0.122385 \tabularnewline
35 & 0.056748 & 0.5107 & 0.305463 \tabularnewline
36 & -0.031489 & -0.2834 & 0.388796 \tabularnewline
37 & -0.058389 & -0.5255 & 0.300334 \tabularnewline
38 & -0.088372 & -0.7953 & 0.214369 \tabularnewline
39 & 0.056081 & 0.5047 & 0.30756 \tabularnewline
40 & 0.006269 & 0.0564 & 0.477574 \tabularnewline
41 & -0.103456 & -0.9311 & 0.177282 \tabularnewline
42 & 0.016374 & 0.1474 & 0.441605 \tabularnewline
43 & 0.013835 & 0.1245 & 0.450608 \tabularnewline
44 & -0.075453 & -0.6791 & 0.249513 \tabularnewline
45 & 0.022412 & 0.2017 & 0.420324 \tabularnewline
46 & 0.013816 & 0.1243 & 0.450677 \tabularnewline
47 & 0.004369 & 0.0393 & 0.484364 \tabularnewline
48 & 0.099827 & 0.8984 & 0.185806 \tabularnewline
49 & -0.042638 & -0.3837 & 0.351087 \tabularnewline
50 & 0.026149 & 0.2353 & 0.407269 \tabularnewline
51 & -0.088235 & -0.7941 & 0.214724 \tabularnewline
52 & -0.0089 & -0.0801 & 0.468176 \tabularnewline
53 & -0.038497 & -0.3465 & 0.364944 \tabularnewline
54 & -0.052919 & -0.4763 & 0.317583 \tabularnewline
55 & -0.051245 & -0.4612 & 0.322944 \tabularnewline
56 & -0.013881 & -0.1249 & 0.450443 \tabularnewline
57 & 0.009396 & 0.0846 & 0.466408 \tabularnewline
58 & -0.023568 & -0.2121 & 0.416277 \tabularnewline
59 & 0.078996 & 0.711 & 0.239575 \tabularnewline
60 & 0.011997 & 0.108 & 0.457141 \tabularnewline
\hline
\end{tabular}
%Source: https://freestatistics.org/blog/index.php?pk=167888&T=2

[TABLE]
[ROW][C]Partial Autocorrelation Function[/C][/ROW]
[ROW][C]Time lag k[/C][C]PACF(k)[/C][C]T-STAT[/C][C]P-value[/C][/ROW]
[ROW][C]1[/C][C]0.613744[/C][C]5.5237[/C][C]0[/C][/ROW]
[ROW][C]2[/C][C]0.148109[/C][C]1.333[/C][C]0.093138[/C][/ROW]
[ROW][C]3[/C][C]0.198442[/C][C]1.786[/C][C]0.038923[/C][/ROW]
[ROW][C]4[/C][C]-0.207666[/C][C]-1.869[/C][C]0.032619[/C][/ROW]
[ROW][C]5[/C][C]-0.040619[/C][C]-0.3656[/C][C]0.357818[/C][/ROW]
[ROW][C]6[/C][C]0.064534[/C][C]0.5808[/C][C]0.281493[/C][/ROW]
[ROW][C]7[/C][C]0.175488[/C][C]1.5794[/C][C]0.059072[/C][/ROW]
[ROW][C]8[/C][C]0.101634[/C][C]0.9147[/C][C]0.18153[/C][/ROW]
[ROW][C]9[/C][C]0.084432[/C][C]0.7599[/C][C]0.224763[/C][/ROW]
[ROW][C]10[/C][C]-0.058265[/C][C]-0.5244[/C][C]0.30072[/C][/ROW]
[ROW][C]11[/C][C]-0.193107[/C][C]-1.738[/C][C]0.043009[/C][/ROW]
[ROW][C]12[/C][C]0.094969[/C][C]0.8547[/C][C]0.197613[/C][/ROW]
[ROW][C]13[/C][C]-0.10125[/C][C]-0.9112[/C][C]0.182434[/C][/ROW]
[ROW][C]14[/C][C]0.173985[/C][C]1.5659[/C][C]0.06064[/C][/ROW]
[ROW][C]15[/C][C]0.016902[/C][C]0.1521[/C][C]0.439734[/C][/ROW]
[ROW][C]16[/C][C]0.052848[/C][C]0.4756[/C][C]0.317809[/C][/ROW]
[ROW][C]17[/C][C]-0.02086[/C][C]-0.1877[/C][C]0.425776[/C][/ROW]
[ROW][C]18[/C][C]0.049707[/C][C]0.4474[/C][C]0.327905[/C][/ROW]
[ROW][C]19[/C][C]-0.029135[/C][C]-0.2622[/C][C]0.39691[/C][/ROW]
[ROW][C]20[/C][C]-0.018595[/C][C]-0.1674[/C][C]0.433755[/C][/ROW]
[ROW][C]21[/C][C]0.081844[/C][C]0.7366[/C][C]0.231748[/C][/ROW]
[ROW][C]22[/C][C]-0.008633[/C][C]-0.0777[/C][C]0.469129[/C][/ROW]
[ROW][C]23[/C][C]0.014512[/C][C]0.1306[/C][C]0.448204[/C][/ROW]
[ROW][C]24[/C][C]0.022402[/C][C]0.2016[/C][C]0.42036[/C][/ROW]
[ROW][C]25[/C][C]-0.000509[/C][C]-0.0046[/C][C]0.498177[/C][/ROW]
[ROW][C]26[/C][C]-0.042334[/C][C]-0.381[/C][C]0.352097[/C][/ROW]
[ROW][C]27[/C][C]-0.109772[/C][C]-0.9879[/C][C]0.163061[/C][/ROW]
[ROW][C]28[/C][C]-0.034664[/C][C]-0.312[/C][C]0.377931[/C][/ROW]
[ROW][C]29[/C][C]0.168396[/C][C]1.5156[/C][C]0.066761[/C][/ROW]
[ROW][C]30[/C][C]-0.097637[/C][C]-0.8787[/C][C]0.191072[/C][/ROW]
[ROW][C]31[/C][C]-0.120107[/C][C]-1.081[/C][C]0.14146[/C][/ROW]
[ROW][C]32[/C][C]0.036798[/C][C]0.3312[/C][C]0.370681[/C][/ROW]
[ROW][C]33[/C][C]-0.035562[/C][C]-0.3201[/C][C]0.374875[/C][/ROW]
[ROW][C]34[/C][C]-0.130184[/C][C]-1.1717[/C][C]0.122385[/C][/ROW]
[ROW][C]35[/C][C]0.056748[/C][C]0.5107[/C][C]0.305463[/C][/ROW]
[ROW][C]36[/C][C]-0.031489[/C][C]-0.2834[/C][C]0.388796[/C][/ROW]
[ROW][C]37[/C][C]-0.058389[/C][C]-0.5255[/C][C]0.300334[/C][/ROW]
[ROW][C]38[/C][C]-0.088372[/C][C]-0.7953[/C][C]0.214369[/C][/ROW]
[ROW][C]39[/C][C]0.056081[/C][C]0.5047[/C][C]0.30756[/C][/ROW]
[ROW][C]40[/C][C]0.006269[/C][C]0.0564[/C][C]0.477574[/C][/ROW]
[ROW][C]41[/C][C]-0.103456[/C][C]-0.9311[/C][C]0.177282[/C][/ROW]
[ROW][C]42[/C][C]0.016374[/C][C]0.1474[/C][C]0.441605[/C][/ROW]
[ROW][C]43[/C][C]0.013835[/C][C]0.1245[/C][C]0.450608[/C][/ROW]
[ROW][C]44[/C][C]-0.075453[/C][C]-0.6791[/C][C]0.249513[/C][/ROW]
[ROW][C]45[/C][C]0.022412[/C][C]0.2017[/C][C]0.420324[/C][/ROW]
[ROW][C]46[/C][C]0.013816[/C][C]0.1243[/C][C]0.450677[/C][/ROW]
[ROW][C]47[/C][C]0.004369[/C][C]0.0393[/C][C]0.484364[/C][/ROW]
[ROW][C]48[/C][C]0.099827[/C][C]0.8984[/C][C]0.185806[/C][/ROW]
[ROW][C]49[/C][C]-0.042638[/C][C]-0.3837[/C][C]0.351087[/C][/ROW]
[ROW][C]50[/C][C]0.026149[/C][C]0.2353[/C][C]0.407269[/C][/ROW]
[ROW][C]51[/C][C]-0.088235[/C][C]-0.7941[/C][C]0.214724[/C][/ROW]
[ROW][C]52[/C][C]-0.0089[/C][C]-0.0801[/C][C]0.468176[/C][/ROW]
[ROW][C]53[/C][C]-0.038497[/C][C]-0.3465[/C][C]0.364944[/C][/ROW]
[ROW][C]54[/C][C]-0.052919[/C][C]-0.4763[/C][C]0.317583[/C][/ROW]
[ROW][C]55[/C][C]-0.051245[/C][C]-0.4612[/C][C]0.322944[/C][/ROW]
[ROW][C]56[/C][C]-0.013881[/C][C]-0.1249[/C][C]0.450443[/C][/ROW]
[ROW][C]57[/C][C]0.009396[/C][C]0.0846[/C][C]0.466408[/C][/ROW]
[ROW][C]58[/C][C]-0.023568[/C][C]-0.2121[/C][C]0.416277[/C][/ROW]
[ROW][C]59[/C][C]0.078996[/C][C]0.711[/C][C]0.239575[/C][/ROW]
[ROW][C]60[/C][C]0.011997[/C][C]0.108[/C][C]0.457141[/C][/ROW]
[/TABLE]
Source: https://freestatistics.org/blog/index.php?pk=167888&T=2

Globally Unique Identifier (entire table): ba.freestatistics.org/blog/index.php?pk=167888&T=2

As an alternative you can also use a QR Code:  

The GUIDs for individual cells are displayed in the table below:

Partial Autocorrelation Function
Time lag kPACF(k)T-STATP-value
10.6137445.52370
20.1481091.3330.093138
30.1984421.7860.038923
4-0.207666-1.8690.032619
5-0.040619-0.36560.357818
60.0645340.58080.281493
70.1754881.57940.059072
80.1016340.91470.18153
90.0844320.75990.224763
10-0.058265-0.52440.30072
11-0.193107-1.7380.043009
120.0949690.85470.197613
13-0.10125-0.91120.182434
140.1739851.56590.06064
150.0169020.15210.439734
160.0528480.47560.317809
17-0.02086-0.18770.425776
180.0497070.44740.327905
19-0.029135-0.26220.39691
20-0.018595-0.16740.433755
210.0818440.73660.231748
22-0.008633-0.07770.469129
230.0145120.13060.448204
240.0224020.20160.42036
25-0.000509-0.00460.498177
26-0.042334-0.3810.352097
27-0.109772-0.98790.163061
28-0.034664-0.3120.377931
290.1683961.51560.066761
30-0.097637-0.87870.191072
31-0.120107-1.0810.14146
320.0367980.33120.370681
33-0.035562-0.32010.374875
34-0.130184-1.17170.122385
350.0567480.51070.305463
36-0.031489-0.28340.388796
37-0.058389-0.52550.300334
38-0.088372-0.79530.214369
390.0560810.50470.30756
400.0062690.05640.477574
41-0.103456-0.93110.177282
420.0163740.14740.441605
430.0138350.12450.450608
44-0.075453-0.67910.249513
450.0224120.20170.420324
460.0138160.12430.450677
470.0043690.03930.484364
480.0998270.89840.185806
49-0.042638-0.38370.351087
500.0261490.23530.407269
51-0.088235-0.79410.214724
52-0.0089-0.08010.468176
53-0.038497-0.34650.364944
54-0.052919-0.47630.317583
55-0.051245-0.46120.322944
56-0.013881-0.12490.450443
570.0093960.08460.466408
58-0.023568-0.21210.416277
590.0789960.7110.239575
600.0119970.1080.457141


Parameters (Session):
par1 = 60 ; par2 = 1 ; par3 = 0 ; par4 = 0 ; par5 = 12 ; par6 = White Noise ; par7 = 0.95 ;
Parameters (R input):
par1 = 60 ; par2 = 1 ; par3 = 0 ; par4 = 0 ; par5 = 12 ; par6 = White Noise ; par7 = 0.95 ; par8 = ;
R code (references can be found in the software module):
if (par1 == 'Default') {
par1 = 10*log10(length(x))
} else {
par1 <- as.numeric(par1)
}
par2 <- as.numeric(par2)
par3 <- as.numeric(par3)
par4 <- as.numeric(par4)
par5 <- as.numeric(par5)
if (par6 == 'White Noise') par6 <- 'white' else par6 <- 'ma'
par7 <- as.numeric(par7)
if (par8 != '') par8 <- as.numeric(par8)
ox <- x
if (par8 == '') {
if (par2 == 0) {
x <- log(x)
} else {
x <- (x ^ par2 - 1) / par2
}
} else {
x <- log(x,base=par8)
}
if (par3 > 0) x <- diff(x,lag=1,difference=par3)
if (par4 > 0) x <- diff(x,lag=par5,difference=par4)
bitmap(file='picts.png')
op <- par(mfrow=c(2,1))
plot(ox,type='l',main='Original Time Series',xlab='time',ylab='value')
if (par8=='') {
mytitle <- paste('Working Time Series (lambda=',par2,', d=',par3,', D=',par4,')',sep='')
mysub <- paste('(lambda=',par2,', d=',par3,', D=',par4,', CI=', par7, ', CI type=',par6,')',sep='')
} else {
mytitle <- paste('Working Time Series (base=',par8,', d=',par3,', D=',par4,')',sep='')
mysub <- paste('(base=',par8,', d=',par3,', D=',par4,', CI=', par7, ', CI type=',par6,')',sep='')
}
plot(x,type='l', main=mytitle,xlab='time',ylab='value')
par(op)
dev.off()
bitmap(file='pic1.png')
racf <- acf(x, par1, main='Autocorrelation', xlab='time lag', ylab='ACF', ci.type=par6, ci=par7, sub=mysub)
dev.off()
bitmap(file='pic2.png')
rpacf <- pacf(x,par1,main='Partial Autocorrelation',xlab='lags',ylab='PACF',sub=mysub)
dev.off()
(myacf <- c(racf$acf))
(mypacf <- c(rpacf$acf))
lengthx <- length(x)
sqrtn <- sqrt(lengthx)
load(file='createtable')
a<-table.start()
a<-table.row.start(a)
a<-table.element(a,'Autocorrelation Function',4,TRUE)
a<-table.row.end(a)
a<-table.row.start(a)
a<-table.element(a,'Time lag k',header=TRUE)
a<-table.element(a,hyperlink('basics.htm','ACF(k)','click here for more information about the Autocorrelation Function'),header=TRUE)
a<-table.element(a,'T-STAT',header=TRUE)
a<-table.element(a,'P-value',header=TRUE)
a<-table.row.end(a)
for (i in 2:(par1+1)) {
a<-table.row.start(a)
a<-table.element(a,i-1,header=TRUE)
a<-table.element(a,round(myacf[i],6))
mytstat <- myacf[i]*sqrtn
a<-table.element(a,round(mytstat,4))
a<-table.element(a,round(1-pt(abs(mytstat),lengthx),6))
a<-table.row.end(a)
}
a<-table.end(a)
table.save(a,file='mytable.tab')
a<-table.start()
a<-table.row.start(a)
a<-table.element(a,'Partial Autocorrelation Function',4,TRUE)
a<-table.row.end(a)
a<-table.row.start(a)
a<-table.element(a,'Time lag k',header=TRUE)
a<-table.element(a,hyperlink('basics.htm','PACF(k)','click here for more information about the Partial Autocorrelation Function'),header=TRUE)
a<-table.element(a,'T-STAT',header=TRUE)
a<-table.element(a,'P-value',header=TRUE)
a<-table.row.end(a)
for (i in 1:par1) {
a<-table.row.start(a)
a<-table.element(a,i,header=TRUE)
a<-table.element(a,round(mypacf[i],6))
mytstat <- mypacf[i]*sqrtn
a<-table.element(a,round(mytstat,4))
a<-table.element(a,round(1-pt(abs(mytstat),lengthx),6))
a<-table.row.end(a)
}
a<-table.end(a)
table.save(a,file='mytable1.tab')