Free Statistics
of Irreproducible Research!
Description of Statistical Computation | ||||||||||||||||||||||||||||||
|---|---|---|---|---|---|---|---|---|---|---|---|---|---|---|---|---|---|---|---|---|---|---|---|---|---|---|---|---|---|---|
| Author's title | ||||||||||||||||||||||||||||||
| Author | *The author of this computation has been verified* | |||||||||||||||||||||||||||||
| R Software Module | rwasp_Distributional Plots.wasp | |||||||||||||||||||||||||||||
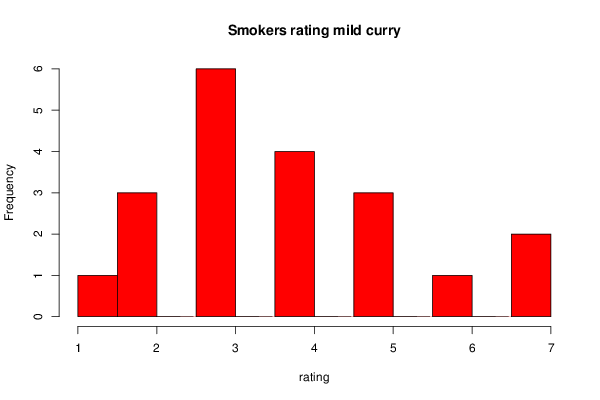
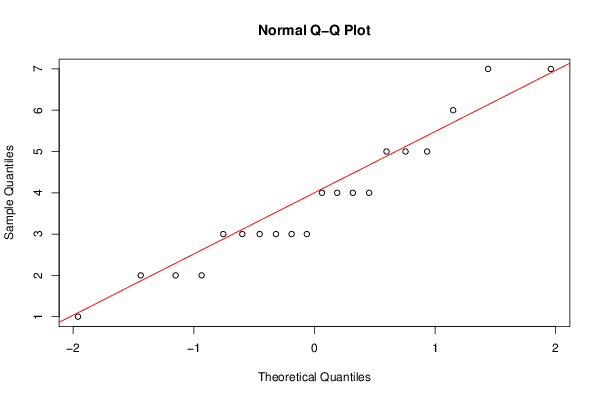
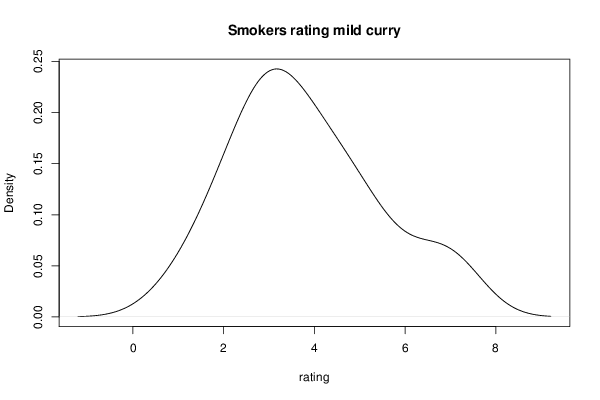
| Title produced by software | Histogram, QQplot and Density | |||||||||||||||||||||||||||||
| Date of computation | Thu, 08 Nov 2012 08:36:42 -0500 | |||||||||||||||||||||||||||||
| Cite this page as follows | Statistical Computations at FreeStatistics.org, Office for Research Development and Education, URL https://freestatistics.org/blog/index.php?v=date/2012/Nov/08/t1352381828wg5mn2fii4hli7w.htm/, Retrieved Mon, 29 Apr 2024 15:25:19 +0000 | |||||||||||||||||||||||||||||
| Statistical Computations at FreeStatistics.org, Office for Research Development and Education, URL https://freestatistics.org/blog/index.php?pk=186743, Retrieved Mon, 29 Apr 2024 15:25:19 +0000 | ||||||||||||||||||||||||||||||
| QR Codes: | ||||||||||||||||||||||||||||||
|
| ||||||||||||||||||||||||||||||
| Original text written by user: | ||||||||||||||||||||||||||||||
| IsPrivate? | No (this computation is public) | |||||||||||||||||||||||||||||
| User-defined keywords | ||||||||||||||||||||||||||||||
| Estimated Impact | 59 | |||||||||||||||||||||||||||||
Tree of Dependent Computations | ||||||||||||||||||||||||||||||
| Family? (F = Feedback message, R = changed R code, M = changed R Module, P = changed Parameters, D = changed Data) | ||||||||||||||||||||||||||||||
| - [Variability] [Two-Way ANOVA] [2010-11-30 21:42:30] [74be16979710d4c4e7c6647856088456] - RM [Two-Way ANOVA] [Two-Way ANOVA - C...] [2011-11-28 17:22:56] [98fd0e87c3eb04e0cc2efde01dbafab6] - RMPD [Histogram, QQplot and Density] [Smokers spiciness...] [2012-11-08 13:32:10] [3d785b0a18e9318da34987d6ff44094a] - R D [Histogram, QQplot and Density] [Smokers spiciness...] [2012-11-08 13:36:42] [2dede82dd31d78da224b8bdad6987e62] [Current] - D [Histogram, QQplot and Density] [Non-smokers spici...] [2012-11-08 13:39:18] [3d785b0a18e9318da34987d6ff44094a] - D [Histogram, QQplot and Density] [Non-smokers spici...] [2012-11-08 13:45:55] [3d785b0a18e9318da34987d6ff44094a] | ||||||||||||||||||||||||||||||
| Feedback Forum | ||||||||||||||||||||||||||||||
Post a new message | ||||||||||||||||||||||||||||||
Dataset | ||||||||||||||||||||||||||||||
| Dataseries X: | ||||||||||||||||||||||||||||||
3 5 4 2 7 1 4 4 7 4 3 3 3 3 2 5 5 3 6 2 | ||||||||||||||||||||||||||||||
Tables (Output of Computation) | ||||||||||||||||||||||||||||||
| ||||||||||||||||||||||||||||||
Figures (Output of Computation) | ||||||||||||||||||||||||||||||
Input Parameters & R Code | ||||||||||||||||||||||||||||||
| Parameters (Session): | ||||||||||||||||||||||||||||||
| par1 = 15 ; | ||||||||||||||||||||||||||||||
| Parameters (R input): | ||||||||||||||||||||||||||||||
| par1 = 15 ; | ||||||||||||||||||||||||||||||
| R code (references can be found in the software module): | ||||||||||||||||||||||||||||||
par1 <- '15' | ||||||||||||||||||||||||||||||