Free Statistics
of Irreproducible Research!
Description of Statistical Computation | |||||||||||||||||||||||||||||||||
|---|---|---|---|---|---|---|---|---|---|---|---|---|---|---|---|---|---|---|---|---|---|---|---|---|---|---|---|---|---|---|---|---|---|
| Author's title | |||||||||||||||||||||||||||||||||
| Author | *The author of this computation has been verified* | ||||||||||||||||||||||||||||||||
| R Software Module | rwasp_meanversusmedian.wasp | ||||||||||||||||||||||||||||||||
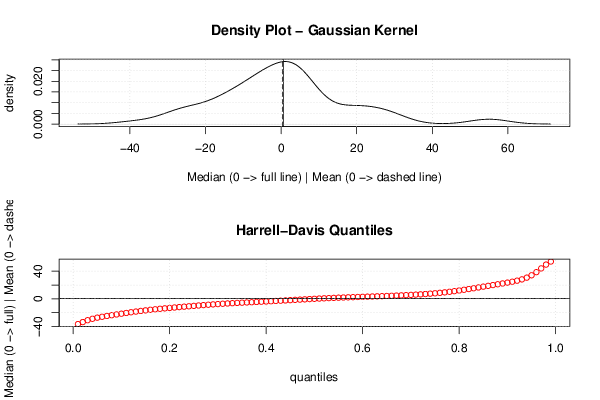
| Title produced by software | Mean versus Median | ||||||||||||||||||||||||||||||||
| Date of computation | Mon, 12 Nov 2012 10:18:10 -0500 | ||||||||||||||||||||||||||||||||
| Cite this page as follows | Statistical Computations at FreeStatistics.org, Office for Research Development and Education, URL https://freestatistics.org/blog/index.php?v=date/2012/Nov/12/t13527335401o3ykmxejesxvj2.htm/, Retrieved Mon, 29 Apr 2024 16:35:58 +0000 | ||||||||||||||||||||||||||||||||
| Statistical Computations at FreeStatistics.org, Office for Research Development and Education, URL https://freestatistics.org/blog/index.php?pk=188014, Retrieved Mon, 29 Apr 2024 16:35:58 +0000 | |||||||||||||||||||||||||||||||||
| QR Codes: | |||||||||||||||||||||||||||||||||
|
| |||||||||||||||||||||||||||||||||
| Original text written by user: | |||||||||||||||||||||||||||||||||
| IsPrivate? | No (this computation is public) | ||||||||||||||||||||||||||||||||
| User-defined keywords | |||||||||||||||||||||||||||||||||
| Estimated Impact | 69 | ||||||||||||||||||||||||||||||||
Tree of Dependent Computations | |||||||||||||||||||||||||||||||||
| Family? (F = Feedback message, R = changed R code, M = changed R Module, P = changed Parameters, D = changed Data) | |||||||||||||||||||||||||||||||||
| - [Mean versus Median] [WS8meanmedian] [2012-11-12 15:18:10] [081b45eff66f9ee50ac0b17603ac2bbc] [Current] - D [Mean versus Median] [meanvsmedian] [2012-12-01 13:44:10] [2f324ead08cc3849e52bae5d3f3d905a] | |||||||||||||||||||||||||||||||||
| Feedback Forum | |||||||||||||||||||||||||||||||||
Post a new message | |||||||||||||||||||||||||||||||||
Dataset | |||||||||||||||||||||||||||||||||
| Dataseries X: | |||||||||||||||||||||||||||||||||
17.75694444 -10.5625 -10.40277778 -24.45138889 7.798611111 56.28472222 2.743055556 -26.97222222 -5.948611111 -13.34861111 5.718055556 -13.86527778 53.75694444 3.3125 30.80555556 -3.409722222 -22.11805556 -38.67361111 -5.215277778 7.194444444 -0.781944444 16.06805556 -14.44861111 27.13472222 3.715277778 3.854166667 -5.944444444 2.881944444 -17.57638889 -7.215277778 -5.965277778 -4.847222222 -11.49027778 -5.806944444 1.176388889 22.38472222 -27.86805556 26.3125 -5.777777778 6.840277778 3.298611111 0.659722222 29.03472222 22.52777778 18.55138889 8.193055556 2.968055556 -25.07361111 -30.65972222 -19.5625 -3.069444444 6.381944444 20.92361111 4.951388889 -18.67361111 2.444444444 1.718055556 -3.056944444 6.634722222 -8.531944444 -14.24305556 -0.895833333 -3.152777778 14.21527778 10.13194444 -13.54861111 0.534722222 2.111111111 | |||||||||||||||||||||||||||||||||
Tables (Output of Computation) | |||||||||||||||||||||||||||||||||
| |||||||||||||||||||||||||||||||||
Figures (Output of Computation) | |||||||||||||||||||||||||||||||||
Input Parameters & R Code | |||||||||||||||||||||||||||||||||
| Parameters (Session): | |||||||||||||||||||||||||||||||||
| Parameters (R input): | |||||||||||||||||||||||||||||||||
| R code (references can be found in the software module): | |||||||||||||||||||||||||||||||||
library(Hmisc) | |||||||||||||||||||||||||||||||||