Free Statistics

of Irreproducible Research!

Author's title

Author*Unverified author*
R Software Modulerwasp_autocorrelation.wasp
Title produced by software(Partial) Autocorrelation Function
Date of computationMon, 12 Nov 2012 18:09:11 -0500
Cite this page as followsStatistical Computations at FreeStatistics.org, Office for Research Development and Education, URL https://freestatistics.org/blog/index.php?v=date/2012/Nov/12/t1352761835hq8ghq5oxo4rp2h.htm/, Retrieved Mon, 29 Apr 2024 15:19:33 +0000
Statistical Computations at FreeStatistics.org, Office for Research Development and Education, URL https://freestatistics.org/blog/index.php?pk=188486, Retrieved Mon, 29 Apr 2024 15:19:33 +0000
QR Codes:

Original text written by user:
IsPrivate?No (this computation is public)
User-defined keywords
Estimated Impact53
Family? (F = Feedback message, R = changed R code, M = changed R Module, P = changed Parameters, D = changed Data)
-       [(Partial) Autocorrelation Function] [] [2012-11-12 23:09:11] [b94d6af934ff01803109e5a51192a6cb] [Current]
Feedback Forum

Post a new message
Dataseries X:
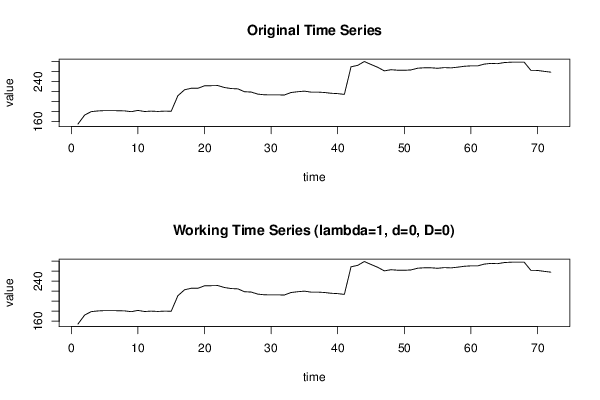
155.28
173.24
180.16
181.52
182.25
182.19
182
181.65
180.07
182.62
180.38
181.15
180.5
181.14
180.93
211.91
223.81
226.88
226.8
231.81
232.06
232.32
228.37
226.31
225.72
219.98
219.31
215.19
213.81
213.7
213.6
213.52
218.39
219.97
221.09
219.17
219.17
218.45
216.88
216.19
214.59
269.87
272.71
280.35
274.5
268.86
261.7
263.98
263.01
262.79
263.59
267
267.89
267.86
266.84
268.24
267.67
269.07
270.87
271.68
271.63
275.21
276.66
276.08
278.3
279.06
279.28
279.12
262.72
262.55
260.7
259.14


Summary of computational transaction
Raw Inputview raw input (R code)
Raw Outputview raw output of R engine
Computing time2 seconds
R Server'Gwilym Jenkins' @ jenkins.wessa.net

\begin{tabular}{lllllllll}
\hline
Summary of computational transaction \tabularnewline
Raw Input & view raw input (R code)  \tabularnewline
Raw Output & view raw output of R engine  \tabularnewline
Computing time & 2 seconds \tabularnewline
R Server & 'Gwilym Jenkins' @ jenkins.wessa.net \tabularnewline
\hline
\end{tabular}
%Source: https://freestatistics.org/blog/index.php?pk=188486&T=0

[TABLE]
[ROW][C]Summary of computational transaction[/C][/ROW]
[ROW][C]Raw Input[/C][C]view raw input (R code) [/C][/ROW]
[ROW][C]Raw Output[/C][C]view raw output of R engine [/C][/ROW]
[ROW][C]Computing time[/C][C]2 seconds[/C][/ROW]
[ROW][C]R Server[/C][C]'Gwilym Jenkins' @ jenkins.wessa.net[/C][/ROW]
[/TABLE]
Source: https://freestatistics.org/blog/index.php?pk=188486&T=0

Globally Unique Identifier (entire table): ba.freestatistics.org/blog/index.php?pk=188486&T=0

As an alternative you can also use a QR Code:  

The GUIDs for individual cells are displayed in the table below:

Summary of computational transaction
Raw Inputview raw input (R code)
Raw Outputview raw output of R engine
Computing time2 seconds
R Server'Gwilym Jenkins' @ jenkins.wessa.net


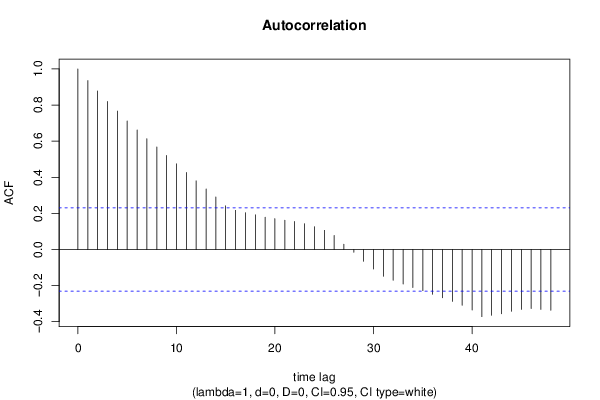
Autocorrelation Function
Time lag kACF(k)T-STATP-value
10.9352177.93560
20.8778187.44850
30.8192736.95180
40.766336.50250
50.7115546.03770
60.6620855.6180
70.6131545.20281e-06
80.5672544.81334e-06
90.5205814.41731.7e-05
100.474154.02337e-05
110.4261443.61590.000276
120.3801373.22560.000946
130.3350522.8430.002906
140.2906532.46630.008017
150.2413592.0480.022104
160.2165211.83720.03515
170.2037881.72920.044029
180.1915211.62510.054255
190.1782081.51210.067437
200.1706271.44780.076005
210.1622751.37690.086397
220.1552991.31780.095882
230.1420681.20550.115981
240.1253421.06360.145541
250.105760.89740.186248
260.0771580.65470.257372
270.028630.24290.404374
28-0.016014-0.13590.446147
29-0.065556-0.55630.289878
30-0.108707-0.92240.179698
31-0.148583-1.26080.105731
32-0.170572-1.44730.07607
33-0.191717-1.62680.054077
34-0.21059-1.78690.03908
35-0.228397-1.9380.028272
36-0.24783-2.10290.019485
37-0.267196-2.26720.01319
38-0.287547-2.43990.008577
39-0.309523-2.62640.005268
40-0.335072-2.84320.002904
41-0.372324-3.15930.001156
42-0.364584-3.09360.001407
43-0.356441-3.02450.001725
44-0.342042-2.90230.002456
45-0.331935-2.81660.00313
46-0.32756-2.77940.003471
47-0.3321-2.8180.003118
48-0.336609-2.85620.0028

\begin{tabular}{lllllllll}
\hline
Autocorrelation Function \tabularnewline
Time lag k & ACF(k) & T-STAT & P-value \tabularnewline
1 & 0.935217 & 7.9356 & 0 \tabularnewline
2 & 0.877818 & 7.4485 & 0 \tabularnewline
3 & 0.819273 & 6.9518 & 0 \tabularnewline
4 & 0.76633 & 6.5025 & 0 \tabularnewline
5 & 0.711554 & 6.0377 & 0 \tabularnewline
6 & 0.662085 & 5.618 & 0 \tabularnewline
7 & 0.613154 & 5.2028 & 1e-06 \tabularnewline
8 & 0.567254 & 4.8133 & 4e-06 \tabularnewline
9 & 0.520581 & 4.4173 & 1.7e-05 \tabularnewline
10 & 0.47415 & 4.0233 & 7e-05 \tabularnewline
11 & 0.426144 & 3.6159 & 0.000276 \tabularnewline
12 & 0.380137 & 3.2256 & 0.000946 \tabularnewline
13 & 0.335052 & 2.843 & 0.002906 \tabularnewline
14 & 0.290653 & 2.4663 & 0.008017 \tabularnewline
15 & 0.241359 & 2.048 & 0.022104 \tabularnewline
16 & 0.216521 & 1.8372 & 0.03515 \tabularnewline
17 & 0.203788 & 1.7292 & 0.044029 \tabularnewline
18 & 0.191521 & 1.6251 & 0.054255 \tabularnewline
19 & 0.178208 & 1.5121 & 0.067437 \tabularnewline
20 & 0.170627 & 1.4478 & 0.076005 \tabularnewline
21 & 0.162275 & 1.3769 & 0.086397 \tabularnewline
22 & 0.155299 & 1.3178 & 0.095882 \tabularnewline
23 & 0.142068 & 1.2055 & 0.115981 \tabularnewline
24 & 0.125342 & 1.0636 & 0.145541 \tabularnewline
25 & 0.10576 & 0.8974 & 0.186248 \tabularnewline
26 & 0.077158 & 0.6547 & 0.257372 \tabularnewline
27 & 0.02863 & 0.2429 & 0.404374 \tabularnewline
28 & -0.016014 & -0.1359 & 0.446147 \tabularnewline
29 & -0.065556 & -0.5563 & 0.289878 \tabularnewline
30 & -0.108707 & -0.9224 & 0.179698 \tabularnewline
31 & -0.148583 & -1.2608 & 0.105731 \tabularnewline
32 & -0.170572 & -1.4473 & 0.07607 \tabularnewline
33 & -0.191717 & -1.6268 & 0.054077 \tabularnewline
34 & -0.21059 & -1.7869 & 0.03908 \tabularnewline
35 & -0.228397 & -1.938 & 0.028272 \tabularnewline
36 & -0.24783 & -2.1029 & 0.019485 \tabularnewline
37 & -0.267196 & -2.2672 & 0.01319 \tabularnewline
38 & -0.287547 & -2.4399 & 0.008577 \tabularnewline
39 & -0.309523 & -2.6264 & 0.005268 \tabularnewline
40 & -0.335072 & -2.8432 & 0.002904 \tabularnewline
41 & -0.372324 & -3.1593 & 0.001156 \tabularnewline
42 & -0.364584 & -3.0936 & 0.001407 \tabularnewline
43 & -0.356441 & -3.0245 & 0.001725 \tabularnewline
44 & -0.342042 & -2.9023 & 0.002456 \tabularnewline
45 & -0.331935 & -2.8166 & 0.00313 \tabularnewline
46 & -0.32756 & -2.7794 & 0.003471 \tabularnewline
47 & -0.3321 & -2.818 & 0.003118 \tabularnewline
48 & -0.336609 & -2.8562 & 0.0028 \tabularnewline
\hline
\end{tabular}
%Source: https://freestatistics.org/blog/index.php?pk=188486&T=1

[TABLE]
[ROW][C]Autocorrelation Function[/C][/ROW]
[ROW][C]Time lag k[/C][C]ACF(k)[/C][C]T-STAT[/C][C]P-value[/C][/ROW]
[ROW][C]1[/C][C]0.935217[/C][C]7.9356[/C][C]0[/C][/ROW]
[ROW][C]2[/C][C]0.877818[/C][C]7.4485[/C][C]0[/C][/ROW]
[ROW][C]3[/C][C]0.819273[/C][C]6.9518[/C][C]0[/C][/ROW]
[ROW][C]4[/C][C]0.76633[/C][C]6.5025[/C][C]0[/C][/ROW]
[ROW][C]5[/C][C]0.711554[/C][C]6.0377[/C][C]0[/C][/ROW]
[ROW][C]6[/C][C]0.662085[/C][C]5.618[/C][C]0[/C][/ROW]
[ROW][C]7[/C][C]0.613154[/C][C]5.2028[/C][C]1e-06[/C][/ROW]
[ROW][C]8[/C][C]0.567254[/C][C]4.8133[/C][C]4e-06[/C][/ROW]
[ROW][C]9[/C][C]0.520581[/C][C]4.4173[/C][C]1.7e-05[/C][/ROW]
[ROW][C]10[/C][C]0.47415[/C][C]4.0233[/C][C]7e-05[/C][/ROW]
[ROW][C]11[/C][C]0.426144[/C][C]3.6159[/C][C]0.000276[/C][/ROW]
[ROW][C]12[/C][C]0.380137[/C][C]3.2256[/C][C]0.000946[/C][/ROW]
[ROW][C]13[/C][C]0.335052[/C][C]2.843[/C][C]0.002906[/C][/ROW]
[ROW][C]14[/C][C]0.290653[/C][C]2.4663[/C][C]0.008017[/C][/ROW]
[ROW][C]15[/C][C]0.241359[/C][C]2.048[/C][C]0.022104[/C][/ROW]
[ROW][C]16[/C][C]0.216521[/C][C]1.8372[/C][C]0.03515[/C][/ROW]
[ROW][C]17[/C][C]0.203788[/C][C]1.7292[/C][C]0.044029[/C][/ROW]
[ROW][C]18[/C][C]0.191521[/C][C]1.6251[/C][C]0.054255[/C][/ROW]
[ROW][C]19[/C][C]0.178208[/C][C]1.5121[/C][C]0.067437[/C][/ROW]
[ROW][C]20[/C][C]0.170627[/C][C]1.4478[/C][C]0.076005[/C][/ROW]
[ROW][C]21[/C][C]0.162275[/C][C]1.3769[/C][C]0.086397[/C][/ROW]
[ROW][C]22[/C][C]0.155299[/C][C]1.3178[/C][C]0.095882[/C][/ROW]
[ROW][C]23[/C][C]0.142068[/C][C]1.2055[/C][C]0.115981[/C][/ROW]
[ROW][C]24[/C][C]0.125342[/C][C]1.0636[/C][C]0.145541[/C][/ROW]
[ROW][C]25[/C][C]0.10576[/C][C]0.8974[/C][C]0.186248[/C][/ROW]
[ROW][C]26[/C][C]0.077158[/C][C]0.6547[/C][C]0.257372[/C][/ROW]
[ROW][C]27[/C][C]0.02863[/C][C]0.2429[/C][C]0.404374[/C][/ROW]
[ROW][C]28[/C][C]-0.016014[/C][C]-0.1359[/C][C]0.446147[/C][/ROW]
[ROW][C]29[/C][C]-0.065556[/C][C]-0.5563[/C][C]0.289878[/C][/ROW]
[ROW][C]30[/C][C]-0.108707[/C][C]-0.9224[/C][C]0.179698[/C][/ROW]
[ROW][C]31[/C][C]-0.148583[/C][C]-1.2608[/C][C]0.105731[/C][/ROW]
[ROW][C]32[/C][C]-0.170572[/C][C]-1.4473[/C][C]0.07607[/C][/ROW]
[ROW][C]33[/C][C]-0.191717[/C][C]-1.6268[/C][C]0.054077[/C][/ROW]
[ROW][C]34[/C][C]-0.21059[/C][C]-1.7869[/C][C]0.03908[/C][/ROW]
[ROW][C]35[/C][C]-0.228397[/C][C]-1.938[/C][C]0.028272[/C][/ROW]
[ROW][C]36[/C][C]-0.24783[/C][C]-2.1029[/C][C]0.019485[/C][/ROW]
[ROW][C]37[/C][C]-0.267196[/C][C]-2.2672[/C][C]0.01319[/C][/ROW]
[ROW][C]38[/C][C]-0.287547[/C][C]-2.4399[/C][C]0.008577[/C][/ROW]
[ROW][C]39[/C][C]-0.309523[/C][C]-2.6264[/C][C]0.005268[/C][/ROW]
[ROW][C]40[/C][C]-0.335072[/C][C]-2.8432[/C][C]0.002904[/C][/ROW]
[ROW][C]41[/C][C]-0.372324[/C][C]-3.1593[/C][C]0.001156[/C][/ROW]
[ROW][C]42[/C][C]-0.364584[/C][C]-3.0936[/C][C]0.001407[/C][/ROW]
[ROW][C]43[/C][C]-0.356441[/C][C]-3.0245[/C][C]0.001725[/C][/ROW]
[ROW][C]44[/C][C]-0.342042[/C][C]-2.9023[/C][C]0.002456[/C][/ROW]
[ROW][C]45[/C][C]-0.331935[/C][C]-2.8166[/C][C]0.00313[/C][/ROW]
[ROW][C]46[/C][C]-0.32756[/C][C]-2.7794[/C][C]0.003471[/C][/ROW]
[ROW][C]47[/C][C]-0.3321[/C][C]-2.818[/C][C]0.003118[/C][/ROW]
[ROW][C]48[/C][C]-0.336609[/C][C]-2.8562[/C][C]0.0028[/C][/ROW]
[/TABLE]
Source: https://freestatistics.org/blog/index.php?pk=188486&T=1

Globally Unique Identifier (entire table): ba.freestatistics.org/blog/index.php?pk=188486&T=1

As an alternative you can also use a QR Code:  

The GUIDs for individual cells are displayed in the table below:

Autocorrelation Function
Time lag kACF(k)T-STATP-value
10.9352177.93560
20.8778187.44850
30.8192736.95180
40.766336.50250
50.7115546.03770
60.6620855.6180
70.6131545.20281e-06
80.5672544.81334e-06
90.5205814.41731.7e-05
100.474154.02337e-05
110.4261443.61590.000276
120.3801373.22560.000946
130.3350522.8430.002906
140.2906532.46630.008017
150.2413592.0480.022104
160.2165211.83720.03515
170.2037881.72920.044029
180.1915211.62510.054255
190.1782081.51210.067437
200.1706271.44780.076005
210.1622751.37690.086397
220.1552991.31780.095882
230.1420681.20550.115981
240.1253421.06360.145541
250.105760.89740.186248
260.0771580.65470.257372
270.028630.24290.404374
28-0.016014-0.13590.446147
29-0.065556-0.55630.289878
30-0.108707-0.92240.179698
31-0.148583-1.26080.105731
32-0.170572-1.44730.07607
33-0.191717-1.62680.054077
34-0.21059-1.78690.03908
35-0.228397-1.9380.028272
36-0.24783-2.10290.019485
37-0.267196-2.26720.01319
38-0.287547-2.43990.008577
39-0.309523-2.62640.005268
40-0.335072-2.84320.002904
41-0.372324-3.15930.001156
42-0.364584-3.09360.001407
43-0.356441-3.02450.001725
44-0.342042-2.90230.002456
45-0.331935-2.81660.00313
46-0.32756-2.77940.003471
47-0.3321-2.8180.003118
48-0.336609-2.85620.0028


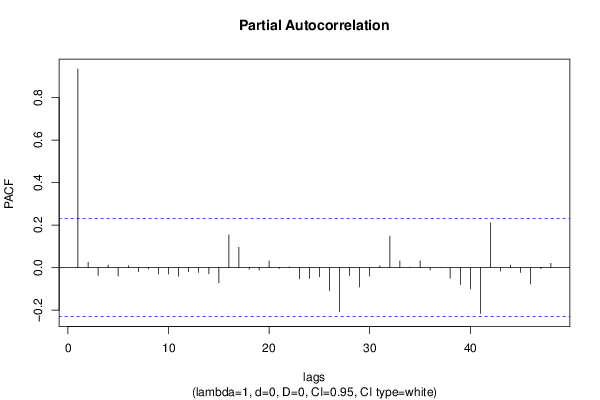
Partial Autocorrelation Function
Time lag kPACF(k)T-STATP-value
10.9352177.93560
20.0254240.21570.414903
3-0.036573-0.31030.378601
40.0117940.10010.460281
5-0.039995-0.33940.367661
60.0086130.07310.47097
7-0.019476-0.16530.434603
8-0.006955-0.0590.476552
9-0.030124-0.25560.39949
10-0.029915-0.25380.400171
11-0.040987-0.34780.364507
12-0.018953-0.16080.436342
13-0.022535-0.19120.424448
14-0.028587-0.24260.404515
15-0.071843-0.60960.27202
160.1539681.30650.097777
170.0955830.8110.210006
18-0.008113-0.06880.472654
19-0.011065-0.09390.46273
200.0308710.2620.397054
21-0.00396-0.03360.486644
220.0032430.02750.489063
23-0.052261-0.44340.329387
24-0.050808-0.43110.333835
25-0.043232-0.36680.357408
26-0.109022-0.92510.179007
27-0.207662-1.76210.041151
28-0.037293-0.31640.37629
29-0.090967-0.77190.221355
30-0.039874-0.33830.368044
310.0086280.07320.470921
320.148071.25640.106513
330.0305190.2590.3982
340.0023120.01960.4922
350.0317940.26980.394051
36-0.010911-0.09260.463246
370.0002870.00240.499033
38-0.050327-0.4270.335312
39-0.079519-0.67470.251001
40-0.100462-0.85240.198396
41-0.216198-1.83450.035355
420.2114841.79450.038465
43-0.016547-0.14040.444366
440.0117660.09980.460376
45-0.023435-0.19890.421469
46-0.076807-0.65170.258326
47-0.005064-0.0430.482921
480.0198910.16880.433223

\begin{tabular}{lllllllll}
\hline
Partial Autocorrelation Function \tabularnewline
Time lag k & PACF(k) & T-STAT & P-value \tabularnewline
1 & 0.935217 & 7.9356 & 0 \tabularnewline
2 & 0.025424 & 0.2157 & 0.414903 \tabularnewline
3 & -0.036573 & -0.3103 & 0.378601 \tabularnewline
4 & 0.011794 & 0.1001 & 0.460281 \tabularnewline
5 & -0.039995 & -0.3394 & 0.367661 \tabularnewline
6 & 0.008613 & 0.0731 & 0.47097 \tabularnewline
7 & -0.019476 & -0.1653 & 0.434603 \tabularnewline
8 & -0.006955 & -0.059 & 0.476552 \tabularnewline
9 & -0.030124 & -0.2556 & 0.39949 \tabularnewline
10 & -0.029915 & -0.2538 & 0.400171 \tabularnewline
11 & -0.040987 & -0.3478 & 0.364507 \tabularnewline
12 & -0.018953 & -0.1608 & 0.436342 \tabularnewline
13 & -0.022535 & -0.1912 & 0.424448 \tabularnewline
14 & -0.028587 & -0.2426 & 0.404515 \tabularnewline
15 & -0.071843 & -0.6096 & 0.27202 \tabularnewline
16 & 0.153968 & 1.3065 & 0.097777 \tabularnewline
17 & 0.095583 & 0.811 & 0.210006 \tabularnewline
18 & -0.008113 & -0.0688 & 0.472654 \tabularnewline
19 & -0.011065 & -0.0939 & 0.46273 \tabularnewline
20 & 0.030871 & 0.262 & 0.397054 \tabularnewline
21 & -0.00396 & -0.0336 & 0.486644 \tabularnewline
22 & 0.003243 & 0.0275 & 0.489063 \tabularnewline
23 & -0.052261 & -0.4434 & 0.329387 \tabularnewline
24 & -0.050808 & -0.4311 & 0.333835 \tabularnewline
25 & -0.043232 & -0.3668 & 0.357408 \tabularnewline
26 & -0.109022 & -0.9251 & 0.179007 \tabularnewline
27 & -0.207662 & -1.7621 & 0.041151 \tabularnewline
28 & -0.037293 & -0.3164 & 0.37629 \tabularnewline
29 & -0.090967 & -0.7719 & 0.221355 \tabularnewline
30 & -0.039874 & -0.3383 & 0.368044 \tabularnewline
31 & 0.008628 & 0.0732 & 0.470921 \tabularnewline
32 & 0.14807 & 1.2564 & 0.106513 \tabularnewline
33 & 0.030519 & 0.259 & 0.3982 \tabularnewline
34 & 0.002312 & 0.0196 & 0.4922 \tabularnewline
35 & 0.031794 & 0.2698 & 0.394051 \tabularnewline
36 & -0.010911 & -0.0926 & 0.463246 \tabularnewline
37 & 0.000287 & 0.0024 & 0.499033 \tabularnewline
38 & -0.050327 & -0.427 & 0.335312 \tabularnewline
39 & -0.079519 & -0.6747 & 0.251001 \tabularnewline
40 & -0.100462 & -0.8524 & 0.198396 \tabularnewline
41 & -0.216198 & -1.8345 & 0.035355 \tabularnewline
42 & 0.211484 & 1.7945 & 0.038465 \tabularnewline
43 & -0.016547 & -0.1404 & 0.444366 \tabularnewline
44 & 0.011766 & 0.0998 & 0.460376 \tabularnewline
45 & -0.023435 & -0.1989 & 0.421469 \tabularnewline
46 & -0.076807 & -0.6517 & 0.258326 \tabularnewline
47 & -0.005064 & -0.043 & 0.482921 \tabularnewline
48 & 0.019891 & 0.1688 & 0.433223 \tabularnewline
\hline
\end{tabular}
%Source: https://freestatistics.org/blog/index.php?pk=188486&T=2

[TABLE]
[ROW][C]Partial Autocorrelation Function[/C][/ROW]
[ROW][C]Time lag k[/C][C]PACF(k)[/C][C]T-STAT[/C][C]P-value[/C][/ROW]
[ROW][C]1[/C][C]0.935217[/C][C]7.9356[/C][C]0[/C][/ROW]
[ROW][C]2[/C][C]0.025424[/C][C]0.2157[/C][C]0.414903[/C][/ROW]
[ROW][C]3[/C][C]-0.036573[/C][C]-0.3103[/C][C]0.378601[/C][/ROW]
[ROW][C]4[/C][C]0.011794[/C][C]0.1001[/C][C]0.460281[/C][/ROW]
[ROW][C]5[/C][C]-0.039995[/C][C]-0.3394[/C][C]0.367661[/C][/ROW]
[ROW][C]6[/C][C]0.008613[/C][C]0.0731[/C][C]0.47097[/C][/ROW]
[ROW][C]7[/C][C]-0.019476[/C][C]-0.1653[/C][C]0.434603[/C][/ROW]
[ROW][C]8[/C][C]-0.006955[/C][C]-0.059[/C][C]0.476552[/C][/ROW]
[ROW][C]9[/C][C]-0.030124[/C][C]-0.2556[/C][C]0.39949[/C][/ROW]
[ROW][C]10[/C][C]-0.029915[/C][C]-0.2538[/C][C]0.400171[/C][/ROW]
[ROW][C]11[/C][C]-0.040987[/C][C]-0.3478[/C][C]0.364507[/C][/ROW]
[ROW][C]12[/C][C]-0.018953[/C][C]-0.1608[/C][C]0.436342[/C][/ROW]
[ROW][C]13[/C][C]-0.022535[/C][C]-0.1912[/C][C]0.424448[/C][/ROW]
[ROW][C]14[/C][C]-0.028587[/C][C]-0.2426[/C][C]0.404515[/C][/ROW]
[ROW][C]15[/C][C]-0.071843[/C][C]-0.6096[/C][C]0.27202[/C][/ROW]
[ROW][C]16[/C][C]0.153968[/C][C]1.3065[/C][C]0.097777[/C][/ROW]
[ROW][C]17[/C][C]0.095583[/C][C]0.811[/C][C]0.210006[/C][/ROW]
[ROW][C]18[/C][C]-0.008113[/C][C]-0.0688[/C][C]0.472654[/C][/ROW]
[ROW][C]19[/C][C]-0.011065[/C][C]-0.0939[/C][C]0.46273[/C][/ROW]
[ROW][C]20[/C][C]0.030871[/C][C]0.262[/C][C]0.397054[/C][/ROW]
[ROW][C]21[/C][C]-0.00396[/C][C]-0.0336[/C][C]0.486644[/C][/ROW]
[ROW][C]22[/C][C]0.003243[/C][C]0.0275[/C][C]0.489063[/C][/ROW]
[ROW][C]23[/C][C]-0.052261[/C][C]-0.4434[/C][C]0.329387[/C][/ROW]
[ROW][C]24[/C][C]-0.050808[/C][C]-0.4311[/C][C]0.333835[/C][/ROW]
[ROW][C]25[/C][C]-0.043232[/C][C]-0.3668[/C][C]0.357408[/C][/ROW]
[ROW][C]26[/C][C]-0.109022[/C][C]-0.9251[/C][C]0.179007[/C][/ROW]
[ROW][C]27[/C][C]-0.207662[/C][C]-1.7621[/C][C]0.041151[/C][/ROW]
[ROW][C]28[/C][C]-0.037293[/C][C]-0.3164[/C][C]0.37629[/C][/ROW]
[ROW][C]29[/C][C]-0.090967[/C][C]-0.7719[/C][C]0.221355[/C][/ROW]
[ROW][C]30[/C][C]-0.039874[/C][C]-0.3383[/C][C]0.368044[/C][/ROW]
[ROW][C]31[/C][C]0.008628[/C][C]0.0732[/C][C]0.470921[/C][/ROW]
[ROW][C]32[/C][C]0.14807[/C][C]1.2564[/C][C]0.106513[/C][/ROW]
[ROW][C]33[/C][C]0.030519[/C][C]0.259[/C][C]0.3982[/C][/ROW]
[ROW][C]34[/C][C]0.002312[/C][C]0.0196[/C][C]0.4922[/C][/ROW]
[ROW][C]35[/C][C]0.031794[/C][C]0.2698[/C][C]0.394051[/C][/ROW]
[ROW][C]36[/C][C]-0.010911[/C][C]-0.0926[/C][C]0.463246[/C][/ROW]
[ROW][C]37[/C][C]0.000287[/C][C]0.0024[/C][C]0.499033[/C][/ROW]
[ROW][C]38[/C][C]-0.050327[/C][C]-0.427[/C][C]0.335312[/C][/ROW]
[ROW][C]39[/C][C]-0.079519[/C][C]-0.6747[/C][C]0.251001[/C][/ROW]
[ROW][C]40[/C][C]-0.100462[/C][C]-0.8524[/C][C]0.198396[/C][/ROW]
[ROW][C]41[/C][C]-0.216198[/C][C]-1.8345[/C][C]0.035355[/C][/ROW]
[ROW][C]42[/C][C]0.211484[/C][C]1.7945[/C][C]0.038465[/C][/ROW]
[ROW][C]43[/C][C]-0.016547[/C][C]-0.1404[/C][C]0.444366[/C][/ROW]
[ROW][C]44[/C][C]0.011766[/C][C]0.0998[/C][C]0.460376[/C][/ROW]
[ROW][C]45[/C][C]-0.023435[/C][C]-0.1989[/C][C]0.421469[/C][/ROW]
[ROW][C]46[/C][C]-0.076807[/C][C]-0.6517[/C][C]0.258326[/C][/ROW]
[ROW][C]47[/C][C]-0.005064[/C][C]-0.043[/C][C]0.482921[/C][/ROW]
[ROW][C]48[/C][C]0.019891[/C][C]0.1688[/C][C]0.433223[/C][/ROW]
[/TABLE]
Source: https://freestatistics.org/blog/index.php?pk=188486&T=2

Globally Unique Identifier (entire table): ba.freestatistics.org/blog/index.php?pk=188486&T=2

As an alternative you can also use a QR Code:  

The GUIDs for individual cells are displayed in the table below:

Partial Autocorrelation Function
Time lag kPACF(k)T-STATP-value
10.9352177.93560
20.0254240.21570.414903
3-0.036573-0.31030.378601
40.0117940.10010.460281
5-0.039995-0.33940.367661
60.0086130.07310.47097
7-0.019476-0.16530.434603
8-0.006955-0.0590.476552
9-0.030124-0.25560.39949
10-0.029915-0.25380.400171
11-0.040987-0.34780.364507
12-0.018953-0.16080.436342
13-0.022535-0.19120.424448
14-0.028587-0.24260.404515
15-0.071843-0.60960.27202
160.1539681.30650.097777
170.0955830.8110.210006
18-0.008113-0.06880.472654
19-0.011065-0.09390.46273
200.0308710.2620.397054
21-0.00396-0.03360.486644
220.0032430.02750.489063
23-0.052261-0.44340.329387
24-0.050808-0.43110.333835
25-0.043232-0.36680.357408
26-0.109022-0.92510.179007
27-0.207662-1.76210.041151
28-0.037293-0.31640.37629
29-0.090967-0.77190.221355
30-0.039874-0.33830.368044
310.0086280.07320.470921
320.148071.25640.106513
330.0305190.2590.3982
340.0023120.01960.4922
350.0317940.26980.394051
36-0.010911-0.09260.463246
370.0002870.00240.499033
38-0.050327-0.4270.335312
39-0.079519-0.67470.251001
40-0.100462-0.85240.198396
41-0.216198-1.83450.035355
420.2114841.79450.038465
43-0.016547-0.14040.444366
440.0117660.09980.460376
45-0.023435-0.19890.421469
46-0.076807-0.65170.258326
47-0.005064-0.0430.482921
480.0198910.16880.433223


Parameters (Session):
par1 = 48 ; par2 = 1 ; par3 = 0 ; par4 = 0 ; par5 = 12 ; par6 = White Noise ; par7 = 0.95 ;
Parameters (R input):
par1 = 48 ; par2 = 1 ; par3 = 0 ; par4 = 0 ; par5 = 12 ; par6 = White Noise ; par7 = 0.95 ; par8 = ;
R code (references can be found in the software module):
par8 <- ''
par7 <- '0.95'
par6 <- 'White Noise'
par5 <- '12'
par4 <- '0'
par3 <- '0'
par2 <- '1'
par1 <- 'Default'
if (par1 == 'Default') {
par1 = 10*log10(length(x))
} else {
par1 <- as.numeric(par1)
}
par2 <- as.numeric(par2)
par3 <- as.numeric(par3)
par4 <- as.numeric(par4)
par5 <- as.numeric(par5)
if (par6 == 'White Noise') par6 <- 'white' else par6 <- 'ma'
par7 <- as.numeric(par7)
if (par8 != '') par8 <- as.numeric(par8)
ox <- x
if (par8 == '') {
if (par2 == 0) {
x <- log(x)
} else {
x <- (x ^ par2 - 1) / par2
}
} else {
x <- log(x,base=par8)
}
if (par3 > 0) x <- diff(x,lag=1,difference=par3)
if (par4 > 0) x <- diff(x,lag=par5,difference=par4)
bitmap(file='picts.png')
op <- par(mfrow=c(2,1))
plot(ox,type='l',main='Original Time Series',xlab='time',ylab='value')
if (par8=='') {
mytitle <- paste('Working Time Series (lambda=',par2,', d=',par3,', D=',par4,')',sep='')
mysub <- paste('(lambda=',par2,', d=',par3,', D=',par4,', CI=', par7, ', CI type=',par6,')',sep='')
} else {
mytitle <- paste('Working Time Series (base=',par8,', d=',par3,', D=',par4,')',sep='')
mysub <- paste('(base=',par8,', d=',par3,', D=',par4,', CI=', par7, ', CI type=',par6,')',sep='')
}
plot(x,type='l', main=mytitle,xlab='time',ylab='value')
par(op)
dev.off()
bitmap(file='pic1.png')
racf <- acf(x, par1, main='Autocorrelation', xlab='time lag', ylab='ACF', ci.type=par6, ci=par7, sub=mysub)
dev.off()
bitmap(file='pic2.png')
rpacf <- pacf(x,par1,main='Partial Autocorrelation',xlab='lags',ylab='PACF',sub=mysub)
dev.off()
(myacf <- c(racf$acf))
(mypacf <- c(rpacf$acf))
lengthx <- length(x)
sqrtn <- sqrt(lengthx)
load(file='createtable')
a<-table.start()
a<-table.row.start(a)
a<-table.element(a,'Autocorrelation Function',4,TRUE)
a<-table.row.end(a)
a<-table.row.start(a)
a<-table.element(a,'Time lag k',header=TRUE)
a<-table.element(a,hyperlink('basics.htm','ACF(k)','click here for more information about the Autocorrelation Function'),header=TRUE)
a<-table.element(a,'T-STAT',header=TRUE)
a<-table.element(a,'P-value',header=TRUE)
a<-table.row.end(a)
for (i in 2:(par1+1)) {
a<-table.row.start(a)
a<-table.element(a,i-1,header=TRUE)
a<-table.element(a,round(myacf[i],6))
mytstat <- myacf[i]*sqrtn
a<-table.element(a,round(mytstat,4))
a<-table.element(a,round(1-pt(abs(mytstat),lengthx),6))
a<-table.row.end(a)
}
a<-table.end(a)
table.save(a,file='mytable.tab')
a<-table.start()
a<-table.row.start(a)
a<-table.element(a,'Partial Autocorrelation Function',4,TRUE)
a<-table.row.end(a)
a<-table.row.start(a)
a<-table.element(a,'Time lag k',header=TRUE)
a<-table.element(a,hyperlink('basics.htm','PACF(k)','click here for more information about the Partial Autocorrelation Function'),header=TRUE)
a<-table.element(a,'T-STAT',header=TRUE)
a<-table.element(a,'P-value',header=TRUE)
a<-table.row.end(a)
for (i in 1:par1) {
a<-table.row.start(a)
a<-table.element(a,i,header=TRUE)
a<-table.element(a,round(mypacf[i],6))
mytstat <- mypacf[i]*sqrtn
a<-table.element(a,round(mytstat,4))
a<-table.element(a,round(1-pt(abs(mytstat),lengthx),6))
a<-table.row.end(a)
}
a<-table.end(a)
table.save(a,file='mytable1.tab')