Free Statistics

of Irreproducible Research!

Author's title

Author*Unverified author*
R Software Modulerwasp_autocorrelation.wasp
Title produced by software(Partial) Autocorrelation Function
Date of computationTue, 13 Nov 2012 04:32:47 -0500
Cite this page as followsStatistical Computations at FreeStatistics.org, Office for Research Development and Education, URL https://freestatistics.org/blog/index.php?v=date/2012/Nov/13/t13527993409milc1t277iy2kz.htm/, Retrieved Sat, 27 Apr 2024 13:38:17 +0000
Statistical Computations at FreeStatistics.org, Office for Research Development and Education, URL https://freestatistics.org/blog/index.php?pk=188627, Retrieved Sat, 27 Apr 2024 13:38:17 +0000
QR Codes:

Original text written by user:
IsPrivate?No (this computation is public)
User-defined keywords
Estimated Impact74
Family? (F = Feedback message, R = changed R code, M = changed R Module, P = changed Parameters, D = changed Data)
-       [(Partial) Autocorrelation Function] [] [2012-11-13 09:32:47] [6e9dcd0648fbf01fc48a73ddbea19f30] [Current]
Feedback Forum

Post a new message
Dataseries X:
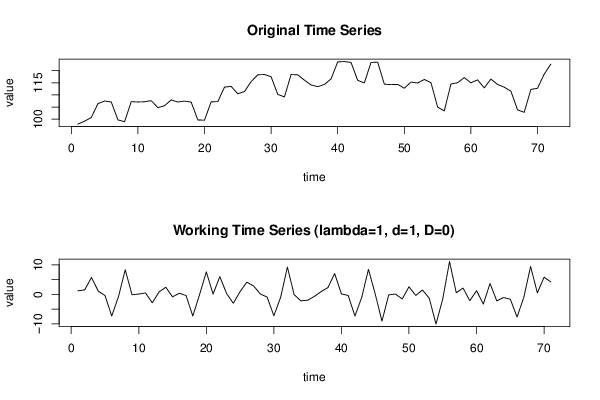
98.01
99.2
100.7
106.41
107.51
107.1
99.75
98.96
107.26
107.11
107.2
107.65
104.78
105.56
107.95
107.11
107.47
107.06
99.71
99.6
107.19
107.26
113.24
113.52
110.48
111.41
115.5
118.32
118.42
117.5
110.23
109.19
118.41
118.3
116.1
114.11
113.41
114.33
116.61
123.64
123.77
123.39
116.03
114.95
123.4
123.53
114.45
114.26
114.35
112.77
115.31
114.93
116.38
115.07
105
103.43
114.52
115.04
117.16
115
116.22
112.92
116.56
114.32
113.22
111.56
103.87
102.85
112.27
112.76
118.55
122.73


Summary of computational transaction
Raw Inputview raw input (R code)
Raw Outputview raw output of R engine
Computing time3 seconds
R Server'Herman Ole Andreas Wold' @ wold.wessa.net

\begin{tabular}{lllllllll}
\hline
Summary of computational transaction \tabularnewline
Raw Input & view raw input (R code)  \tabularnewline
Raw Output & view raw output of R engine  \tabularnewline
Computing time & 3 seconds \tabularnewline
R Server & 'Herman Ole Andreas Wold' @ wold.wessa.net \tabularnewline
\hline
\end{tabular}
%Source: https://freestatistics.org/blog/index.php?pk=188627&T=0

[TABLE]
[ROW][C]Summary of computational transaction[/C][/ROW]
[ROW][C]Raw Input[/C][C]view raw input (R code) [/C][/ROW]
[ROW][C]Raw Output[/C][C]view raw output of R engine [/C][/ROW]
[ROW][C]Computing time[/C][C]3 seconds[/C][/ROW]
[ROW][C]R Server[/C][C]'Herman Ole Andreas Wold' @ wold.wessa.net[/C][/ROW]
[/TABLE]
Source: https://freestatistics.org/blog/index.php?pk=188627&T=0

Globally Unique Identifier (entire table): ba.freestatistics.org/blog/index.php?pk=188627&T=0

As an alternative you can also use a QR Code:  

The GUIDs for individual cells are displayed in the table below:

Summary of computational transaction
Raw Inputview raw input (R code)
Raw Outputview raw output of R engine
Computing time3 seconds
R Server'Herman Ole Andreas Wold' @ wold.wessa.net


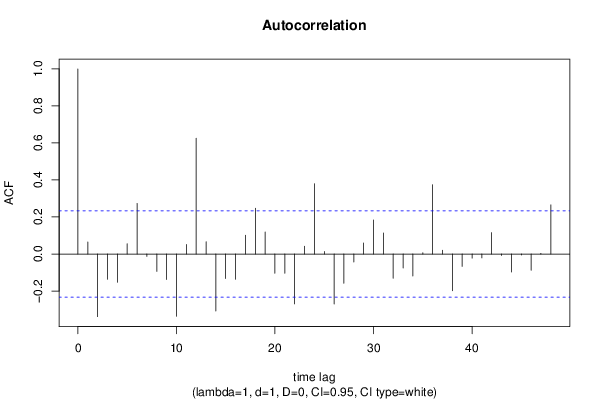
Autocorrelation Function
Time lag kACF(k)T-STATP-value
10.0651810.54920.292288
2-0.338538-2.85260.002838
3-0.136354-1.14890.127219
4-0.152696-1.28660.1012
50.0554690.46740.320826
60.2734322.3040.012077
7-0.012889-0.10860.456913
8-0.094045-0.79240.215372
9-0.137751-1.16070.124823
10-0.336207-2.83290.003
110.0515330.43420.33272
120.6259345.27421e-06
130.0664580.560.288625
14-0.307903-2.59440.005751
15-0.132638-1.11760.133746
16-0.136084-1.14670.127685
170.1011850.85260.198373
180.2475132.08560.020306
190.119081.00340.159542
20-0.104308-0.87890.191207
21-0.103797-0.87460.192367
22-0.269394-2.270.013124
230.0420270.35410.362147
240.3800563.20240.00102
250.0137660.1160.453993
26-0.269778-2.27320.013021
27-0.158139-1.33250.093478
28-0.043241-0.36440.358338
290.0591890.49870.309754
300.1836611.54760.063088
310.113390.95540.171299
32-0.130982-1.10370.13673
33-0.075803-0.63870.262528
34-0.118688-1.00010.160333
350.006550.05520.478072
360.373913.15060.001193
370.0204050.17190.431987
38-0.198781-1.6750.049171
39-0.066888-0.56360.287398
40-0.022478-0.18940.425158
41-0.020968-0.17670.430132
420.1154710.9730.166934
43-0.008033-0.06770.473113
44-0.097571-0.82210.206873
45-0.005294-0.04460.482271
46-0.087848-0.74020.230802
470.0035210.02970.488207
480.2655462.23750.014196

\begin{tabular}{lllllllll}
\hline
Autocorrelation Function \tabularnewline
Time lag k & ACF(k) & T-STAT & P-value \tabularnewline
1 & 0.065181 & 0.5492 & 0.292288 \tabularnewline
2 & -0.338538 & -2.8526 & 0.002838 \tabularnewline
3 & -0.136354 & -1.1489 & 0.127219 \tabularnewline
4 & -0.152696 & -1.2866 & 0.1012 \tabularnewline
5 & 0.055469 & 0.4674 & 0.320826 \tabularnewline
6 & 0.273432 & 2.304 & 0.012077 \tabularnewline
7 & -0.012889 & -0.1086 & 0.456913 \tabularnewline
8 & -0.094045 & -0.7924 & 0.215372 \tabularnewline
9 & -0.137751 & -1.1607 & 0.124823 \tabularnewline
10 & -0.336207 & -2.8329 & 0.003 \tabularnewline
11 & 0.051533 & 0.4342 & 0.33272 \tabularnewline
12 & 0.625934 & 5.2742 & 1e-06 \tabularnewline
13 & 0.066458 & 0.56 & 0.288625 \tabularnewline
14 & -0.307903 & -2.5944 & 0.005751 \tabularnewline
15 & -0.132638 & -1.1176 & 0.133746 \tabularnewline
16 & -0.136084 & -1.1467 & 0.127685 \tabularnewline
17 & 0.101185 & 0.8526 & 0.198373 \tabularnewline
18 & 0.247513 & 2.0856 & 0.020306 \tabularnewline
19 & 0.11908 & 1.0034 & 0.159542 \tabularnewline
20 & -0.104308 & -0.8789 & 0.191207 \tabularnewline
21 & -0.103797 & -0.8746 & 0.192367 \tabularnewline
22 & -0.269394 & -2.27 & 0.013124 \tabularnewline
23 & 0.042027 & 0.3541 & 0.362147 \tabularnewline
24 & 0.380056 & 3.2024 & 0.00102 \tabularnewline
25 & 0.013766 & 0.116 & 0.453993 \tabularnewline
26 & -0.269778 & -2.2732 & 0.013021 \tabularnewline
27 & -0.158139 & -1.3325 & 0.093478 \tabularnewline
28 & -0.043241 & -0.3644 & 0.358338 \tabularnewline
29 & 0.059189 & 0.4987 & 0.309754 \tabularnewline
30 & 0.183661 & 1.5476 & 0.063088 \tabularnewline
31 & 0.11339 & 0.9554 & 0.171299 \tabularnewline
32 & -0.130982 & -1.1037 & 0.13673 \tabularnewline
33 & -0.075803 & -0.6387 & 0.262528 \tabularnewline
34 & -0.118688 & -1.0001 & 0.160333 \tabularnewline
35 & 0.00655 & 0.0552 & 0.478072 \tabularnewline
36 & 0.37391 & 3.1506 & 0.001193 \tabularnewline
37 & 0.020405 & 0.1719 & 0.431987 \tabularnewline
38 & -0.198781 & -1.675 & 0.049171 \tabularnewline
39 & -0.066888 & -0.5636 & 0.287398 \tabularnewline
40 & -0.022478 & -0.1894 & 0.425158 \tabularnewline
41 & -0.020968 & -0.1767 & 0.430132 \tabularnewline
42 & 0.115471 & 0.973 & 0.166934 \tabularnewline
43 & -0.008033 & -0.0677 & 0.473113 \tabularnewline
44 & -0.097571 & -0.8221 & 0.206873 \tabularnewline
45 & -0.005294 & -0.0446 & 0.482271 \tabularnewline
46 & -0.087848 & -0.7402 & 0.230802 \tabularnewline
47 & 0.003521 & 0.0297 & 0.488207 \tabularnewline
48 & 0.265546 & 2.2375 & 0.014196 \tabularnewline
\hline
\end{tabular}
%Source: https://freestatistics.org/blog/index.php?pk=188627&T=1

[TABLE]
[ROW][C]Autocorrelation Function[/C][/ROW]
[ROW][C]Time lag k[/C][C]ACF(k)[/C][C]T-STAT[/C][C]P-value[/C][/ROW]
[ROW][C]1[/C][C]0.065181[/C][C]0.5492[/C][C]0.292288[/C][/ROW]
[ROW][C]2[/C][C]-0.338538[/C][C]-2.8526[/C][C]0.002838[/C][/ROW]
[ROW][C]3[/C][C]-0.136354[/C][C]-1.1489[/C][C]0.127219[/C][/ROW]
[ROW][C]4[/C][C]-0.152696[/C][C]-1.2866[/C][C]0.1012[/C][/ROW]
[ROW][C]5[/C][C]0.055469[/C][C]0.4674[/C][C]0.320826[/C][/ROW]
[ROW][C]6[/C][C]0.273432[/C][C]2.304[/C][C]0.012077[/C][/ROW]
[ROW][C]7[/C][C]-0.012889[/C][C]-0.1086[/C][C]0.456913[/C][/ROW]
[ROW][C]8[/C][C]-0.094045[/C][C]-0.7924[/C][C]0.215372[/C][/ROW]
[ROW][C]9[/C][C]-0.137751[/C][C]-1.1607[/C][C]0.124823[/C][/ROW]
[ROW][C]10[/C][C]-0.336207[/C][C]-2.8329[/C][C]0.003[/C][/ROW]
[ROW][C]11[/C][C]0.051533[/C][C]0.4342[/C][C]0.33272[/C][/ROW]
[ROW][C]12[/C][C]0.625934[/C][C]5.2742[/C][C]1e-06[/C][/ROW]
[ROW][C]13[/C][C]0.066458[/C][C]0.56[/C][C]0.288625[/C][/ROW]
[ROW][C]14[/C][C]-0.307903[/C][C]-2.5944[/C][C]0.005751[/C][/ROW]
[ROW][C]15[/C][C]-0.132638[/C][C]-1.1176[/C][C]0.133746[/C][/ROW]
[ROW][C]16[/C][C]-0.136084[/C][C]-1.1467[/C][C]0.127685[/C][/ROW]
[ROW][C]17[/C][C]0.101185[/C][C]0.8526[/C][C]0.198373[/C][/ROW]
[ROW][C]18[/C][C]0.247513[/C][C]2.0856[/C][C]0.020306[/C][/ROW]
[ROW][C]19[/C][C]0.11908[/C][C]1.0034[/C][C]0.159542[/C][/ROW]
[ROW][C]20[/C][C]-0.104308[/C][C]-0.8789[/C][C]0.191207[/C][/ROW]
[ROW][C]21[/C][C]-0.103797[/C][C]-0.8746[/C][C]0.192367[/C][/ROW]
[ROW][C]22[/C][C]-0.269394[/C][C]-2.27[/C][C]0.013124[/C][/ROW]
[ROW][C]23[/C][C]0.042027[/C][C]0.3541[/C][C]0.362147[/C][/ROW]
[ROW][C]24[/C][C]0.380056[/C][C]3.2024[/C][C]0.00102[/C][/ROW]
[ROW][C]25[/C][C]0.013766[/C][C]0.116[/C][C]0.453993[/C][/ROW]
[ROW][C]26[/C][C]-0.269778[/C][C]-2.2732[/C][C]0.013021[/C][/ROW]
[ROW][C]27[/C][C]-0.158139[/C][C]-1.3325[/C][C]0.093478[/C][/ROW]
[ROW][C]28[/C][C]-0.043241[/C][C]-0.3644[/C][C]0.358338[/C][/ROW]
[ROW][C]29[/C][C]0.059189[/C][C]0.4987[/C][C]0.309754[/C][/ROW]
[ROW][C]30[/C][C]0.183661[/C][C]1.5476[/C][C]0.063088[/C][/ROW]
[ROW][C]31[/C][C]0.11339[/C][C]0.9554[/C][C]0.171299[/C][/ROW]
[ROW][C]32[/C][C]-0.130982[/C][C]-1.1037[/C][C]0.13673[/C][/ROW]
[ROW][C]33[/C][C]-0.075803[/C][C]-0.6387[/C][C]0.262528[/C][/ROW]
[ROW][C]34[/C][C]-0.118688[/C][C]-1.0001[/C][C]0.160333[/C][/ROW]
[ROW][C]35[/C][C]0.00655[/C][C]0.0552[/C][C]0.478072[/C][/ROW]
[ROW][C]36[/C][C]0.37391[/C][C]3.1506[/C][C]0.001193[/C][/ROW]
[ROW][C]37[/C][C]0.020405[/C][C]0.1719[/C][C]0.431987[/C][/ROW]
[ROW][C]38[/C][C]-0.198781[/C][C]-1.675[/C][C]0.049171[/C][/ROW]
[ROW][C]39[/C][C]-0.066888[/C][C]-0.5636[/C][C]0.287398[/C][/ROW]
[ROW][C]40[/C][C]-0.022478[/C][C]-0.1894[/C][C]0.425158[/C][/ROW]
[ROW][C]41[/C][C]-0.020968[/C][C]-0.1767[/C][C]0.430132[/C][/ROW]
[ROW][C]42[/C][C]0.115471[/C][C]0.973[/C][C]0.166934[/C][/ROW]
[ROW][C]43[/C][C]-0.008033[/C][C]-0.0677[/C][C]0.473113[/C][/ROW]
[ROW][C]44[/C][C]-0.097571[/C][C]-0.8221[/C][C]0.206873[/C][/ROW]
[ROW][C]45[/C][C]-0.005294[/C][C]-0.0446[/C][C]0.482271[/C][/ROW]
[ROW][C]46[/C][C]-0.087848[/C][C]-0.7402[/C][C]0.230802[/C][/ROW]
[ROW][C]47[/C][C]0.003521[/C][C]0.0297[/C][C]0.488207[/C][/ROW]
[ROW][C]48[/C][C]0.265546[/C][C]2.2375[/C][C]0.014196[/C][/ROW]
[/TABLE]
Source: https://freestatistics.org/blog/index.php?pk=188627&T=1

Globally Unique Identifier (entire table): ba.freestatistics.org/blog/index.php?pk=188627&T=1

As an alternative you can also use a QR Code:  

The GUIDs for individual cells are displayed in the table below:

Autocorrelation Function
Time lag kACF(k)T-STATP-value
10.0651810.54920.292288
2-0.338538-2.85260.002838
3-0.136354-1.14890.127219
4-0.152696-1.28660.1012
50.0554690.46740.320826
60.2734322.3040.012077
7-0.012889-0.10860.456913
8-0.094045-0.79240.215372
9-0.137751-1.16070.124823
10-0.336207-2.83290.003
110.0515330.43420.33272
120.6259345.27421e-06
130.0664580.560.288625
14-0.307903-2.59440.005751
15-0.132638-1.11760.133746
16-0.136084-1.14670.127685
170.1011850.85260.198373
180.2475132.08560.020306
190.119081.00340.159542
20-0.104308-0.87890.191207
21-0.103797-0.87460.192367
22-0.269394-2.270.013124
230.0420270.35410.362147
240.3800563.20240.00102
250.0137660.1160.453993
26-0.269778-2.27320.013021
27-0.158139-1.33250.093478
28-0.043241-0.36440.358338
290.0591890.49870.309754
300.1836611.54760.063088
310.113390.95540.171299
32-0.130982-1.10370.13673
33-0.075803-0.63870.262528
34-0.118688-1.00010.160333
350.006550.05520.478072
360.373913.15060.001193
370.0204050.17190.431987
38-0.198781-1.6750.049171
39-0.066888-0.56360.287398
40-0.022478-0.18940.425158
41-0.020968-0.17670.430132
420.1154710.9730.166934
43-0.008033-0.06770.473113
44-0.097571-0.82210.206873
45-0.005294-0.04460.482271
46-0.087848-0.74020.230802
470.0035210.02970.488207
480.2655462.23750.014196


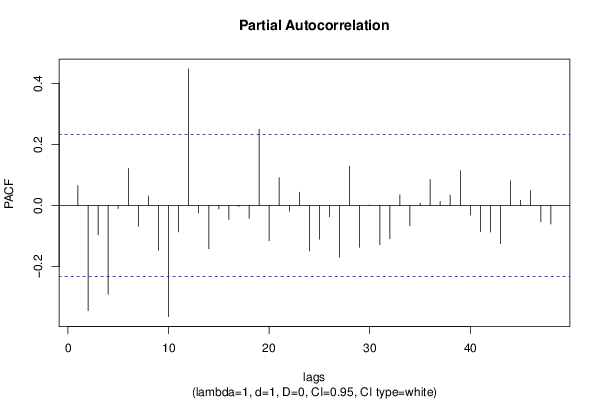
Partial Autocorrelation Function
Time lag kPACF(k)T-STATP-value
10.0651810.54920.292288
2-0.344249-2.90070.002477
3-0.095988-0.80880.210664
4-0.290564-2.44830.008412
5-0.009724-0.08190.467463
60.1214111.0230.154885
7-0.068207-0.57470.283647
80.03120.26290.396695
9-0.147262-1.24090.109373
10-0.363884-3.06610.001533
11-0.086272-0.72690.234827
120.4473743.76960.000167
13-0.024611-0.20740.418155
14-0.141283-1.19050.118913
15-0.011485-0.09680.461589
16-0.045404-0.38260.351585
17-0.003405-0.02870.488596
18-0.041823-0.35240.362787
190.250052.1070.019328
20-0.115572-0.97380.166724
210.0912950.76930.222143
22-0.018765-0.15810.437407
230.0433280.36510.358066
24-0.148362-1.25010.10768
25-0.110062-0.92740.17843
26-0.036378-0.30650.380051
27-0.169044-1.42440.079357
280.1290981.08780.140181
29-0.136605-1.15110.126786
300.000690.00580.497687
31-0.12837-1.08170.141532
32-0.108548-0.91460.181738
330.0351130.29590.384099
34-0.066287-0.55850.289116
350.0080450.06780.473072
360.085020.71640.238049
370.0134950.11370.454895
380.0341880.28810.387064
390.1141240.96160.169751
40-0.030742-0.2590.398179
41-0.085629-0.72150.23648
42-0.086864-0.73190.233311
43-0.124839-1.05190.148204
440.0810360.68280.24847
450.0169380.14270.443456
460.0488250.41140.341008
47-0.053144-0.44780.327831
48-0.060433-0.50920.30609

\begin{tabular}{lllllllll}
\hline
Partial Autocorrelation Function \tabularnewline
Time lag k & PACF(k) & T-STAT & P-value \tabularnewline
1 & 0.065181 & 0.5492 & 0.292288 \tabularnewline
2 & -0.344249 & -2.9007 & 0.002477 \tabularnewline
3 & -0.095988 & -0.8088 & 0.210664 \tabularnewline
4 & -0.290564 & -2.4483 & 0.008412 \tabularnewline
5 & -0.009724 & -0.0819 & 0.467463 \tabularnewline
6 & 0.121411 & 1.023 & 0.154885 \tabularnewline
7 & -0.068207 & -0.5747 & 0.283647 \tabularnewline
8 & 0.0312 & 0.2629 & 0.396695 \tabularnewline
9 & -0.147262 & -1.2409 & 0.109373 \tabularnewline
10 & -0.363884 & -3.0661 & 0.001533 \tabularnewline
11 & -0.086272 & -0.7269 & 0.234827 \tabularnewline
12 & 0.447374 & 3.7696 & 0.000167 \tabularnewline
13 & -0.024611 & -0.2074 & 0.418155 \tabularnewline
14 & -0.141283 & -1.1905 & 0.118913 \tabularnewline
15 & -0.011485 & -0.0968 & 0.461589 \tabularnewline
16 & -0.045404 & -0.3826 & 0.351585 \tabularnewline
17 & -0.003405 & -0.0287 & 0.488596 \tabularnewline
18 & -0.041823 & -0.3524 & 0.362787 \tabularnewline
19 & 0.25005 & 2.107 & 0.019328 \tabularnewline
20 & -0.115572 & -0.9738 & 0.166724 \tabularnewline
21 & 0.091295 & 0.7693 & 0.222143 \tabularnewline
22 & -0.018765 & -0.1581 & 0.437407 \tabularnewline
23 & 0.043328 & 0.3651 & 0.358066 \tabularnewline
24 & -0.148362 & -1.2501 & 0.10768 \tabularnewline
25 & -0.110062 & -0.9274 & 0.17843 \tabularnewline
26 & -0.036378 & -0.3065 & 0.380051 \tabularnewline
27 & -0.169044 & -1.4244 & 0.079357 \tabularnewline
28 & 0.129098 & 1.0878 & 0.140181 \tabularnewline
29 & -0.136605 & -1.1511 & 0.126786 \tabularnewline
30 & 0.00069 & 0.0058 & 0.497687 \tabularnewline
31 & -0.12837 & -1.0817 & 0.141532 \tabularnewline
32 & -0.108548 & -0.9146 & 0.181738 \tabularnewline
33 & 0.035113 & 0.2959 & 0.384099 \tabularnewline
34 & -0.066287 & -0.5585 & 0.289116 \tabularnewline
35 & 0.008045 & 0.0678 & 0.473072 \tabularnewline
36 & 0.08502 & 0.7164 & 0.238049 \tabularnewline
37 & 0.013495 & 0.1137 & 0.454895 \tabularnewline
38 & 0.034188 & 0.2881 & 0.387064 \tabularnewline
39 & 0.114124 & 0.9616 & 0.169751 \tabularnewline
40 & -0.030742 & -0.259 & 0.398179 \tabularnewline
41 & -0.085629 & -0.7215 & 0.23648 \tabularnewline
42 & -0.086864 & -0.7319 & 0.233311 \tabularnewline
43 & -0.124839 & -1.0519 & 0.148204 \tabularnewline
44 & 0.081036 & 0.6828 & 0.24847 \tabularnewline
45 & 0.016938 & 0.1427 & 0.443456 \tabularnewline
46 & 0.048825 & 0.4114 & 0.341008 \tabularnewline
47 & -0.053144 & -0.4478 & 0.327831 \tabularnewline
48 & -0.060433 & -0.5092 & 0.30609 \tabularnewline
\hline
\end{tabular}
%Source: https://freestatistics.org/blog/index.php?pk=188627&T=2

[TABLE]
[ROW][C]Partial Autocorrelation Function[/C][/ROW]
[ROW][C]Time lag k[/C][C]PACF(k)[/C][C]T-STAT[/C][C]P-value[/C][/ROW]
[ROW][C]1[/C][C]0.065181[/C][C]0.5492[/C][C]0.292288[/C][/ROW]
[ROW][C]2[/C][C]-0.344249[/C][C]-2.9007[/C][C]0.002477[/C][/ROW]
[ROW][C]3[/C][C]-0.095988[/C][C]-0.8088[/C][C]0.210664[/C][/ROW]
[ROW][C]4[/C][C]-0.290564[/C][C]-2.4483[/C][C]0.008412[/C][/ROW]
[ROW][C]5[/C][C]-0.009724[/C][C]-0.0819[/C][C]0.467463[/C][/ROW]
[ROW][C]6[/C][C]0.121411[/C][C]1.023[/C][C]0.154885[/C][/ROW]
[ROW][C]7[/C][C]-0.068207[/C][C]-0.5747[/C][C]0.283647[/C][/ROW]
[ROW][C]8[/C][C]0.0312[/C][C]0.2629[/C][C]0.396695[/C][/ROW]
[ROW][C]9[/C][C]-0.147262[/C][C]-1.2409[/C][C]0.109373[/C][/ROW]
[ROW][C]10[/C][C]-0.363884[/C][C]-3.0661[/C][C]0.001533[/C][/ROW]
[ROW][C]11[/C][C]-0.086272[/C][C]-0.7269[/C][C]0.234827[/C][/ROW]
[ROW][C]12[/C][C]0.447374[/C][C]3.7696[/C][C]0.000167[/C][/ROW]
[ROW][C]13[/C][C]-0.024611[/C][C]-0.2074[/C][C]0.418155[/C][/ROW]
[ROW][C]14[/C][C]-0.141283[/C][C]-1.1905[/C][C]0.118913[/C][/ROW]
[ROW][C]15[/C][C]-0.011485[/C][C]-0.0968[/C][C]0.461589[/C][/ROW]
[ROW][C]16[/C][C]-0.045404[/C][C]-0.3826[/C][C]0.351585[/C][/ROW]
[ROW][C]17[/C][C]-0.003405[/C][C]-0.0287[/C][C]0.488596[/C][/ROW]
[ROW][C]18[/C][C]-0.041823[/C][C]-0.3524[/C][C]0.362787[/C][/ROW]
[ROW][C]19[/C][C]0.25005[/C][C]2.107[/C][C]0.019328[/C][/ROW]
[ROW][C]20[/C][C]-0.115572[/C][C]-0.9738[/C][C]0.166724[/C][/ROW]
[ROW][C]21[/C][C]0.091295[/C][C]0.7693[/C][C]0.222143[/C][/ROW]
[ROW][C]22[/C][C]-0.018765[/C][C]-0.1581[/C][C]0.437407[/C][/ROW]
[ROW][C]23[/C][C]0.043328[/C][C]0.3651[/C][C]0.358066[/C][/ROW]
[ROW][C]24[/C][C]-0.148362[/C][C]-1.2501[/C][C]0.10768[/C][/ROW]
[ROW][C]25[/C][C]-0.110062[/C][C]-0.9274[/C][C]0.17843[/C][/ROW]
[ROW][C]26[/C][C]-0.036378[/C][C]-0.3065[/C][C]0.380051[/C][/ROW]
[ROW][C]27[/C][C]-0.169044[/C][C]-1.4244[/C][C]0.079357[/C][/ROW]
[ROW][C]28[/C][C]0.129098[/C][C]1.0878[/C][C]0.140181[/C][/ROW]
[ROW][C]29[/C][C]-0.136605[/C][C]-1.1511[/C][C]0.126786[/C][/ROW]
[ROW][C]30[/C][C]0.00069[/C][C]0.0058[/C][C]0.497687[/C][/ROW]
[ROW][C]31[/C][C]-0.12837[/C][C]-1.0817[/C][C]0.141532[/C][/ROW]
[ROW][C]32[/C][C]-0.108548[/C][C]-0.9146[/C][C]0.181738[/C][/ROW]
[ROW][C]33[/C][C]0.035113[/C][C]0.2959[/C][C]0.384099[/C][/ROW]
[ROW][C]34[/C][C]-0.066287[/C][C]-0.5585[/C][C]0.289116[/C][/ROW]
[ROW][C]35[/C][C]0.008045[/C][C]0.0678[/C][C]0.473072[/C][/ROW]
[ROW][C]36[/C][C]0.08502[/C][C]0.7164[/C][C]0.238049[/C][/ROW]
[ROW][C]37[/C][C]0.013495[/C][C]0.1137[/C][C]0.454895[/C][/ROW]
[ROW][C]38[/C][C]0.034188[/C][C]0.2881[/C][C]0.387064[/C][/ROW]
[ROW][C]39[/C][C]0.114124[/C][C]0.9616[/C][C]0.169751[/C][/ROW]
[ROW][C]40[/C][C]-0.030742[/C][C]-0.259[/C][C]0.398179[/C][/ROW]
[ROW][C]41[/C][C]-0.085629[/C][C]-0.7215[/C][C]0.23648[/C][/ROW]
[ROW][C]42[/C][C]-0.086864[/C][C]-0.7319[/C][C]0.233311[/C][/ROW]
[ROW][C]43[/C][C]-0.124839[/C][C]-1.0519[/C][C]0.148204[/C][/ROW]
[ROW][C]44[/C][C]0.081036[/C][C]0.6828[/C][C]0.24847[/C][/ROW]
[ROW][C]45[/C][C]0.016938[/C][C]0.1427[/C][C]0.443456[/C][/ROW]
[ROW][C]46[/C][C]0.048825[/C][C]0.4114[/C][C]0.341008[/C][/ROW]
[ROW][C]47[/C][C]-0.053144[/C][C]-0.4478[/C][C]0.327831[/C][/ROW]
[ROW][C]48[/C][C]-0.060433[/C][C]-0.5092[/C][C]0.30609[/C][/ROW]
[/TABLE]
Source: https://freestatistics.org/blog/index.php?pk=188627&T=2

Globally Unique Identifier (entire table): ba.freestatistics.org/blog/index.php?pk=188627&T=2

As an alternative you can also use a QR Code:  

The GUIDs for individual cells are displayed in the table below:

Partial Autocorrelation Function
Time lag kPACF(k)T-STATP-value
10.0651810.54920.292288
2-0.344249-2.90070.002477
3-0.095988-0.80880.210664
4-0.290564-2.44830.008412
5-0.009724-0.08190.467463
60.1214111.0230.154885
7-0.068207-0.57470.283647
80.03120.26290.396695
9-0.147262-1.24090.109373
10-0.363884-3.06610.001533
11-0.086272-0.72690.234827
120.4473743.76960.000167
13-0.024611-0.20740.418155
14-0.141283-1.19050.118913
15-0.011485-0.09680.461589
16-0.045404-0.38260.351585
17-0.003405-0.02870.488596
18-0.041823-0.35240.362787
190.250052.1070.019328
20-0.115572-0.97380.166724
210.0912950.76930.222143
22-0.018765-0.15810.437407
230.0433280.36510.358066
24-0.148362-1.25010.10768
25-0.110062-0.92740.17843
26-0.036378-0.30650.380051
27-0.169044-1.42440.079357
280.1290981.08780.140181
29-0.136605-1.15110.126786
300.000690.00580.497687
31-0.12837-1.08170.141532
32-0.108548-0.91460.181738
330.0351130.29590.384099
34-0.066287-0.55850.289116
350.0080450.06780.473072
360.085020.71640.238049
370.0134950.11370.454895
380.0341880.28810.387064
390.1141240.96160.169751
40-0.030742-0.2590.398179
41-0.085629-0.72150.23648
42-0.086864-0.73190.233311
43-0.124839-1.05190.148204
440.0810360.68280.24847
450.0169380.14270.443456
460.0488250.41140.341008
47-0.053144-0.44780.327831
48-0.060433-0.50920.30609


Parameters (Session):
par1 = 48 ; par2 = 1 ; par3 = 1 ; par4 = 0 ; par5 = 12 ; par6 = White Noise ; par7 = 0.95 ;
Parameters (R input):
par1 = 48 ; par2 = 1 ; par3 = 1 ; par4 = 0 ; par5 = 12 ; par6 = White Noise ; par7 = 0.95 ; par8 = ;
R code (references can be found in the software module):
par8 <- ''
par7 <- '0.95'
par6 <- 'White Noise'
par5 <- '12'
par4 <- '0'
par3 <- '1'
par2 <- '1'
par1 <- 'Default'
if (par1 == 'Default') {
par1 = 10*log10(length(x))
} else {
par1 <- as.numeric(par1)
}
par2 <- as.numeric(par2)
par3 <- as.numeric(par3)
par4 <- as.numeric(par4)
par5 <- as.numeric(par5)
if (par6 == 'White Noise') par6 <- 'white' else par6 <- 'ma'
par7 <- as.numeric(par7)
if (par8 != '') par8 <- as.numeric(par8)
ox <- x
if (par8 == '') {
if (par2 == 0) {
x <- log(x)
} else {
x <- (x ^ par2 - 1) / par2
}
} else {
x <- log(x,base=par8)
}
if (par3 > 0) x <- diff(x,lag=1,difference=par3)
if (par4 > 0) x <- diff(x,lag=par5,difference=par4)
bitmap(file='picts.png')
op <- par(mfrow=c(2,1))
plot(ox,type='l',main='Original Time Series',xlab='time',ylab='value')
if (par8=='') {
mytitle <- paste('Working Time Series (lambda=',par2,', d=',par3,', D=',par4,')',sep='')
mysub <- paste('(lambda=',par2,', d=',par3,', D=',par4,', CI=', par7, ', CI type=',par6,')',sep='')
} else {
mytitle <- paste('Working Time Series (base=',par8,', d=',par3,', D=',par4,')',sep='')
mysub <- paste('(base=',par8,', d=',par3,', D=',par4,', CI=', par7, ', CI type=',par6,')',sep='')
}
plot(x,type='l', main=mytitle,xlab='time',ylab='value')
par(op)
dev.off()
bitmap(file='pic1.png')
racf <- acf(x, par1, main='Autocorrelation', xlab='time lag', ylab='ACF', ci.type=par6, ci=par7, sub=mysub)
dev.off()
bitmap(file='pic2.png')
rpacf <- pacf(x,par1,main='Partial Autocorrelation',xlab='lags',ylab='PACF',sub=mysub)
dev.off()
(myacf <- c(racf$acf))
(mypacf <- c(rpacf$acf))
lengthx <- length(x)
sqrtn <- sqrt(lengthx)
load(file='createtable')
a<-table.start()
a<-table.row.start(a)
a<-table.element(a,'Autocorrelation Function',4,TRUE)
a<-table.row.end(a)
a<-table.row.start(a)
a<-table.element(a,'Time lag k',header=TRUE)
a<-table.element(a,hyperlink('basics.htm','ACF(k)','click here for more information about the Autocorrelation Function'),header=TRUE)
a<-table.element(a,'T-STAT',header=TRUE)
a<-table.element(a,'P-value',header=TRUE)
a<-table.row.end(a)
for (i in 2:(par1+1)) {
a<-table.row.start(a)
a<-table.element(a,i-1,header=TRUE)
a<-table.element(a,round(myacf[i],6))
mytstat <- myacf[i]*sqrtn
a<-table.element(a,round(mytstat,4))
a<-table.element(a,round(1-pt(abs(mytstat),lengthx),6))
a<-table.row.end(a)
}
a<-table.end(a)
table.save(a,file='mytable.tab')
a<-table.start()
a<-table.row.start(a)
a<-table.element(a,'Partial Autocorrelation Function',4,TRUE)
a<-table.row.end(a)
a<-table.row.start(a)
a<-table.element(a,'Time lag k',header=TRUE)
a<-table.element(a,hyperlink('basics.htm','PACF(k)','click here for more information about the Partial Autocorrelation Function'),header=TRUE)
a<-table.element(a,'T-STAT',header=TRUE)
a<-table.element(a,'P-value',header=TRUE)
a<-table.row.end(a)
for (i in 1:par1) {
a<-table.row.start(a)
a<-table.element(a,i,header=TRUE)
a<-table.element(a,round(mypacf[i],6))
mytstat <- mypacf[i]*sqrtn
a<-table.element(a,round(mytstat,4))
a<-table.element(a,round(1-pt(abs(mytstat),lengthx),6))
a<-table.row.end(a)
}
a<-table.end(a)
table.save(a,file='mytable1.tab')