Free Statistics
of Irreproducible Research!
Description of Statistical Computation | |||||||||||||||||||||
|---|---|---|---|---|---|---|---|---|---|---|---|---|---|---|---|---|---|---|---|---|---|
| Author's title | |||||||||||||||||||||
| Author | *The author of this computation has been verified* | ||||||||||||||||||||
| R Software Module | rwasp_cloud.wasp | ||||||||||||||||||||
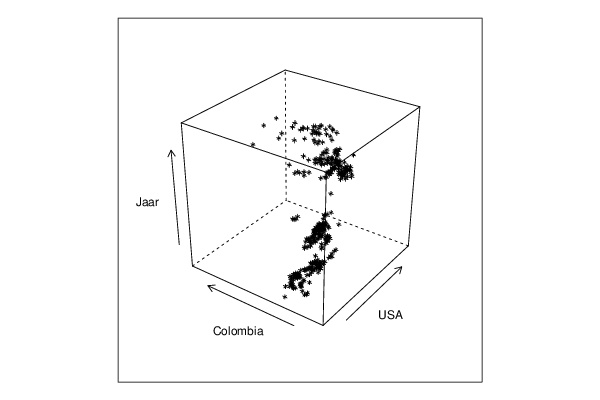
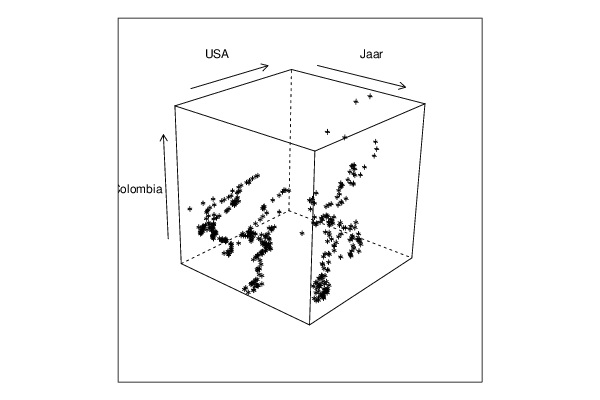
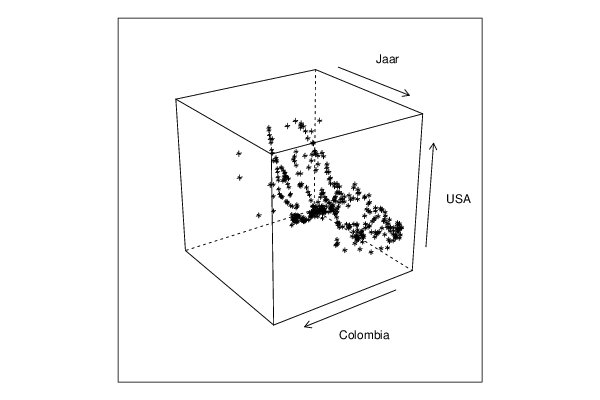
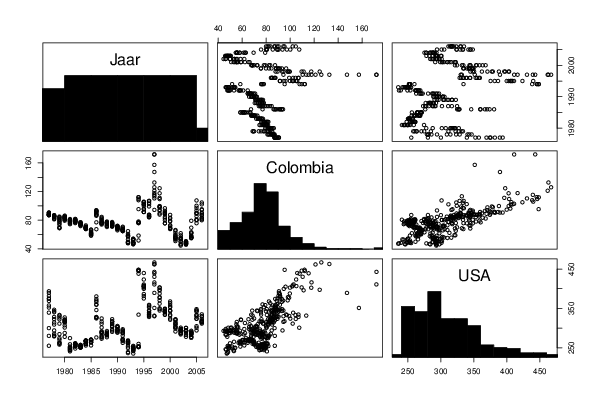
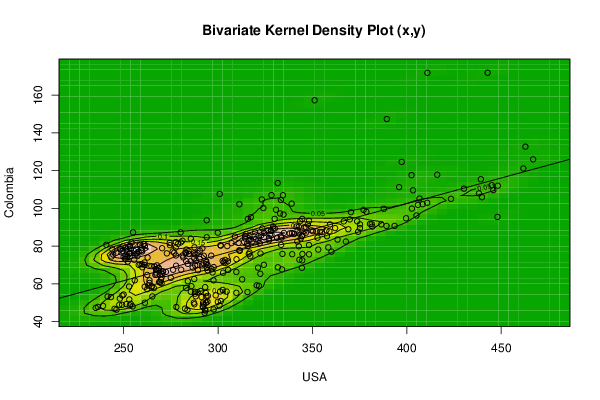
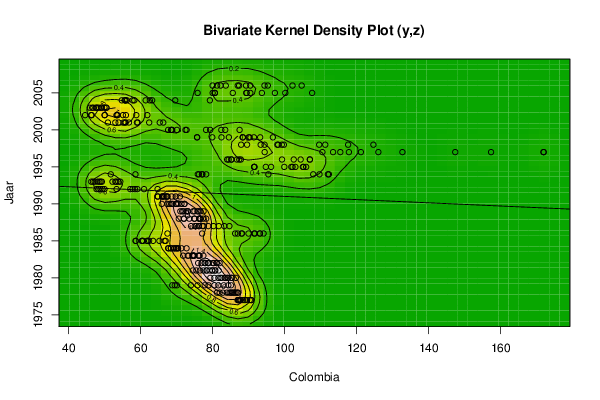
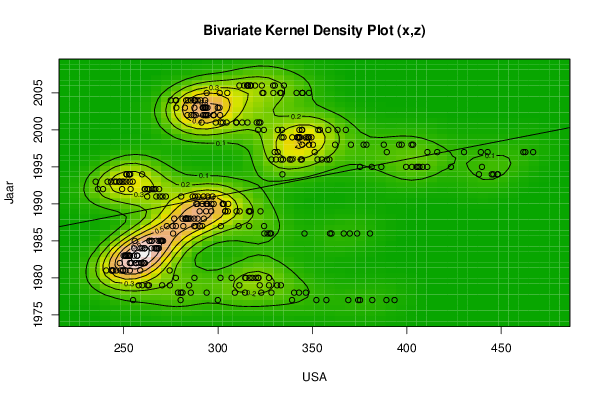
| Title produced by software | Trivariate Scatterplots | ||||||||||||||||||||
| Date of computation | Tue, 13 Nov 2012 09:01:52 -0500 | ||||||||||||||||||||
| Cite this page as follows | Statistical Computations at FreeStatistics.org, Office for Research Development and Education, URL https://freestatistics.org/blog/index.php?v=date/2012/Nov/13/t1352815332wldbkopy8ngko9c.htm/, Retrieved Sat, 27 Apr 2024 21:08:13 +0000 | ||||||||||||||||||||
| Statistical Computations at FreeStatistics.org, Office for Research Development and Education, URL https://freestatistics.org/blog/index.php?pk=188869, Retrieved Sat, 27 Apr 2024 21:08:13 +0000 | |||||||||||||||||||||
| QR Codes: | |||||||||||||||||||||
|
| |||||||||||||||||||||
| Original text written by user: | |||||||||||||||||||||
| IsPrivate? | No (this computation is public) | ||||||||||||||||||||
| User-defined keywords | |||||||||||||||||||||
| Estimated Impact | 83 | ||||||||||||||||||||
Tree of Dependent Computations | |||||||||||||||||||||
| Family? (F = Feedback message, R = changed R code, M = changed R Module, P = changed Parameters, D = changed Data) | |||||||||||||||||||||
| - [Trivariate Scatterplots] [] [2012-11-13 14:01:52] [8ef774223c33aeb01bbe576fe01aa7ae] [Current] | |||||||||||||||||||||
| Feedback Forum | |||||||||||||||||||||
Post a new message | |||||||||||||||||||||
Dataset | |||||||||||||||||||||
| Dataseries X: | |||||||||||||||||||||
255 280.2 299.9 339.2 374.2 393.5 389.2 381.7 375.2 369 357.4 352.1 346.5 342.9 340.3 328.3 322.9 314.3 308.9 294 285.6 281.2 280.3 278.8 274.5 270.4 263.4 259.9 258 262.7 284.7 311.3 322.1 327 331.3 333.3 321.4 327 320 314.7 316.7 314.4 321.3 318.2 307.2 301.3 287.5 277.7 274.4 258.8 253.3 251 248.4 249.5 246.1 244.5 243.6 244 240.8 249.8 248 259.4 260.5 260.8 261.3 259.5 256.6 257.9 256.5 254.2 253.3 253.8 255.5 257.1 257.3 253.2 252.8 252 250.7 252.2 250 251 253.4 251.2 255.6 261.1 258.9 259.9 261.2 264.7 267.1 266.4 267.7 268.6 267.5 268.5 268.5 270.5 270.9 270.1 269.3 269.8 270.1 264.9 263.7 264.8 263.7 255.9 276.2 360.1 380.5 373.7 369.8 366.6 359.3 345.8 326.2 324.5 328.1 327.5 324.4 316.5 310.9 301.5 291.7 290.4 287.4 277.7 281.6 288 276 272.9 283 283.3 276.8 284.5 282.7 281.2 287.4 283.1 284 285.5 289.2 292.5 296.4 305.2 303.9 311.5 316.3 316.7 322.5 317.1 309.8 303.8 290.3 293.7 291.7 296.5 289.1 288.5 293.8 297.7 305.4 302.7 302.5 303 294.5 294.1 294.5 297.1 289.4 292.4 287.9 286.6 280.5 272.4 269.2 270.6 267.3 262.5 266.8 268.8 263.1 261.2 266 262.5 265.2 261.3 253.7 249.2 239.1 236.4 235.2 245.2 246.2 247.7 251.4 253.3 254.8 250 249.3 241.5 243.3 248 253 252.9 251.5 251.6 253.5 259.8 334.1 448 445.8 445 448.2 438.2 439.8 423.4 410.8 408.4 406.7 405.9 402.7 405.1 399.6 386.5 381.4 375.2 357.7 359 355 352.7 344.4 343.8 338 339 333.3 334.4 328.3 330.7 330 331.6 351.2 389.4 410.9 442.8 462.8 466.9 461.7 439.2 430.3 416.1 402.5 397.3 403.3 395.9 387.8 378.6 377.1 370.4 362 350.3 348.2 344.6 343.5 342.8 347.6 346.6 349.5 342.1 342 342.8 339.3 348.2 333.7 334.7 354 367.7 363.3 358.4 353.1 343.1 344.6 344.4 333.9 331.7 324.3 321.2 322.4 321.7 320.5 312.8 309.7 315.6 309.7 304.6 302.5 301.5 298.8 291.3 293.6 294.6 285.9 297.6 301.1 293.8 297.7 292.9 292.1 287.2 288.2 283.8 299.9 292.4 293.3 300.8 293.7 293.1 294.4 292.1 291.9 282.5 277.9 287.5 289.2 285.6 293.2 290.8 283.1 275 287.8 287.8 287.4 284 277.8 277.6 304.9 294 300.9 324 332.9 341.6 333.4 348.2 344.7 344.7 329.3 323.5 323.2 317.4 330.1 329.2 334.9 315.8 315.4 319.6 317.3 313.8 315.8 311.3 | |||||||||||||||||||||
| Dataseries Y: | |||||||||||||||||||||
87.28 87.28 87.09 86.92 87.59 90.72 90.69 90.3 89.55 88.94 88.41 87.82 87.07 86.82 86.4 86.02 85.66 85.32 85 84.67 83.94 82.83 81.95 81.19 80.48 78.86 69.47 68.77 70.06 73.95 75.8 77.79 81.57 83.07 84.34 85.1 85.25 84.26 83.63 86.44 85.3 84.1 83.36 82.48 81.58 80.47 79.34 82.13 81.69 80.7 79.88 79.16 78.38 77.42 76.47 75.46 74.48 78.27 80.7 79.91 78.75 77.78 81.14 81.08 80.03 78.91 78.01 76.9 75.97 81.93 80.27 78.67 77.42 76.16 74.7 76.39 76.04 74.65 73.29 71.79 74.39 74.91 74.54 73.08 72.75 71.32 70.38 70.35 70.01 69.36 67.77 69.26 69.8 68.38 67.62 68.39 66.95 65.21 66.64 63.45 60.66 62.34 60.32 58.64 60.46 58.59 61.87 61.85 67.44 77.06 91.74 93.15 94.15 93.11 91.51 89.96 88.16 86.98 88.03 86.24 84.65 83.23 81.7 80.25 78.8 77.51 76.2 75.04 74 75.49 77.14 76.15 76.27 78.19 76.49 77.31 76.65 74.99 73.51 72.07 70.59 71.96 76.29 74.86 74.93 71.9 71.01 77.47 75.78 76.6 76.07 74.57 73.02 72.65 73.16 71.53 69.78 67.98 69.96 72.16 70.47 68.86 67.37 65.87 72.16 71.34 69.93 68.44 67.16 66.01 67.25 70.91 69.75 68.59 67.48 66.31 64.81 66.58 65.97 64.7 64.7 60.94 59.08 58.42 57.77 57.11 53.31 49.96 49.4 48.84 48.3 47.74 47.24 46.76 46.29 48.9 49.23 48.53 48.03 54.34 53.79 53.24 52.96 52.17 51.7 58.55 78.2 77.03 76.19 77.15 75.87 95.47 109.67 112.28 112.01 107.93 105.96 105.06 102.98 102.2 105.23 101.85 99.89 96.23 94.76 91.51 91.63 91.54 85.23 87.83 87.38 84.44 85.19 84.03 86.73 102.52 104.45 106.98 107.02 99.26 94.45 113.44 157.33 147.38 171.89 171.95 132.71 126.02 121.18 115.45 110.48 117.85 117.63 124.65 109.59 111.27 99.78 98.21 99.2 97.97 89.55 87.91 93.34 94.42 93.2 90.29 91.46 89.98 88.35 88.41 82.44 79.89 75.69 75.66 84.5 96.73 87.48 82.39 83.48 79.31 78.16 72.77 72.45 68.46 67.62 68.76 70.07 68.55 65.3 58.96 59.17 62.37 66.28 55.62 55.23 55.85 56.75 50.89 53.88 52.95 55.08 53.61 58.78 61.85 55.91 53.32 46.41 44.57 50 50 53.36 46.23 50.45 49.07 45.85 48.45 49.96 46.53 50.51 47.58 48.05 46.84 47.67 49.16 55.54 55.82 58.22 56.19 57.77 63.19 54.76 55.74 62.54 61.39 69.6 79.23 80 93.68 107.63 100.18 97.3 90.45 80.64 80.58 75.82 85.59 89.35 89.42 104.73 95.32 89.27 90.44 86.97 79.98 81.22 87.35 83.64 82.22 94.4 102.18 | |||||||||||||||||||||
| Dataseries Z: | |||||||||||||||||||||
1977 1977 1977 1977 1977 1977 1977 1977 1977 1977 1977 1977 1978 1978 1978 1978 1978 1978 1978 1978 1978 1978 1978 1978 1979 1979 1979 1979 1979 1979 1979 1979 1979 1979 1979 1979 1980 1980 1980 1980 1980 1980 1980 1980 1980 1980 1980 1980 1981 1981 1981 1981 1981 1981 1981 1981 1981 1981 1981 1981 1982 1982 1982 1982 1982 1982 1982 1982 1982 1982 1982 1982 1983 1983 1983 1983 1983 1983 1983 1983 1983 1983 1983 1983 1984 1984 1984 1984 1984 1984 1984 1984 1984 1984 1984 1984 1985 1985 1985 1985 1985 1985 1985 1985 1985 1985 1985 1985 1986 1986 1986 1986 1986 1986 1986 1986 1986 1986 1986 1986 1987 1987 1987 1987 1987 1987 1987 1987 1987 1987 1987 1987 1988 1988 1988 1988 1988 1988 1988 1988 1988 1988 1988 1988 1989 1989 1989 1989 1989 1989 1989 1989 1989 1989 1989 1989 1990 1990 1990 1990 1990 1990 1990 1990 1990 1990 1990 1990 1991 1991 1991 1991 1991 1991 1991 1991 1991 1991 1991 1991 1992 1992 1992 1992 1992 1992 1992 1992 1992 1992 1992 1992 1993 1993 1993 1993 1993 1993 1993 1993 1993 1993 1993 1993 1994 1994 1994 1994 1994 1994 1994 1994 1994 1994 1994 1994 1995 1995 1995 1995 1995 1995 1995 1995 1995 1995 1995 1995 1996 1996 1996 1996 1996 1996 1996 1996 1996 1996 1996 1996 1997 1997 1997 1997 1997 1997 1997 1997 1997 1997 1997 1997 1998 1998 1998 1998 1998 1998 1998 1998 1998 1998 1998 1998 1999 1999 1999 1999 1999 1999 1999 1999 1999 1999 1999 1999 2000 2000 2000 2000 2000 2000 2000 2000 2000 2000 2000 2000 2001 2001 2001 2001 2001 2001 2001 2001 2001 2001 2001 2001 2002 2002 2002 2002 2002 2002 2002 2002 2002 2002 2002 2002 2003 2003 2003 2003 2003 2003 2003 2003 2003 2003 2003 2003 2004 2004 2004 2004 2004 2004 2004 2004 2004 2004 2004 2004 2005 2005 2005 2005 2005 2005 2005 2005 2005 2005 2005 2005 2006 2006 2006 2006 2006 2006 2006 2006 2006 2006 2006 2006 | |||||||||||||||||||||
Tables (Output of Computation) | |||||||||||||||||||||
| |||||||||||||||||||||
Figures (Output of Computation) | |||||||||||||||||||||
Input Parameters & R Code | |||||||||||||||||||||
| Parameters (Session): | |||||||||||||||||||||
| par1 = 50 ; par2 = 50 ; par3 = Y ; par4 = Y ; par5 = USA ; par6 = Colombia ; par7 = Jaar ; | |||||||||||||||||||||
| Parameters (R input): | |||||||||||||||||||||
| par1 = 50 ; par2 = 50 ; par3 = Y ; par4 = Y ; par5 = USA ; par6 = Colombia ; par7 = Jaar ; | |||||||||||||||||||||
| R code (references can be found in the software module): | |||||||||||||||||||||
x <- array(x,dim=c(length(x),1)) | |||||||||||||||||||||