Free Statistics

of Irreproducible Research!

Author's title

Author*The author of this computation has been verified*
R Software Modulerwasp_multipleregression.wasp
Title produced by softwareMultiple Regression
Date of computationMon, 19 Nov 2012 09:07:39 -0500
Cite this page as followsStatistical Computations at FreeStatistics.org, Office for Research Development and Education, URL https://freestatistics.org/blog/index.php?v=date/2012/Nov/19/t13533340860k1m1kca6zflfyj.htm/, Retrieved Sat, 27 Apr 2024 23:39:55 +0000
Statistical Computations at FreeStatistics.org, Office for Research Development and Education, URL https://freestatistics.org/blog/index.php?pk=190522, Retrieved Sat, 27 Apr 2024 23:39:55 +0000
QR Codes:

Original text written by user:
IsPrivate?No (this computation is public)
User-defined keywords
Estimated Impact71
Family? (F = Feedback message, R = changed R code, M = changed R Module, P = changed Parameters, D = changed Data)
-     [Multiple Regression] [Competence to learn] [2010-11-17 07:43:53] [b98453cac15ba1066b407e146608df68]
- R  D  [Multiple Regression] [WS 7 1] [2011-11-21 12:02:50] [0c0832a80cf4628193d5c1e6a08841d7]
-   PD      [Multiple Regression] [Mini-Tutorial] [2012-11-19 14:07:39] [90f4fc95bc23bd40c615363dd079f863] [Current]
-   P         [Multiple Regression] [Mini-Tutorial] [2012-11-19 14:10:28] [3ba5358ad212dca7c498c7fc6d6ebde5]
Feedback Forum

Post a new message
Dataseries X:
150580	77	45588	9653	62991	41	39
99611	35	45097	8914	49363	54	54
19349	11	3895	786	9604	14	14
99373	63	28394	6700	24552	25	24
86230	44	18632	5788	31493	25	24
30837	19	2325	593	3439	8	8
31706	13	25139	4506	19555	26	26
89806	42	27975	6382	21228	20	19
62088	38	14483	5621	23177	11	11
40151	29	13127	3997	22094	14	14
27634	20	5839	520	2342	3	1
76990	27	24069	8891	38798	40	39
37460	20	3738	999	3255	5	5
54157	19	18625	7067	24261	38	37
49862	37	36341	4639	18511	32	32
84337	26	24548	5654	40798	41	38
64175	42	21792	6928	28893	46	47
59382	49	26263	1514	21425	47	47
119308	30	23686	9238	50276	37	37
76702	49	49303	8204	37643	51	51
103425	67	25659	5926	30377	49	45
70344	28	28904	5785	27126	21	21
43410	19	2781	4	13	1	1
104838	49	29236	5930	42097	44	42
62215	27	19546	3710	24451	26	26
69304	30	22818	705	14335	21	21
53117	22	32689	443	5084	4	4
19764	12	5752	2416	9927	10	10
86680	31	22197	7747	43527	43	43
84105	20	20055	5432	27184	34	34
77945	20	25272	4913	21610	32	31
89113	39	82206	2650	20484	20	19
91005	29	32073	2370	20156	34	34
40248	16	5444	775	6012	6	6
64187	27	20154	5576	18475	12	11
50857	21	36944	1352	12645	24	24
56613	19	8019	3080	11017	16	16
62792	35	30884	10205	37623	72	72
72535	14	19540	6095	35873	27	21


Summary of computational transaction
Raw Inputview raw input (R code)
Raw Outputview raw output of R engine
Computing time6 seconds
R Server'Herman Ole Andreas Wold' @ wold.wessa.net

\begin{tabular}{lllllllll}
\hline
Summary of computational transaction \tabularnewline
Raw Input & view raw input (R code)  \tabularnewline
Raw Output & view raw output of R engine  \tabularnewline
Computing time & 6 seconds \tabularnewline
R Server & 'Herman Ole Andreas Wold' @ wold.wessa.net \tabularnewline
\hline
\end{tabular}
%Source: https://freestatistics.org/blog/index.php?pk=190522&T=0

[TABLE]
[ROW][C]Summary of computational transaction[/C][/ROW]
[ROW][C]Raw Input[/C][C]view raw input (R code) [/C][/ROW]
[ROW][C]Raw Output[/C][C]view raw output of R engine [/C][/ROW]
[ROW][C]Computing time[/C][C]6 seconds[/C][/ROW]
[ROW][C]R Server[/C][C]'Herman Ole Andreas Wold' @ wold.wessa.net[/C][/ROW]
[/TABLE]
Source: https://freestatistics.org/blog/index.php?pk=190522&T=0

Globally Unique Identifier (entire table): ba.freestatistics.org/blog/index.php?pk=190522&T=0

As an alternative you can also use a QR Code:  

The GUIDs for individual cells are displayed in the table below:

Summary of computational transaction
Raw Inputview raw input (R code)
Raw Outputview raw output of R engine
Computing time6 seconds
R Server'Herman Ole Andreas Wold' @ wold.wessa.net


Multiple Linear Regression - Estimated Regression Equation
TimeRFC[t] = + 6502.71131416814 + 829.756999128733`#Logins`[t] + 0.196074056762163`#characters`[t] -0.773163781215985`#revisions`[t] + 1.63206035759499`#seconds`[t] -22.8244576103107`#Hyperlinks`[t] -514.112233299791`#Blogs`[t] + 493.81343133437t + e[t]

\begin{tabular}{lllllllll}
\hline
Multiple Linear Regression - Estimated Regression Equation \tabularnewline
TimeRFC[t] =  +  6502.71131416814 +  829.756999128733`#Logins`[t] +  0.196074056762163`#characters`[t] -0.773163781215985`#revisions`[t] +  1.63206035759499`#seconds`[t] -22.8244576103107`#Hyperlinks`[t] -514.112233299791`#Blogs`[t] +  493.81343133437t  + e[t] \tabularnewline
\hline
\end{tabular}
%Source: https://freestatistics.org/blog/index.php?pk=190522&T=1

[TABLE]
[ROW][C]Multiple Linear Regression - Estimated Regression Equation[/C][/ROW]
[ROW][C]TimeRFC[t] =  +  6502.71131416814 +  829.756999128733`#Logins`[t] +  0.196074056762163`#characters`[t] -0.773163781215985`#revisions`[t] +  1.63206035759499`#seconds`[t] -22.8244576103107`#Hyperlinks`[t] -514.112233299791`#Blogs`[t] +  493.81343133437t  + e[t][/C][/ROW]
[/TABLE]
Source: https://freestatistics.org/blog/index.php?pk=190522&T=1

Globally Unique Identifier (entire table): ba.freestatistics.org/blog/index.php?pk=190522&T=1

As an alternative you can also use a QR Code:  

The GUIDs for individual cells are displayed in the table below:

Multiple Linear Regression - Estimated Regression Equation
TimeRFC[t] = + 6502.71131416814 + 829.756999128733`#Logins`[t] + 0.196074056762163`#characters`[t] -0.773163781215985`#revisions`[t] + 1.63206035759499`#seconds`[t] -22.8244576103107`#Hyperlinks`[t] -514.112233299791`#Blogs`[t] + 493.81343133437t + e[t]


Multiple Linear Regression - Ordinary Least Squares
VariableParameterS.D.T-STATH0: parameter = 02-tail p-value1-tail p-value
(Intercept)6502.711314168147286.8571550.89240.379060.18953
`#Logins`829.756999128733188.9409424.39160.0001226.1e-05
`#characters`0.1960740567621630.1736881.12890.2676060.133803
`#revisions`-0.7731637812159851.559134-0.49590.6234670.311734
`#seconds`1.632060357594990.3626914.49999e-054.5e-05
`#Hyperlinks`-22.82445761031071806.832018-0.01260.9900020.495001
`#Blogs`-514.1122332997911752.668316-0.29330.7712240.385612
t493.81343133437213.6891932.31090.0276570.013828

\begin{tabular}{lllllllll}
\hline
Multiple Linear Regression - Ordinary Least Squares \tabularnewline
Variable & Parameter & S.D. & T-STATH0: parameter = 0 & 2-tail p-value & 1-tail p-value \tabularnewline
(Intercept) & 6502.71131416814 & 7286.857155 & 0.8924 & 0.37906 & 0.18953 \tabularnewline
`#Logins` & 829.756999128733 & 188.940942 & 4.3916 & 0.000122 & 6.1e-05 \tabularnewline
`#characters` & 0.196074056762163 & 0.173688 & 1.1289 & 0.267606 & 0.133803 \tabularnewline
`#revisions` & -0.773163781215985 & 1.559134 & -0.4959 & 0.623467 & 0.311734 \tabularnewline
`#seconds` & 1.63206035759499 & 0.362691 & 4.4999 & 9e-05 & 4.5e-05 \tabularnewline
`#Hyperlinks` & -22.8244576103107 & 1806.832018 & -0.0126 & 0.990002 & 0.495001 \tabularnewline
`#Blogs` & -514.112233299791 & 1752.668316 & -0.2933 & 0.771224 & 0.385612 \tabularnewline
t & 493.81343133437 & 213.689193 & 2.3109 & 0.027657 & 0.013828 \tabularnewline
\hline
\end{tabular}
%Source: https://freestatistics.org/blog/index.php?pk=190522&T=2

[TABLE]
[ROW][C]Multiple Linear Regression - Ordinary Least Squares[/C][/ROW]
[ROW][C]Variable[/C][C]Parameter[/C][C]S.D.[/C][C]T-STATH0: parameter = 0[/C][C]2-tail p-value[/C][C]1-tail p-value[/C][/ROW]
[ROW][C](Intercept)[/C][C]6502.71131416814[/C][C]7286.857155[/C][C]0.8924[/C][C]0.37906[/C][C]0.18953[/C][/ROW]
[ROW][C]`#Logins`[/C][C]829.756999128733[/C][C]188.940942[/C][C]4.3916[/C][C]0.000122[/C][C]6.1e-05[/C][/ROW]
[ROW][C]`#characters`[/C][C]0.196074056762163[/C][C]0.173688[/C][C]1.1289[/C][C]0.267606[/C][C]0.133803[/C][/ROW]
[ROW][C]`#revisions`[/C][C]-0.773163781215985[/C][C]1.559134[/C][C]-0.4959[/C][C]0.623467[/C][C]0.311734[/C][/ROW]
[ROW][C]`#seconds`[/C][C]1.63206035759499[/C][C]0.362691[/C][C]4.4999[/C][C]9e-05[/C][C]4.5e-05[/C][/ROW]
[ROW][C]`#Hyperlinks`[/C][C]-22.8244576103107[/C][C]1806.832018[/C][C]-0.0126[/C][C]0.990002[/C][C]0.495001[/C][/ROW]
[ROW][C]`#Blogs`[/C][C]-514.112233299791[/C][C]1752.668316[/C][C]-0.2933[/C][C]0.771224[/C][C]0.385612[/C][/ROW]
[ROW][C]t[/C][C]493.81343133437[/C][C]213.689193[/C][C]2.3109[/C][C]0.027657[/C][C]0.013828[/C][/ROW]
[/TABLE]
Source: https://freestatistics.org/blog/index.php?pk=190522&T=2

Globally Unique Identifier (entire table): ba.freestatistics.org/blog/index.php?pk=190522&T=2

As an alternative you can also use a QR Code:  

The GUIDs for individual cells are displayed in the table below:

Multiple Linear Regression - Ordinary Least Squares
VariableParameterS.D.T-STATH0: parameter = 02-tail p-value1-tail p-value
(Intercept)6502.711314168147286.8571550.89240.379060.18953
`#Logins`829.756999128733188.9409424.39160.0001226.1e-05
`#characters`0.1960740567621630.1736881.12890.2676060.133803
`#revisions`-0.7731637812159851.559134-0.49590.6234670.311734
`#seconds`1.632060357594990.3626914.49999e-054.5e-05
`#Hyperlinks`-22.82445761031071806.832018-0.01260.9900020.495001
`#Blogs`-514.1122332997911752.668316-0.29330.7712240.385612
t493.81343133437213.6891932.31090.0276570.013828


Multiple Linear Regression - Regression Statistics
Multiple R0.913547383021878
R-squared0.834568821026122
Adjusted R-squared0.797213393515892
F-TEST (value)22.3413002246477
F-TEST (DF numerator)7
F-TEST (DF denominator)31
p-value1.88317139659944e-10
Multiple Linear Regression - Residual Statistics
Residual Standard Deviation12748.4738340144
Sum Squared Residuals5038231137.99305

\begin{tabular}{lllllllll}
\hline
Multiple Linear Regression - Regression Statistics \tabularnewline
Multiple R & 0.913547383021878 \tabularnewline
R-squared & 0.834568821026122 \tabularnewline
Adjusted R-squared & 0.797213393515892 \tabularnewline
F-TEST (value) & 22.3413002246477 \tabularnewline
F-TEST (DF numerator) & 7 \tabularnewline
F-TEST (DF denominator) & 31 \tabularnewline
p-value & 1.88317139659944e-10 \tabularnewline
Multiple Linear Regression - Residual Statistics \tabularnewline
Residual Standard Deviation & 12748.4738340144 \tabularnewline
Sum Squared Residuals & 5038231137.99305 \tabularnewline
\hline
\end{tabular}
%Source: https://freestatistics.org/blog/index.php?pk=190522&T=3

[TABLE]
[ROW][C]Multiple Linear Regression - Regression Statistics[/C][/ROW]
[ROW][C]Multiple R[/C][C]0.913547383021878[/C][/ROW]
[ROW][C]R-squared[/C][C]0.834568821026122[/C][/ROW]
[ROW][C]Adjusted R-squared[/C][C]0.797213393515892[/C][/ROW]
[ROW][C]F-TEST (value)[/C][C]22.3413002246477[/C][/ROW]
[ROW][C]F-TEST (DF numerator)[/C][C]7[/C][/ROW]
[ROW][C]F-TEST (DF denominator)[/C][C]31[/C][/ROW]
[ROW][C]p-value[/C][C]1.88317139659944e-10[/C][/ROW]
[ROW][C]Multiple Linear Regression - Residual Statistics[/C][/ROW]
[ROW][C]Residual Standard Deviation[/C][C]12748.4738340144[/C][/ROW]
[ROW][C]Sum Squared Residuals[/C][C]5038231137.99305[/C][/ROW]
[/TABLE]
Source: https://freestatistics.org/blog/index.php?pk=190522&T=3

Globally Unique Identifier (entire table): ba.freestatistics.org/blog/index.php?pk=190522&T=3

As an alternative you can also use a QR Code:  

The GUIDs for individual cells are displayed in the table below:

Multiple Linear Regression - Regression Statistics
Multiple R0.913547383021878
R-squared0.834568821026122
Adjusted R-squared0.797213393515892
F-TEST (value)22.3413002246477
F-TEST (DF numerator)7
F-TEST (DF denominator)31
p-value1.88317139659944e-10
Multiple Linear Regression - Residual Statistics
Residual Standard Deviation12748.4738340144
Sum Squared Residuals5038231137.99305


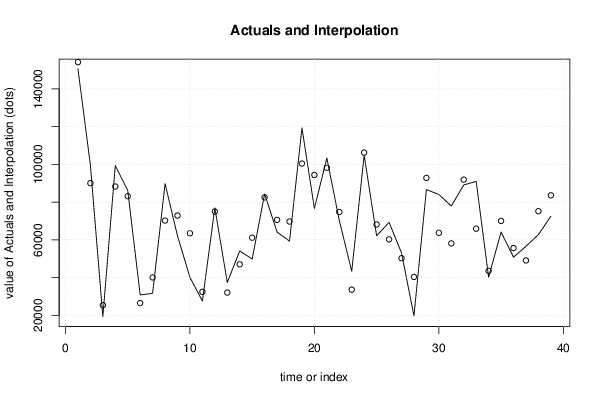
Multiple Linear Regression - Actuals, Interpolation, and Residuals
Time or IndexActualsInterpolationForecastResidualsPrediction Error
1150580154182.021922562-3602.02192256182
29961190051.01706120249559.98293879762
31934925424.674319241-6075.67431924101
49937388300.826278392911072.1737216071
58623083148.43809470493081.56190529507
63083726545.52298781964291.47701218041
73170640146.0623660744-8440.06236607439
88980670274.608900575119531.3910994249
96208872891.5444209086-10803.5444209086
104015163528.954979804-23377.954979804
112763432512.3300439796-4878.33004397958
127699075034.34111093961955.65888906039
133746032105.6331202535354.366879747
145415747075.34751596517081.65248403491
154986261178.8374379972-11316.8374379972
168433782531.8969610131805.10303898697
176417570605.6206757834-6430.62067578343
185938269759.2377121762-10377.2377121762
19119308100466.4085557518841.5914442497
207670294412.9532621454-17710.9532621454
2110342598239.45653005665185.54346994345
227034474789.9735924574-4445.97359245739
234341033652.27260877399757.72739122607
24104838106267.74146462-1429.74146462005
256221568160.6657990575-5945.66579905752
266930460283.42258117759020.57741882246
275311750306.92932182042810.07067817956
281976440378.5219208979-20614.5219208979
298668092858.7372966277-6178.73729662775
308410563754.775055492520350.2249445075
317794558163.660025291719781.3399747083
328911391941.3467529301-2828.34675293006
339100565957.753660727725047.2463392723
344024843627.0319245677-3379.03192456775
356418770053.3227322172-5866.32273221716
365085755654.2569846724-4797.25698467238
375661349119.58657707877493.41342292133
386279275218.0965443823-12426.0965443823
397253583631.1708998631-11096.1708998631

\begin{tabular}{lllllllll}
\hline
Multiple Linear Regression - Actuals, Interpolation, and Residuals \tabularnewline
Time or Index & Actuals & InterpolationForecast & ResidualsPrediction Error \tabularnewline
1 & 150580 & 154182.021922562 & -3602.02192256182 \tabularnewline
2 & 99611 & 90051.0170612024 & 9559.98293879762 \tabularnewline
3 & 19349 & 25424.674319241 & -6075.67431924101 \tabularnewline
4 & 99373 & 88300.8262783929 & 11072.1737216071 \tabularnewline
5 & 86230 & 83148.4380947049 & 3081.56190529507 \tabularnewline
6 & 30837 & 26545.5229878196 & 4291.47701218041 \tabularnewline
7 & 31706 & 40146.0623660744 & -8440.06236607439 \tabularnewline
8 & 89806 & 70274.6089005751 & 19531.3910994249 \tabularnewline
9 & 62088 & 72891.5444209086 & -10803.5444209086 \tabularnewline
10 & 40151 & 63528.954979804 & -23377.954979804 \tabularnewline
11 & 27634 & 32512.3300439796 & -4878.33004397958 \tabularnewline
12 & 76990 & 75034.3411109396 & 1955.65888906039 \tabularnewline
13 & 37460 & 32105.633120253 & 5354.366879747 \tabularnewline
14 & 54157 & 47075.3475159651 & 7081.65248403491 \tabularnewline
15 & 49862 & 61178.8374379972 & -11316.8374379972 \tabularnewline
16 & 84337 & 82531.896961013 & 1805.10303898697 \tabularnewline
17 & 64175 & 70605.6206757834 & -6430.62067578343 \tabularnewline
18 & 59382 & 69759.2377121762 & -10377.2377121762 \tabularnewline
19 & 119308 & 100466.40855575 & 18841.5914442497 \tabularnewline
20 & 76702 & 94412.9532621454 & -17710.9532621454 \tabularnewline
21 & 103425 & 98239.4565300566 & 5185.54346994345 \tabularnewline
22 & 70344 & 74789.9735924574 & -4445.97359245739 \tabularnewline
23 & 43410 & 33652.2726087739 & 9757.72739122607 \tabularnewline
24 & 104838 & 106267.74146462 & -1429.74146462005 \tabularnewline
25 & 62215 & 68160.6657990575 & -5945.66579905752 \tabularnewline
26 & 69304 & 60283.4225811775 & 9020.57741882246 \tabularnewline
27 & 53117 & 50306.9293218204 & 2810.07067817956 \tabularnewline
28 & 19764 & 40378.5219208979 & -20614.5219208979 \tabularnewline
29 & 86680 & 92858.7372966277 & -6178.73729662775 \tabularnewline
30 & 84105 & 63754.7750554925 & 20350.2249445075 \tabularnewline
31 & 77945 & 58163.6600252917 & 19781.3399747083 \tabularnewline
32 & 89113 & 91941.3467529301 & -2828.34675293006 \tabularnewline
33 & 91005 & 65957.7536607277 & 25047.2463392723 \tabularnewline
34 & 40248 & 43627.0319245677 & -3379.03192456775 \tabularnewline
35 & 64187 & 70053.3227322172 & -5866.32273221716 \tabularnewline
36 & 50857 & 55654.2569846724 & -4797.25698467238 \tabularnewline
37 & 56613 & 49119.5865770787 & 7493.41342292133 \tabularnewline
38 & 62792 & 75218.0965443823 & -12426.0965443823 \tabularnewline
39 & 72535 & 83631.1708998631 & -11096.1708998631 \tabularnewline
\hline
\end{tabular}
%Source: https://freestatistics.org/blog/index.php?pk=190522&T=4

[TABLE]
[ROW][C]Multiple Linear Regression - Actuals, Interpolation, and Residuals[/C][/ROW]
[ROW][C]Time or Index[/C][C]Actuals[/C][C]InterpolationForecast[/C][C]ResidualsPrediction Error[/C][/ROW]
[ROW][C]1[/C][C]150580[/C][C]154182.021922562[/C][C]-3602.02192256182[/C][/ROW]
[ROW][C]2[/C][C]99611[/C][C]90051.0170612024[/C][C]9559.98293879762[/C][/ROW]
[ROW][C]3[/C][C]19349[/C][C]25424.674319241[/C][C]-6075.67431924101[/C][/ROW]
[ROW][C]4[/C][C]99373[/C][C]88300.8262783929[/C][C]11072.1737216071[/C][/ROW]
[ROW][C]5[/C][C]86230[/C][C]83148.4380947049[/C][C]3081.56190529507[/C][/ROW]
[ROW][C]6[/C][C]30837[/C][C]26545.5229878196[/C][C]4291.47701218041[/C][/ROW]
[ROW][C]7[/C][C]31706[/C][C]40146.0623660744[/C][C]-8440.06236607439[/C][/ROW]
[ROW][C]8[/C][C]89806[/C][C]70274.6089005751[/C][C]19531.3910994249[/C][/ROW]
[ROW][C]9[/C][C]62088[/C][C]72891.5444209086[/C][C]-10803.5444209086[/C][/ROW]
[ROW][C]10[/C][C]40151[/C][C]63528.954979804[/C][C]-23377.954979804[/C][/ROW]
[ROW][C]11[/C][C]27634[/C][C]32512.3300439796[/C][C]-4878.33004397958[/C][/ROW]
[ROW][C]12[/C][C]76990[/C][C]75034.3411109396[/C][C]1955.65888906039[/C][/ROW]
[ROW][C]13[/C][C]37460[/C][C]32105.633120253[/C][C]5354.366879747[/C][/ROW]
[ROW][C]14[/C][C]54157[/C][C]47075.3475159651[/C][C]7081.65248403491[/C][/ROW]
[ROW][C]15[/C][C]49862[/C][C]61178.8374379972[/C][C]-11316.8374379972[/C][/ROW]
[ROW][C]16[/C][C]84337[/C][C]82531.896961013[/C][C]1805.10303898697[/C][/ROW]
[ROW][C]17[/C][C]64175[/C][C]70605.6206757834[/C][C]-6430.62067578343[/C][/ROW]
[ROW][C]18[/C][C]59382[/C][C]69759.2377121762[/C][C]-10377.2377121762[/C][/ROW]
[ROW][C]19[/C][C]119308[/C][C]100466.40855575[/C][C]18841.5914442497[/C][/ROW]
[ROW][C]20[/C][C]76702[/C][C]94412.9532621454[/C][C]-17710.9532621454[/C][/ROW]
[ROW][C]21[/C][C]103425[/C][C]98239.4565300566[/C][C]5185.54346994345[/C][/ROW]
[ROW][C]22[/C][C]70344[/C][C]74789.9735924574[/C][C]-4445.97359245739[/C][/ROW]
[ROW][C]23[/C][C]43410[/C][C]33652.2726087739[/C][C]9757.72739122607[/C][/ROW]
[ROW][C]24[/C][C]104838[/C][C]106267.74146462[/C][C]-1429.74146462005[/C][/ROW]
[ROW][C]25[/C][C]62215[/C][C]68160.6657990575[/C][C]-5945.66579905752[/C][/ROW]
[ROW][C]26[/C][C]69304[/C][C]60283.4225811775[/C][C]9020.57741882246[/C][/ROW]
[ROW][C]27[/C][C]53117[/C][C]50306.9293218204[/C][C]2810.07067817956[/C][/ROW]
[ROW][C]28[/C][C]19764[/C][C]40378.5219208979[/C][C]-20614.5219208979[/C][/ROW]
[ROW][C]29[/C][C]86680[/C][C]92858.7372966277[/C][C]-6178.73729662775[/C][/ROW]
[ROW][C]30[/C][C]84105[/C][C]63754.7750554925[/C][C]20350.2249445075[/C][/ROW]
[ROW][C]31[/C][C]77945[/C][C]58163.6600252917[/C][C]19781.3399747083[/C][/ROW]
[ROW][C]32[/C][C]89113[/C][C]91941.3467529301[/C][C]-2828.34675293006[/C][/ROW]
[ROW][C]33[/C][C]91005[/C][C]65957.7536607277[/C][C]25047.2463392723[/C][/ROW]
[ROW][C]34[/C][C]40248[/C][C]43627.0319245677[/C][C]-3379.03192456775[/C][/ROW]
[ROW][C]35[/C][C]64187[/C][C]70053.3227322172[/C][C]-5866.32273221716[/C][/ROW]
[ROW][C]36[/C][C]50857[/C][C]55654.2569846724[/C][C]-4797.25698467238[/C][/ROW]
[ROW][C]37[/C][C]56613[/C][C]49119.5865770787[/C][C]7493.41342292133[/C][/ROW]
[ROW][C]38[/C][C]62792[/C][C]75218.0965443823[/C][C]-12426.0965443823[/C][/ROW]
[ROW][C]39[/C][C]72535[/C][C]83631.1708998631[/C][C]-11096.1708998631[/C][/ROW]
[/TABLE]
Source: https://freestatistics.org/blog/index.php?pk=190522&T=4

Globally Unique Identifier (entire table): ba.freestatistics.org/blog/index.php?pk=190522&T=4

As an alternative you can also use a QR Code:  

The GUIDs for individual cells are displayed in the table below:

Multiple Linear Regression - Actuals, Interpolation, and Residuals
Time or IndexActualsInterpolationForecastResidualsPrediction Error
1150580154182.021922562-3602.02192256182
29961190051.01706120249559.98293879762
31934925424.674319241-6075.67431924101
49937388300.826278392911072.1737216071
58623083148.43809470493081.56190529507
63083726545.52298781964291.47701218041
73170640146.0623660744-8440.06236607439
88980670274.608900575119531.3910994249
96208872891.5444209086-10803.5444209086
104015163528.954979804-23377.954979804
112763432512.3300439796-4878.33004397958
127699075034.34111093961955.65888906039
133746032105.6331202535354.366879747
145415747075.34751596517081.65248403491
154986261178.8374379972-11316.8374379972
168433782531.8969610131805.10303898697
176417570605.6206757834-6430.62067578343
185938269759.2377121762-10377.2377121762
19119308100466.4085557518841.5914442497
207670294412.9532621454-17710.9532621454
2110342598239.45653005665185.54346994345
227034474789.9735924574-4445.97359245739
234341033652.27260877399757.72739122607
24104838106267.74146462-1429.74146462005
256221568160.6657990575-5945.66579905752
266930460283.42258117759020.57741882246
275311750306.92932182042810.07067817956
281976440378.5219208979-20614.5219208979
298668092858.7372966277-6178.73729662775
308410563754.775055492520350.2249445075
317794558163.660025291719781.3399747083
328911391941.3467529301-2828.34675293006
339100565957.753660727725047.2463392723
344024843627.0319245677-3379.03192456775
356418770053.3227322172-5866.32273221716
365085755654.2569846724-4797.25698467238
375661349119.58657707877493.41342292133
386279275218.0965443823-12426.0965443823
397253583631.1708998631-11096.1708998631


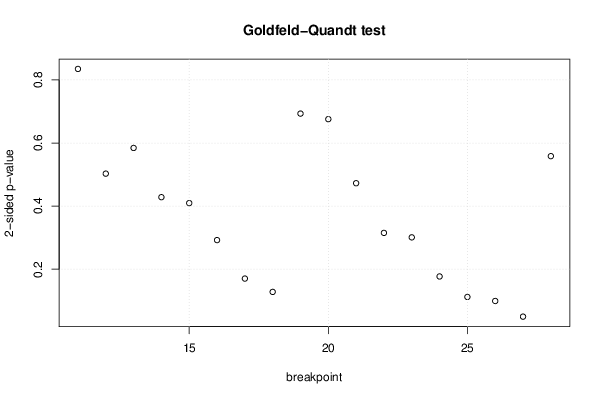
Goldfeld-Quandt test for Heteroskedasticity
p-valuesAlternative Hypothesis
breakpoint indexgreater2-sidedless
110.4173835698271330.8347671396542660.582616430172867
120.2514469217551380.5028938435102770.748553078244862
130.2922097284854770.5844194569709550.707790271514523
140.2141648603811310.4283297207622620.785835139618869
150.2047816553042220.4095633106084450.795218344695778
160.1462013305276190.2924026610552380.853798669472381
170.08522402565279370.1704480513055870.914775974347206
180.06407271536099850.1281454307219970.935927284639002
190.3466335076712190.6932670153424380.653366492328781
200.3378192724636610.6756385449273220.662180727536339
210.2362880719437510.4725761438875010.763711928056249
220.1575549015206050.3151098030412090.842445098479395
230.1505092977306530.3010185954613050.849490702269347
240.08853815096335020.17707630192670.91146184903665
250.05610344308944950.1122068861788990.943896556910551
260.04967674081751910.09935348163503820.950323259182481
270.02485454075386110.04970908150772220.975145459246139
280.2791858656055780.5583717312111570.720814134394422

\begin{tabular}{lllllllll}
\hline
Goldfeld-Quandt test for Heteroskedasticity \tabularnewline
p-values & Alternative Hypothesis \tabularnewline
breakpoint index & greater & 2-sided & less \tabularnewline
11 & 0.417383569827133 & 0.834767139654266 & 0.582616430172867 \tabularnewline
12 & 0.251446921755138 & 0.502893843510277 & 0.748553078244862 \tabularnewline
13 & 0.292209728485477 & 0.584419456970955 & 0.707790271514523 \tabularnewline
14 & 0.214164860381131 & 0.428329720762262 & 0.785835139618869 \tabularnewline
15 & 0.204781655304222 & 0.409563310608445 & 0.795218344695778 \tabularnewline
16 & 0.146201330527619 & 0.292402661055238 & 0.853798669472381 \tabularnewline
17 & 0.0852240256527937 & 0.170448051305587 & 0.914775974347206 \tabularnewline
18 & 0.0640727153609985 & 0.128145430721997 & 0.935927284639002 \tabularnewline
19 & 0.346633507671219 & 0.693267015342438 & 0.653366492328781 \tabularnewline
20 & 0.337819272463661 & 0.675638544927322 & 0.662180727536339 \tabularnewline
21 & 0.236288071943751 & 0.472576143887501 & 0.763711928056249 \tabularnewline
22 & 0.157554901520605 & 0.315109803041209 & 0.842445098479395 \tabularnewline
23 & 0.150509297730653 & 0.301018595461305 & 0.849490702269347 \tabularnewline
24 & 0.0885381509633502 & 0.1770763019267 & 0.91146184903665 \tabularnewline
25 & 0.0561034430894495 & 0.112206886178899 & 0.943896556910551 \tabularnewline
26 & 0.0496767408175191 & 0.0993534816350382 & 0.950323259182481 \tabularnewline
27 & 0.0248545407538611 & 0.0497090815077222 & 0.975145459246139 \tabularnewline
28 & 0.279185865605578 & 0.558371731211157 & 0.720814134394422 \tabularnewline
\hline
\end{tabular}
%Source: https://freestatistics.org/blog/index.php?pk=190522&T=5

[TABLE]
[ROW][C]Goldfeld-Quandt test for Heteroskedasticity[/C][/ROW]
[ROW][C]p-values[/C][C]Alternative Hypothesis[/C][/ROW]
[ROW][C]breakpoint index[/C][C]greater[/C][C]2-sided[/C][C]less[/C][/ROW]
[ROW][C]11[/C][C]0.417383569827133[/C][C]0.834767139654266[/C][C]0.582616430172867[/C][/ROW]
[ROW][C]12[/C][C]0.251446921755138[/C][C]0.502893843510277[/C][C]0.748553078244862[/C][/ROW]
[ROW][C]13[/C][C]0.292209728485477[/C][C]0.584419456970955[/C][C]0.707790271514523[/C][/ROW]
[ROW][C]14[/C][C]0.214164860381131[/C][C]0.428329720762262[/C][C]0.785835139618869[/C][/ROW]
[ROW][C]15[/C][C]0.204781655304222[/C][C]0.409563310608445[/C][C]0.795218344695778[/C][/ROW]
[ROW][C]16[/C][C]0.146201330527619[/C][C]0.292402661055238[/C][C]0.853798669472381[/C][/ROW]
[ROW][C]17[/C][C]0.0852240256527937[/C][C]0.170448051305587[/C][C]0.914775974347206[/C][/ROW]
[ROW][C]18[/C][C]0.0640727153609985[/C][C]0.128145430721997[/C][C]0.935927284639002[/C][/ROW]
[ROW][C]19[/C][C]0.346633507671219[/C][C]0.693267015342438[/C][C]0.653366492328781[/C][/ROW]
[ROW][C]20[/C][C]0.337819272463661[/C][C]0.675638544927322[/C][C]0.662180727536339[/C][/ROW]
[ROW][C]21[/C][C]0.236288071943751[/C][C]0.472576143887501[/C][C]0.763711928056249[/C][/ROW]
[ROW][C]22[/C][C]0.157554901520605[/C][C]0.315109803041209[/C][C]0.842445098479395[/C][/ROW]
[ROW][C]23[/C][C]0.150509297730653[/C][C]0.301018595461305[/C][C]0.849490702269347[/C][/ROW]
[ROW][C]24[/C][C]0.0885381509633502[/C][C]0.1770763019267[/C][C]0.91146184903665[/C][/ROW]
[ROW][C]25[/C][C]0.0561034430894495[/C][C]0.112206886178899[/C][C]0.943896556910551[/C][/ROW]
[ROW][C]26[/C][C]0.0496767408175191[/C][C]0.0993534816350382[/C][C]0.950323259182481[/C][/ROW]
[ROW][C]27[/C][C]0.0248545407538611[/C][C]0.0497090815077222[/C][C]0.975145459246139[/C][/ROW]
[ROW][C]28[/C][C]0.279185865605578[/C][C]0.558371731211157[/C][C]0.720814134394422[/C][/ROW]
[/TABLE]
Source: https://freestatistics.org/blog/index.php?pk=190522&T=5

Globally Unique Identifier (entire table): ba.freestatistics.org/blog/index.php?pk=190522&T=5

As an alternative you can also use a QR Code:  

The GUIDs for individual cells are displayed in the table below:

Goldfeld-Quandt test for Heteroskedasticity
p-valuesAlternative Hypothesis
breakpoint indexgreater2-sidedless
110.4173835698271330.8347671396542660.582616430172867
120.2514469217551380.5028938435102770.748553078244862
130.2922097284854770.5844194569709550.707790271514523
140.2141648603811310.4283297207622620.785835139618869
150.2047816553042220.4095633106084450.795218344695778
160.1462013305276190.2924026610552380.853798669472381
170.08522402565279370.1704480513055870.914775974347206
180.06407271536099850.1281454307219970.935927284639002
190.3466335076712190.6932670153424380.653366492328781
200.3378192724636610.6756385449273220.662180727536339
210.2362880719437510.4725761438875010.763711928056249
220.1575549015206050.3151098030412090.842445098479395
230.1505092977306530.3010185954613050.849490702269347
240.08853815096335020.17707630192670.91146184903665
250.05610344308944950.1122068861788990.943896556910551
260.04967674081751910.09935348163503820.950323259182481
270.02485454075386110.04970908150772220.975145459246139
280.2791858656055780.5583717312111570.720814134394422


Meta Analysis of Goldfeld-Quandt test for Heteroskedasticity
Description# significant tests% significant testsOK/NOK
1% type I error level00OK
5% type I error level10.0555555555555556NOK
10% type I error level20.111111111111111NOK

\begin{tabular}{lllllllll}
\hline
Meta Analysis of Goldfeld-Quandt test for Heteroskedasticity \tabularnewline
Description & # significant tests & % significant tests & OK/NOK \tabularnewline
1% type I error level & 0 & 0 & OK \tabularnewline
5% type I error level & 1 & 0.0555555555555556 & NOK \tabularnewline
10% type I error level & 2 & 0.111111111111111 & NOK \tabularnewline
\hline
\end{tabular}
%Source: https://freestatistics.org/blog/index.php?pk=190522&T=6

[TABLE]
[ROW][C]Meta Analysis of Goldfeld-Quandt test for Heteroskedasticity[/C][/ROW]
[ROW][C]Description[/C][C]# significant tests[/C][C]% significant tests[/C][C]OK/NOK[/C][/ROW]
[ROW][C]1% type I error level[/C][C]0[/C][C]0[/C][C]OK[/C][/ROW]
[ROW][C]5% type I error level[/C][C]1[/C][C]0.0555555555555556[/C][C]NOK[/C][/ROW]
[ROW][C]10% type I error level[/C][C]2[/C][C]0.111111111111111[/C][C]NOK[/C][/ROW]
[/TABLE]
Source: https://freestatistics.org/blog/index.php?pk=190522&T=6

Globally Unique Identifier (entire table): ba.freestatistics.org/blog/index.php?pk=190522&T=6

As an alternative you can also use a QR Code:  

The GUIDs for individual cells are displayed in the table below:

Meta Analysis of Goldfeld-Quandt test for Heteroskedasticity
Description# significant tests% significant testsOK/NOK
1% type I error level00OK
5% type I error level10.0555555555555556NOK
10% type I error level20.111111111111111NOK


Parameters (Session):
par1 = 1 ; par2 = Do not include Seasonal Dummies ; par3 = Linear Trend ;
Parameters (R input):
par1 = 1 ; par2 = Do not include Seasonal Dummies ; par3 = Linear Trend ;
R code (references can be found in the software module):
library(lattice)
library(lmtest)
n25 <- 25 #minimum number of obs. for Goldfeld-Quandt test
par1 <- as.numeric(par1)
x <- t(y)
k <- length(x[1,])
n <- length(x[,1])
x1 <- cbind(x[,par1], x[,1:k!=par1])
mycolnames <- c(colnames(x)[par1], colnames(x)[1:k!=par1])
colnames(x1) <- mycolnames #colnames(x)[par1]
x <- x1
if (par3 == 'First Differences'){
x2 <- array(0, dim=c(n-1,k), dimnames=list(1:(n-1), paste('(1-B)',colnames(x),sep='')))
for (i in 1:n-1) {
for (j in 1:k) {
x2[i,j] <- x[i+1,j] - x[i,j]
}
}
x <- x2
}
if (par2 == 'Include Monthly Dummies'){
x2 <- array(0, dim=c(n,11), dimnames=list(1:n, paste('M', seq(1:11), sep ='')))
for (i in 1:11){
x2[seq(i,n,12),i] <- 1
}
x <- cbind(x, x2)
}
if (par2 == 'Include Quarterly Dummies'){
x2 <- array(0, dim=c(n,3), dimnames=list(1:n, paste('Q', seq(1:3), sep ='')))
for (i in 1:3){
x2[seq(i,n,4),i] <- 1
}
x <- cbind(x, x2)
}
k <- length(x[1,])
if (par3 == 'Linear Trend'){
x <- cbind(x, c(1:n))
colnames(x)[k+1] <- 't'
}
x
k <- length(x[1,])
df <- as.data.frame(x)
(mylm <- lm(df))
(mysum <- summary(mylm))
if (n > n25) {
kp3 <- k + 3
nmkm3 <- n - k - 3
gqarr <- array(NA, dim=c(nmkm3-kp3+1,3))
numgqtests <- 0
numsignificant1 <- 0
numsignificant5 <- 0
numsignificant10 <- 0
for (mypoint in kp3:nmkm3) {
j <- 0
numgqtests <- numgqtests + 1
for (myalt in c('greater', 'two.sided', 'less')) {
j <- j + 1
gqarr[mypoint-kp3+1,j] <- gqtest(mylm, point=mypoint, alternative=myalt)$p.value
}
if (gqarr[mypoint-kp3+1,2] < 0.01) numsignificant1 <- numsignificant1 + 1
if (gqarr[mypoint-kp3+1,2] < 0.05) numsignificant5 <- numsignificant5 + 1
if (gqarr[mypoint-kp3+1,2] < 0.10) numsignificant10 <- numsignificant10 + 1
}
gqarr
}
bitmap(file='test0.png')
plot(x[,1], type='l', main='Actuals and Interpolation', ylab='value of Actuals and Interpolation (dots)', xlab='time or index')
points(x[,1]-mysum$resid)
grid()
dev.off()
bitmap(file='test1.png')
plot(mysum$resid, type='b', pch=19, main='Residuals', ylab='value of Residuals', xlab='time or index')
grid()
dev.off()
bitmap(file='test2.png')
hist(mysum$resid, main='Residual Histogram', xlab='values of Residuals')
grid()
dev.off()
bitmap(file='test3.png')
densityplot(~mysum$resid,col='black',main='Residual Density Plot', xlab='values of Residuals')
dev.off()
bitmap(file='test4.png')
qqnorm(mysum$resid, main='Residual Normal Q-Q Plot')
qqline(mysum$resid)
grid()
dev.off()
(myerror <- as.ts(mysum$resid))
bitmap(file='test5.png')
dum <- cbind(lag(myerror,k=1),myerror)
dum
dum1 <- dum[2:length(myerror),]
dum1
z <- as.data.frame(dum1)
z
plot(z,main=paste('Residual Lag plot, lowess, and regression line'), ylab='values of Residuals', xlab='lagged values of Residuals')
lines(lowess(z))
abline(lm(z))
grid()
dev.off()
bitmap(file='test6.png')
acf(mysum$resid, lag.max=length(mysum$resid)/2, main='Residual Autocorrelation Function')
grid()
dev.off()
bitmap(file='test7.png')
pacf(mysum$resid, lag.max=length(mysum$resid)/2, main='Residual Partial Autocorrelation Function')
grid()
dev.off()
bitmap(file='test8.png')
opar <- par(mfrow = c(2,2), oma = c(0, 0, 1.1, 0))
plot(mylm, las = 1, sub='Residual Diagnostics')
par(opar)
dev.off()
if (n > n25) {
bitmap(file='test9.png')
plot(kp3:nmkm3,gqarr[,2], main='Goldfeld-Quandt test',ylab='2-sided p-value',xlab='breakpoint')
grid()
dev.off()
}
load(file='createtable')
a<-table.start()
a<-table.row.start(a)
a<-table.element(a, 'Multiple Linear Regression - Estimated Regression Equation', 1, TRUE)
a<-table.row.end(a)
myeq <- colnames(x)[1]
myeq <- paste(myeq, '[t] = ', sep='')
for (i in 1:k){
if (mysum$coefficients[i,1] > 0) myeq <- paste(myeq, '+', '')
myeq <- paste(myeq, mysum$coefficients[i,1], sep=' ')
if (rownames(mysum$coefficients)[i] != '(Intercept)') {
myeq <- paste(myeq, rownames(mysum$coefficients)[i], sep='')
if (rownames(mysum$coefficients)[i] != 't') myeq <- paste(myeq, '[t]', sep='')
}
}
myeq <- paste(myeq, ' + e[t]')
a<-table.row.start(a)
a<-table.element(a, myeq)
a<-table.row.end(a)
a<-table.end(a)
table.save(a,file='mytable1.tab')
a<-table.start()
a<-table.row.start(a)
a<-table.element(a,hyperlink('ols1.htm','Multiple Linear Regression - Ordinary Least Squares',''), 6, TRUE)
a<-table.row.end(a)
a<-table.row.start(a)
a<-table.element(a,'Variable',header=TRUE)
a<-table.element(a,'Parameter',header=TRUE)
a<-table.element(a,'S.D.',header=TRUE)
a<-table.element(a,'T-STAT
H0: parameter = 0',header=TRUE)
a<-table.element(a,'2-tail p-value',header=TRUE)
a<-table.element(a,'1-tail p-value',header=TRUE)
a<-table.row.end(a)
for (i in 1:k){
a<-table.row.start(a)
a<-table.element(a,rownames(mysum$coefficients)[i],header=TRUE)
a<-table.element(a,mysum$coefficients[i,1])
a<-table.element(a, round(mysum$coefficients[i,2],6))
a<-table.element(a, round(mysum$coefficients[i,3],4))
a<-table.element(a, round(mysum$coefficients[i,4],6))
a<-table.element(a, round(mysum$coefficients[i,4]/2,6))
a<-table.row.end(a)
}
a<-table.end(a)
table.save(a,file='mytable2.tab')
a<-table.start()
a<-table.row.start(a)
a<-table.element(a, 'Multiple Linear Regression - Regression Statistics', 2, TRUE)
a<-table.row.end(a)
a<-table.row.start(a)
a<-table.element(a, 'Multiple R',1,TRUE)
a<-table.element(a, sqrt(mysum$r.squared))
a<-table.row.end(a)
a<-table.row.start(a)
a<-table.element(a, 'R-squared',1,TRUE)
a<-table.element(a, mysum$r.squared)
a<-table.row.end(a)
a<-table.row.start(a)
a<-table.element(a, 'Adjusted R-squared',1,TRUE)
a<-table.element(a, mysum$adj.r.squared)
a<-table.row.end(a)
a<-table.row.start(a)
a<-table.element(a, 'F-TEST (value)',1,TRUE)
a<-table.element(a, mysum$fstatistic[1])
a<-table.row.end(a)
a<-table.row.start(a)
a<-table.element(a, 'F-TEST (DF numerator)',1,TRUE)
a<-table.element(a, mysum$fstatistic[2])
a<-table.row.end(a)
a<-table.row.start(a)
a<-table.element(a, 'F-TEST (DF denominator)',1,TRUE)
a<-table.element(a, mysum$fstatistic[3])
a<-table.row.end(a)
a<-table.row.start(a)
a<-table.element(a, 'p-value',1,TRUE)
a<-table.element(a, 1-pf(mysum$fstatistic[1],mysum$fstatistic[2],mysum$fstatistic[3]))
a<-table.row.end(a)
a<-table.row.start(a)
a<-table.element(a, 'Multiple Linear Regression - Residual Statistics', 2, TRUE)
a<-table.row.end(a)
a<-table.row.start(a)
a<-table.element(a, 'Residual Standard Deviation',1,TRUE)
a<-table.element(a, mysum$sigma)
a<-table.row.end(a)
a<-table.row.start(a)
a<-table.element(a, 'Sum Squared Residuals',1,TRUE)
a<-table.element(a, sum(myerror*myerror))
a<-table.row.end(a)
a<-table.end(a)
table.save(a,file='mytable3.tab')
a<-table.start()
a<-table.row.start(a)
a<-table.element(a, 'Multiple Linear Regression - Actuals, Interpolation, and Residuals', 4, TRUE)
a<-table.row.end(a)
a<-table.row.start(a)
a<-table.element(a, 'Time or Index', 1, TRUE)
a<-table.element(a, 'Actuals', 1, TRUE)
a<-table.element(a, 'Interpolation
Forecast', 1, TRUE)
a<-table.element(a, 'Residuals
Prediction Error', 1, TRUE)
a<-table.row.end(a)
for (i in 1:n) {
a<-table.row.start(a)
a<-table.element(a,i, 1, TRUE)
a<-table.element(a,x[i])
a<-table.element(a,x[i]-mysum$resid[i])
a<-table.element(a,mysum$resid[i])
a<-table.row.end(a)
}
a<-table.end(a)
table.save(a,file='mytable4.tab')
if (n > n25) {
a<-table.start()
a<-table.row.start(a)
a<-table.element(a,'Goldfeld-Quandt test for Heteroskedasticity',4,TRUE)
a<-table.row.end(a)
a<-table.row.start(a)
a<-table.element(a,'p-values',header=TRUE)
a<-table.element(a,'Alternative Hypothesis',3,header=TRUE)
a<-table.row.end(a)
a<-table.row.start(a)
a<-table.element(a,'breakpoint index',header=TRUE)
a<-table.element(a,'greater',header=TRUE)
a<-table.element(a,'2-sided',header=TRUE)
a<-table.element(a,'less',header=TRUE)
a<-table.row.end(a)
for (mypoint in kp3:nmkm3) {
a<-table.row.start(a)
a<-table.element(a,mypoint,header=TRUE)
a<-table.element(a,gqarr[mypoint-kp3+1,1])
a<-table.element(a,gqarr[mypoint-kp3+1,2])
a<-table.element(a,gqarr[mypoint-kp3+1,3])
a<-table.row.end(a)
}
a<-table.end(a)
table.save(a,file='mytable5.tab')
a<-table.start()
a<-table.row.start(a)
a<-table.element(a,'Meta Analysis of Goldfeld-Quandt test for Heteroskedasticity',4,TRUE)
a<-table.row.end(a)
a<-table.row.start(a)
a<-table.element(a,'Description',header=TRUE)
a<-table.element(a,'# significant tests',header=TRUE)
a<-table.element(a,'% significant tests',header=TRUE)
a<-table.element(a,'OK/NOK',header=TRUE)
a<-table.row.end(a)
a<-table.row.start(a)
a<-table.element(a,'1% type I error level',header=TRUE)
a<-table.element(a,numsignificant1)
a<-table.element(a,numsignificant1/numgqtests)
if (numsignificant1/numgqtests < 0.01) dum <- 'OK' else dum <- 'NOK'
a<-table.element(a,dum)
a<-table.row.end(a)
a<-table.row.start(a)
a<-table.element(a,'5% type I error level',header=TRUE)
a<-table.element(a,numsignificant5)
a<-table.element(a,numsignificant5/numgqtests)
if (numsignificant5/numgqtests < 0.05) dum <- 'OK' else dum <- 'NOK'
a<-table.element(a,dum)
a<-table.row.end(a)
a<-table.row.start(a)
a<-table.element(a,'10% type I error level',header=TRUE)
a<-table.element(a,numsignificant10)
a<-table.element(a,numsignificant10/numgqtests)
if (numsignificant10/numgqtests < 0.1) dum <- 'OK' else dum <- 'NOK'
a<-table.element(a,dum)
a<-table.row.end(a)
a<-table.end(a)
table.save(a,file='mytable6.tab')
}