Free Statistics

of Irreproducible Research!

Author's title

Author*The author of this computation has been verified*
R Software Modulerwasp_multipleregression.wasp
Title produced by softwareMultiple Regression
Date of computationMon, 19 Nov 2012 09:10:28 -0500
Cite this page as followsStatistical Computations at FreeStatistics.org, Office for Research Development and Education, URL https://freestatistics.org/blog/index.php?v=date/2012/Nov/19/t13533342411csagsymkuu7ill.htm/, Retrieved Sun, 28 Apr 2024 12:46:23 +0000
Statistical Computations at FreeStatistics.org, Office for Research Development and Education, URL https://freestatistics.org/blog/index.php?pk=190525, Retrieved Sun, 28 Apr 2024 12:46:23 +0000
QR Codes:

Original text written by user:
IsPrivate?No (this computation is public)
User-defined keywords
Estimated Impact100
Family? (F = Feedback message, R = changed R code, M = changed R Module, P = changed Parameters, D = changed Data)
-     [Multiple Regression] [Competence to learn] [2010-11-17 07:43:53] [b98453cac15ba1066b407e146608df68]
- R  D  [Multiple Regression] [WS 7 1] [2011-11-21 12:02:50] [0c0832a80cf4628193d5c1e6a08841d7]
-   PD    [Multiple Regression] [Mini-Tutorial] [2012-11-19 14:07:39] [3ba5358ad212dca7c498c7fc6d6ebde5]
-   P         [Multiple Regression] [Mini-Tutorial] [2012-11-19 14:10:28] [90f4fc95bc23bd40c615363dd079f863] [Current]
Feedback Forum

Post a new message
Dataseries X:
150580	77	45588	9653	62991	41	39
99611	35	45097	8914	49363	54	54
19349	11	3895	786	9604	14	14
99373	63	28394	6700	24552	25	24
86230	44	18632	5788	31493	25	24
30837	19	2325	593	3439	8	8
31706	13	25139	4506	19555	26	26
89806	42	27975	6382	21228	20	19
62088	38	14483	5621	23177	11	11
40151	29	13127	3997	22094	14	14
27634	20	5839	520	2342	3	1
76990	27	24069	8891	38798	40	39
37460	20	3738	999	3255	5	5
54157	19	18625	7067	24261	38	37
49862	37	36341	4639	18511	32	32
84337	26	24548	5654	40798	41	38
64175	42	21792	6928	28893	46	47
59382	49	26263	1514	21425	47	47
119308	30	23686	9238	50276	37	37
76702	49	49303	8204	37643	51	51
103425	67	25659	5926	30377	49	45
70344	28	28904	5785	27126	21	21
43410	19	2781	4	13	1	1
104838	49	29236	5930	42097	44	42
62215	27	19546	3710	24451	26	26
69304	30	22818	705	14335	21	21
53117	22	32689	443	5084	4	4
19764	12	5752	2416	9927	10	10
86680	31	22197	7747	43527	43	43
84105	20	20055	5432	27184	34	34
77945	20	25272	4913	21610	32	31
89113	39	82206	2650	20484	20	19
91005	29	32073	2370	20156	34	34
40248	16	5444	775	6012	6	6
64187	27	20154	5576	18475	12	11
50857	21	36944	1352	12645	24	24
56613	19	8019	3080	11017	16	16
62792	35	30884	10205	37623	72	72
72535	14	19540	6095	35873	27	21


Summary of computational transaction
Raw Inputview raw input (R code)
Raw Outputview raw output of R engine
Computing time9 seconds
R Server'Herman Ole Andreas Wold' @ wold.wessa.net

\begin{tabular}{lllllllll}
\hline
Summary of computational transaction \tabularnewline
Raw Input & view raw input (R code)  \tabularnewline
Raw Output & view raw output of R engine  \tabularnewline
Computing time & 9 seconds \tabularnewline
R Server & 'Herman Ole Andreas Wold' @ wold.wessa.net \tabularnewline
\hline
\end{tabular}
%Source: https://freestatistics.org/blog/index.php?pk=190525&T=0

[TABLE]
[ROW][C]Summary of computational transaction[/C][/ROW]
[ROW][C]Raw Input[/C][C]view raw input (R code) [/C][/ROW]
[ROW][C]Raw Output[/C][C]view raw output of R engine [/C][/ROW]
[ROW][C]Computing time[/C][C]9 seconds[/C][/ROW]
[ROW][C]R Server[/C][C]'Herman Ole Andreas Wold' @ wold.wessa.net[/C][/ROW]
[/TABLE]
Source: https://freestatistics.org/blog/index.php?pk=190525&T=0

Globally Unique Identifier (entire table): ba.freestatistics.org/blog/index.php?pk=190525&T=0

As an alternative you can also use a QR Code:  

The GUIDs for individual cells are displayed in the table below:

Summary of computational transaction
Raw Inputview raw input (R code)
Raw Outputview raw output of R engine
Computing time9 seconds
R Server'Herman Ole Andreas Wold' @ wold.wessa.net


Multiple Linear Regression - Estimated Regression Equation
TimeRFC[t] = + 18668.3206607017 + 649.982998349128`#Logins`[t] + 0.308510559348594`#characters`[t] -0.985316356526397`#revisions`[t] + 1.50553568456771`#seconds`[t] + 1041.59586653222`#Hyperlinks`[t] -1430.90950241908`#Blogs`[t] + e[t]

\begin{tabular}{lllllllll}
\hline
Multiple Linear Regression - Estimated Regression Equation \tabularnewline
TimeRFC[t] =  +  18668.3206607017 +  649.982998349128`#Logins`[t] +  0.308510559348594`#characters`[t] -0.985316356526397`#revisions`[t] +  1.50553568456771`#seconds`[t] +  1041.59586653222`#Hyperlinks`[t] -1430.90950241908`#Blogs`[t]  + e[t] \tabularnewline
\hline
\end{tabular}
%Source: https://freestatistics.org/blog/index.php?pk=190525&T=1

[TABLE]
[ROW][C]Multiple Linear Regression - Estimated Regression Equation[/C][/ROW]
[ROW][C]TimeRFC[t] =  +  18668.3206607017 +  649.982998349128`#Logins`[t] +  0.308510559348594`#characters`[t] -0.985316356526397`#revisions`[t] +  1.50553568456771`#seconds`[t] +  1041.59586653222`#Hyperlinks`[t] -1430.90950241908`#Blogs`[t]  + e[t][/C][/ROW]
[/TABLE]
Source: https://freestatistics.org/blog/index.php?pk=190525&T=1

Globally Unique Identifier (entire table): ba.freestatistics.org/blog/index.php?pk=190525&T=1

As an alternative you can also use a QR Code:  

The GUIDs for individual cells are displayed in the table below:

Multiple Linear Regression - Estimated Regression Equation
TimeRFC[t] = + 18668.3206607017 + 649.982998349128`#Logins`[t] + 0.308510559348594`#characters`[t] -0.985316356526397`#revisions`[t] + 1.50553568456771`#seconds`[t] + 1041.59586653222`#Hyperlinks`[t] -1430.90950241908`#Blogs`[t] + e[t]


Multiple Linear Regression - Ordinary Least Squares
VariableParameterS.D.T-STATH0: parameter = 02-tail p-value1-tail p-value
(Intercept)18668.32066070175369.0457663.4770.0014820.000741
`#Logins`649.982998349128183.487943.54240.0012420.000621
`#characters`0.3085105593485940.1776821.73630.0921290.046065
`#revisions`-0.9853163565263971.658625-0.59410.5566510.278326
`#seconds`1.505535684567710.3820763.94040.0004140.000207
`#Hyperlinks`1041.595866532221861.8529490.55940.5797560.289878
`#Blogs`-1430.909502419081819.271139-0.78650.4373440.218672

\begin{tabular}{lllllllll}
\hline
Multiple Linear Regression - Ordinary Least Squares \tabularnewline
Variable & Parameter & S.D. & T-STATH0: parameter = 0 & 2-tail p-value & 1-tail p-value \tabularnewline
(Intercept) & 18668.3206607017 & 5369.045766 & 3.477 & 0.001482 & 0.000741 \tabularnewline
`#Logins` & 649.982998349128 & 183.48794 & 3.5424 & 0.001242 & 0.000621 \tabularnewline
`#characters` & 0.308510559348594 & 0.177682 & 1.7363 & 0.092129 & 0.046065 \tabularnewline
`#revisions` & -0.985316356526397 & 1.658625 & -0.5941 & 0.556651 & 0.278326 \tabularnewline
`#seconds` & 1.50553568456771 & 0.382076 & 3.9404 & 0.000414 & 0.000207 \tabularnewline
`#Hyperlinks` & 1041.59586653222 & 1861.852949 & 0.5594 & 0.579756 & 0.289878 \tabularnewline
`#Blogs` & -1430.90950241908 & 1819.271139 & -0.7865 & 0.437344 & 0.218672 \tabularnewline
\hline
\end{tabular}
%Source: https://freestatistics.org/blog/index.php?pk=190525&T=2

[TABLE]
[ROW][C]Multiple Linear Regression - Ordinary Least Squares[/C][/ROW]
[ROW][C]Variable[/C][C]Parameter[/C][C]S.D.[/C][C]T-STATH0: parameter = 0[/C][C]2-tail p-value[/C][C]1-tail p-value[/C][/ROW]
[ROW][C](Intercept)[/C][C]18668.3206607017[/C][C]5369.045766[/C][C]3.477[/C][C]0.001482[/C][C]0.000741[/C][/ROW]
[ROW][C]`#Logins`[/C][C]649.982998349128[/C][C]183.48794[/C][C]3.5424[/C][C]0.001242[/C][C]0.000621[/C][/ROW]
[ROW][C]`#characters`[/C][C]0.308510559348594[/C][C]0.177682[/C][C]1.7363[/C][C]0.092129[/C][C]0.046065[/C][/ROW]
[ROW][C]`#revisions`[/C][C]-0.985316356526397[/C][C]1.658625[/C][C]-0.5941[/C][C]0.556651[/C][C]0.278326[/C][/ROW]
[ROW][C]`#seconds`[/C][C]1.50553568456771[/C][C]0.382076[/C][C]3.9404[/C][C]0.000414[/C][C]0.000207[/C][/ROW]
[ROW][C]`#Hyperlinks`[/C][C]1041.59586653222[/C][C]1861.852949[/C][C]0.5594[/C][C]0.579756[/C][C]0.289878[/C][/ROW]
[ROW][C]`#Blogs`[/C][C]-1430.90950241908[/C][C]1819.271139[/C][C]-0.7865[/C][C]0.437344[/C][C]0.218672[/C][/ROW]
[/TABLE]
Source: https://freestatistics.org/blog/index.php?pk=190525&T=2

Globally Unique Identifier (entire table): ba.freestatistics.org/blog/index.php?pk=190525&T=2

As an alternative you can also use a QR Code:  

The GUIDs for individual cells are displayed in the table below:

Multiple Linear Regression - Ordinary Least Squares
VariableParameterS.D.T-STATH0: parameter = 02-tail p-value1-tail p-value
(Intercept)18668.32066070175369.0457663.4770.0014820.000741
`#Logins`649.982998349128183.487943.54240.0012420.000621
`#characters`0.3085105593485940.1776821.73630.0921290.046065
`#revisions`-0.9853163565263971.658625-0.59410.5566510.278326
`#seconds`1.505535684567710.3820763.94040.0004140.000207
`#Hyperlinks`1041.595866532221861.8529490.55940.5797560.289878
`#Blogs`-1430.909502419081819.271139-0.78650.4373440.218672


Multiple Linear Regression - Regression Statistics
Multiple R0.89781439719386
R-squared0.806070691808575
Adjusted R-squared0.769708946522682
F-TEST (value)22.1680968685878
F-TEST (DF numerator)6
F-TEST (DF denominator)32
p-value4.0927405908775e-10
Multiple Linear Regression - Residual Statistics
Residual Standard Deviation13585.5459703615
Sum Squared Residuals5906145898.00978

\begin{tabular}{lllllllll}
\hline
Multiple Linear Regression - Regression Statistics \tabularnewline
Multiple R & 0.89781439719386 \tabularnewline
R-squared & 0.806070691808575 \tabularnewline
Adjusted R-squared & 0.769708946522682 \tabularnewline
F-TEST (value) & 22.1680968685878 \tabularnewline
F-TEST (DF numerator) & 6 \tabularnewline
F-TEST (DF denominator) & 32 \tabularnewline
p-value & 4.0927405908775e-10 \tabularnewline
Multiple Linear Regression - Residual Statistics \tabularnewline
Residual Standard Deviation & 13585.5459703615 \tabularnewline
Sum Squared Residuals & 5906145898.00978 \tabularnewline
\hline
\end{tabular}
%Source: https://freestatistics.org/blog/index.php?pk=190525&T=3

[TABLE]
[ROW][C]Multiple Linear Regression - Regression Statistics[/C][/ROW]
[ROW][C]Multiple R[/C][C]0.89781439719386[/C][/ROW]
[ROW][C]R-squared[/C][C]0.806070691808575[/C][/ROW]
[ROW][C]Adjusted R-squared[/C][C]0.769708946522682[/C][/ROW]
[ROW][C]F-TEST (value)[/C][C]22.1680968685878[/C][/ROW]
[ROW][C]F-TEST (DF numerator)[/C][C]6[/C][/ROW]
[ROW][C]F-TEST (DF denominator)[/C][C]32[/C][/ROW]
[ROW][C]p-value[/C][C]4.0927405908775e-10[/C][/ROW]
[ROW][C]Multiple Linear Regression - Residual Statistics[/C][/ROW]
[ROW][C]Residual Standard Deviation[/C][C]13585.5459703615[/C][/ROW]
[ROW][C]Sum Squared Residuals[/C][C]5906145898.00978[/C][/ROW]
[/TABLE]
Source: https://freestatistics.org/blog/index.php?pk=190525&T=3

Globally Unique Identifier (entire table): ba.freestatistics.org/blog/index.php?pk=190525&T=3

As an alternative you can also use a QR Code:  

The GUIDs for individual cells are displayed in the table below:

Multiple Linear Regression - Regression Statistics
Multiple R0.89781439719386
R-squared0.806070691808575
Adjusted R-squared0.769708946522682
F-TEST (value)22.1680968685878
F-TEST (DF numerator)6
F-TEST (DF denominator)32
p-value4.0927405908775e-10
Multiple Linear Regression - Residual Statistics
Residual Standard Deviation13585.5459703615
Sum Squared Residuals5906145898.00978


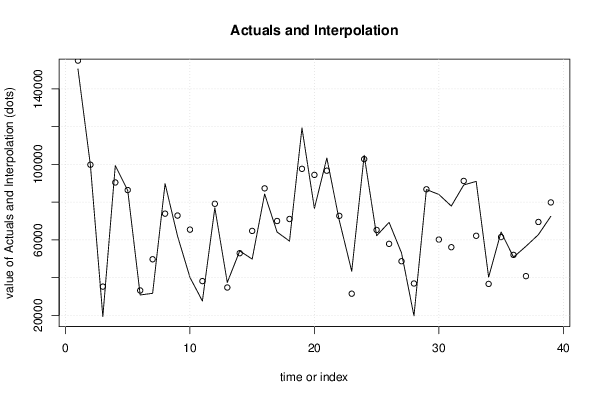
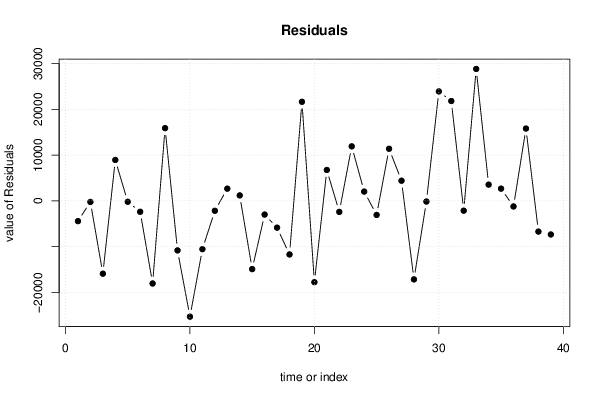
Multiple Linear Regression - Actuals, Interpolation, and Residuals
Time or IndexActualsInterpolationForecastResidualsPrediction Error
1150580155005.2903637-4425.29036370035
29961199842.3379552135-231.337955213549
31934935254.0974271473-15905.0974271473
49937390437.45952286778935.54047713226
58623086424.6341776099-194.634177609898
63083733214.0202125339-2377.02021253387
73170649752.5068668598-18046.5068668598
88980673914.048798475615891.9512015244
96208872908.7203554497-10820.7203554497
104015165442.2507607823-25291.2507607823
112763438176.8519487621-10542.8519487621
127699079153.0921000158-2163.09210001575
133746034790.8125321932669.18746780701
145415752963.5686876461193.43131235398
154986264769.3259676339-14907.3259676339
168433787323.9314437573-2986.93144375727
176417570024.5027636747-5849.50276367467
185938271086.4925913806-11704.4925913806
1911930897660.546767827721647.4532321723
207670294462.3326423823-17760.3326423823
2110342596675.19660497666749.80339502336
227034472748.5533253434-2404.55332534338
234341031502.2825574711907.71744253
24104838102804.7310377862033.2689622141
256221565282.1838167494-3067.18381674941
266930457919.024207694611384.9757923054
275311748713.24202978234403.75797021772
281976436914.4614427316-17150.4614427316
298668086823.5220804189-143.522080418909
308410560192.739875904123912.2601240959
317794556131.299521475321813.7004785247
328911391252.0180407-2139.01804070001
339100562186.400655839628818.5993441604
344024836699.35866337343548.6413366266
356418761515.37706941372671.62293058632
365085752077.4014866581-1220.40148665805
375661340814.637889342815798.3621106572
386279269502.7995761279-6710.79957612786
397253579872.9462322992-7337.94623229924

\begin{tabular}{lllllllll}
\hline
Multiple Linear Regression - Actuals, Interpolation, and Residuals \tabularnewline
Time or Index & Actuals & InterpolationForecast & ResidualsPrediction Error \tabularnewline
1 & 150580 & 155005.2903637 & -4425.29036370035 \tabularnewline
2 & 99611 & 99842.3379552135 & -231.337955213549 \tabularnewline
3 & 19349 & 35254.0974271473 & -15905.0974271473 \tabularnewline
4 & 99373 & 90437.4595228677 & 8935.54047713226 \tabularnewline
5 & 86230 & 86424.6341776099 & -194.634177609898 \tabularnewline
6 & 30837 & 33214.0202125339 & -2377.02021253387 \tabularnewline
7 & 31706 & 49752.5068668598 & -18046.5068668598 \tabularnewline
8 & 89806 & 73914.0487984756 & 15891.9512015244 \tabularnewline
9 & 62088 & 72908.7203554497 & -10820.7203554497 \tabularnewline
10 & 40151 & 65442.2507607823 & -25291.2507607823 \tabularnewline
11 & 27634 & 38176.8519487621 & -10542.8519487621 \tabularnewline
12 & 76990 & 79153.0921000158 & -2163.09210001575 \tabularnewline
13 & 37460 & 34790.812532193 & 2669.18746780701 \tabularnewline
14 & 54157 & 52963.568687646 & 1193.43131235398 \tabularnewline
15 & 49862 & 64769.3259676339 & -14907.3259676339 \tabularnewline
16 & 84337 & 87323.9314437573 & -2986.93144375727 \tabularnewline
17 & 64175 & 70024.5027636747 & -5849.50276367467 \tabularnewline
18 & 59382 & 71086.4925913806 & -11704.4925913806 \tabularnewline
19 & 119308 & 97660.5467678277 & 21647.4532321723 \tabularnewline
20 & 76702 & 94462.3326423823 & -17760.3326423823 \tabularnewline
21 & 103425 & 96675.1966049766 & 6749.80339502336 \tabularnewline
22 & 70344 & 72748.5533253434 & -2404.55332534338 \tabularnewline
23 & 43410 & 31502.28255747 & 11907.71744253 \tabularnewline
24 & 104838 & 102804.731037786 & 2033.2689622141 \tabularnewline
25 & 62215 & 65282.1838167494 & -3067.18381674941 \tabularnewline
26 & 69304 & 57919.0242076946 & 11384.9757923054 \tabularnewline
27 & 53117 & 48713.2420297823 & 4403.75797021772 \tabularnewline
28 & 19764 & 36914.4614427316 & -17150.4614427316 \tabularnewline
29 & 86680 & 86823.5220804189 & -143.522080418909 \tabularnewline
30 & 84105 & 60192.7398759041 & 23912.2601240959 \tabularnewline
31 & 77945 & 56131.2995214753 & 21813.7004785247 \tabularnewline
32 & 89113 & 91252.0180407 & -2139.01804070001 \tabularnewline
33 & 91005 & 62186.4006558396 & 28818.5993441604 \tabularnewline
34 & 40248 & 36699.3586633734 & 3548.6413366266 \tabularnewline
35 & 64187 & 61515.3770694137 & 2671.62293058632 \tabularnewline
36 & 50857 & 52077.4014866581 & -1220.40148665805 \tabularnewline
37 & 56613 & 40814.6378893428 & 15798.3621106572 \tabularnewline
38 & 62792 & 69502.7995761279 & -6710.79957612786 \tabularnewline
39 & 72535 & 79872.9462322992 & -7337.94623229924 \tabularnewline
\hline
\end{tabular}
%Source: https://freestatistics.org/blog/index.php?pk=190525&T=4

[TABLE]
[ROW][C]Multiple Linear Regression - Actuals, Interpolation, and Residuals[/C][/ROW]
[ROW][C]Time or Index[/C][C]Actuals[/C][C]InterpolationForecast[/C][C]ResidualsPrediction Error[/C][/ROW]
[ROW][C]1[/C][C]150580[/C][C]155005.2903637[/C][C]-4425.29036370035[/C][/ROW]
[ROW][C]2[/C][C]99611[/C][C]99842.3379552135[/C][C]-231.337955213549[/C][/ROW]
[ROW][C]3[/C][C]19349[/C][C]35254.0974271473[/C][C]-15905.0974271473[/C][/ROW]
[ROW][C]4[/C][C]99373[/C][C]90437.4595228677[/C][C]8935.54047713226[/C][/ROW]
[ROW][C]5[/C][C]86230[/C][C]86424.6341776099[/C][C]-194.634177609898[/C][/ROW]
[ROW][C]6[/C][C]30837[/C][C]33214.0202125339[/C][C]-2377.02021253387[/C][/ROW]
[ROW][C]7[/C][C]31706[/C][C]49752.5068668598[/C][C]-18046.5068668598[/C][/ROW]
[ROW][C]8[/C][C]89806[/C][C]73914.0487984756[/C][C]15891.9512015244[/C][/ROW]
[ROW][C]9[/C][C]62088[/C][C]72908.7203554497[/C][C]-10820.7203554497[/C][/ROW]
[ROW][C]10[/C][C]40151[/C][C]65442.2507607823[/C][C]-25291.2507607823[/C][/ROW]
[ROW][C]11[/C][C]27634[/C][C]38176.8519487621[/C][C]-10542.8519487621[/C][/ROW]
[ROW][C]12[/C][C]76990[/C][C]79153.0921000158[/C][C]-2163.09210001575[/C][/ROW]
[ROW][C]13[/C][C]37460[/C][C]34790.812532193[/C][C]2669.18746780701[/C][/ROW]
[ROW][C]14[/C][C]54157[/C][C]52963.568687646[/C][C]1193.43131235398[/C][/ROW]
[ROW][C]15[/C][C]49862[/C][C]64769.3259676339[/C][C]-14907.3259676339[/C][/ROW]
[ROW][C]16[/C][C]84337[/C][C]87323.9314437573[/C][C]-2986.93144375727[/C][/ROW]
[ROW][C]17[/C][C]64175[/C][C]70024.5027636747[/C][C]-5849.50276367467[/C][/ROW]
[ROW][C]18[/C][C]59382[/C][C]71086.4925913806[/C][C]-11704.4925913806[/C][/ROW]
[ROW][C]19[/C][C]119308[/C][C]97660.5467678277[/C][C]21647.4532321723[/C][/ROW]
[ROW][C]20[/C][C]76702[/C][C]94462.3326423823[/C][C]-17760.3326423823[/C][/ROW]
[ROW][C]21[/C][C]103425[/C][C]96675.1966049766[/C][C]6749.80339502336[/C][/ROW]
[ROW][C]22[/C][C]70344[/C][C]72748.5533253434[/C][C]-2404.55332534338[/C][/ROW]
[ROW][C]23[/C][C]43410[/C][C]31502.28255747[/C][C]11907.71744253[/C][/ROW]
[ROW][C]24[/C][C]104838[/C][C]102804.731037786[/C][C]2033.2689622141[/C][/ROW]
[ROW][C]25[/C][C]62215[/C][C]65282.1838167494[/C][C]-3067.18381674941[/C][/ROW]
[ROW][C]26[/C][C]69304[/C][C]57919.0242076946[/C][C]11384.9757923054[/C][/ROW]
[ROW][C]27[/C][C]53117[/C][C]48713.2420297823[/C][C]4403.75797021772[/C][/ROW]
[ROW][C]28[/C][C]19764[/C][C]36914.4614427316[/C][C]-17150.4614427316[/C][/ROW]
[ROW][C]29[/C][C]86680[/C][C]86823.5220804189[/C][C]-143.522080418909[/C][/ROW]
[ROW][C]30[/C][C]84105[/C][C]60192.7398759041[/C][C]23912.2601240959[/C][/ROW]
[ROW][C]31[/C][C]77945[/C][C]56131.2995214753[/C][C]21813.7004785247[/C][/ROW]
[ROW][C]32[/C][C]89113[/C][C]91252.0180407[/C][C]-2139.01804070001[/C][/ROW]
[ROW][C]33[/C][C]91005[/C][C]62186.4006558396[/C][C]28818.5993441604[/C][/ROW]
[ROW][C]34[/C][C]40248[/C][C]36699.3586633734[/C][C]3548.6413366266[/C][/ROW]
[ROW][C]35[/C][C]64187[/C][C]61515.3770694137[/C][C]2671.62293058632[/C][/ROW]
[ROW][C]36[/C][C]50857[/C][C]52077.4014866581[/C][C]-1220.40148665805[/C][/ROW]
[ROW][C]37[/C][C]56613[/C][C]40814.6378893428[/C][C]15798.3621106572[/C][/ROW]
[ROW][C]38[/C][C]62792[/C][C]69502.7995761279[/C][C]-6710.79957612786[/C][/ROW]
[ROW][C]39[/C][C]72535[/C][C]79872.9462322992[/C][C]-7337.94623229924[/C][/ROW]
[/TABLE]
Source: https://freestatistics.org/blog/index.php?pk=190525&T=4

Globally Unique Identifier (entire table): ba.freestatistics.org/blog/index.php?pk=190525&T=4

As an alternative you can also use a QR Code:  

The GUIDs for individual cells are displayed in the table below:

Multiple Linear Regression - Actuals, Interpolation, and Residuals
Time or IndexActualsInterpolationForecastResidualsPrediction Error
1150580155005.2903637-4425.29036370035
29961199842.3379552135-231.337955213549
31934935254.0974271473-15905.0974271473
49937390437.45952286778935.54047713226
58623086424.6341776099-194.634177609898
63083733214.0202125339-2377.02021253387
73170649752.5068668598-18046.5068668598
88980673914.048798475615891.9512015244
96208872908.7203554497-10820.7203554497
104015165442.2507607823-25291.2507607823
112763438176.8519487621-10542.8519487621
127699079153.0921000158-2163.09210001575
133746034790.8125321932669.18746780701
145415752963.5686876461193.43131235398
154986264769.3259676339-14907.3259676339
168433787323.9314437573-2986.93144375727
176417570024.5027636747-5849.50276367467
185938271086.4925913806-11704.4925913806
1911930897660.546767827721647.4532321723
207670294462.3326423823-17760.3326423823
2110342596675.19660497666749.80339502336
227034472748.5533253434-2404.55332534338
234341031502.2825574711907.71744253
24104838102804.7310377862033.2689622141
256221565282.1838167494-3067.18381674941
266930457919.024207694611384.9757923054
275311748713.24202978234403.75797021772
281976436914.4614427316-17150.4614427316
298668086823.5220804189-143.522080418909
308410560192.739875904123912.2601240959
317794556131.299521475321813.7004785247
328911391252.0180407-2139.01804070001
339100562186.400655839628818.5993441604
344024836699.35866337343548.6413366266
356418761515.37706941372671.62293058632
365085752077.4014866581-1220.40148665805
375661340814.637889342815798.3621106572
386279269502.7995761279-6710.79957612786
397253579872.9462322992-7337.94623229924


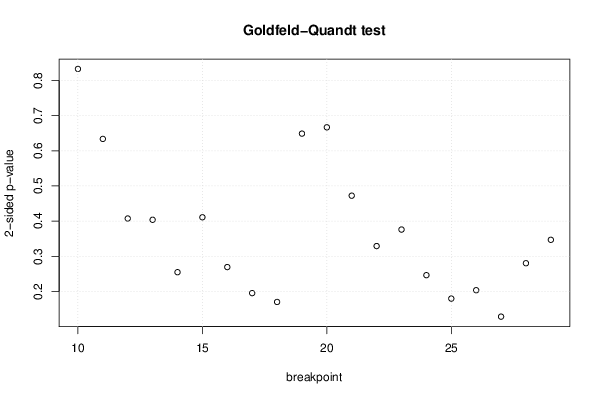
Goldfeld-Quandt test for Heteroskedasticity
p-valuesAlternative Hypothesis
breakpoint indexgreater2-sidedless
100.4164072213391550.8328144426783110.583592778660845
110.316902597106670.6338051942133390.683097402893331
120.2036913929018850.4073827858037710.796308607098115
130.2019059114601560.4038118229203130.798094088539844
140.1273272004537630.2546544009075250.872672799546237
150.2054357531295010.4108715062590020.794564246870499
160.1346189971680530.2692379943361050.865381002831947
170.09755567370132180.1951113474026440.902444326298678
180.0850043142688860.1700086285377720.914995685731114
190.3244251689001580.6488503378003160.675574831099842
200.3333906380722770.6667812761445540.666609361927723
210.2361514504556770.4723029009113530.763848549544323
220.1644855082574840.3289710165149680.835514491742516
230.187989651240160.375979302480320.81201034875984
240.1231131565271880.2462263130543770.876886843472812
250.08979218678422110.1795843735684420.910207813215779
260.1017000952222680.2034001904445370.898299904777732
270.06411417785579940.1282283557115990.935885822144201
280.1400919266325950.2801838532651910.859908073367404
290.1734131788077880.3468263576155760.826586821192212

\begin{tabular}{lllllllll}
\hline
Goldfeld-Quandt test for Heteroskedasticity \tabularnewline
p-values & Alternative Hypothesis \tabularnewline
breakpoint index & greater & 2-sided & less \tabularnewline
10 & 0.416407221339155 & 0.832814442678311 & 0.583592778660845 \tabularnewline
11 & 0.31690259710667 & 0.633805194213339 & 0.683097402893331 \tabularnewline
12 & 0.203691392901885 & 0.407382785803771 & 0.796308607098115 \tabularnewline
13 & 0.201905911460156 & 0.403811822920313 & 0.798094088539844 \tabularnewline
14 & 0.127327200453763 & 0.254654400907525 & 0.872672799546237 \tabularnewline
15 & 0.205435753129501 & 0.410871506259002 & 0.794564246870499 \tabularnewline
16 & 0.134618997168053 & 0.269237994336105 & 0.865381002831947 \tabularnewline
17 & 0.0975556737013218 & 0.195111347402644 & 0.902444326298678 \tabularnewline
18 & 0.085004314268886 & 0.170008628537772 & 0.914995685731114 \tabularnewline
19 & 0.324425168900158 & 0.648850337800316 & 0.675574831099842 \tabularnewline
20 & 0.333390638072277 & 0.666781276144554 & 0.666609361927723 \tabularnewline
21 & 0.236151450455677 & 0.472302900911353 & 0.763848549544323 \tabularnewline
22 & 0.164485508257484 & 0.328971016514968 & 0.835514491742516 \tabularnewline
23 & 0.18798965124016 & 0.37597930248032 & 0.81201034875984 \tabularnewline
24 & 0.123113156527188 & 0.246226313054377 & 0.876886843472812 \tabularnewline
25 & 0.0897921867842211 & 0.179584373568442 & 0.910207813215779 \tabularnewline
26 & 0.101700095222268 & 0.203400190444537 & 0.898299904777732 \tabularnewline
27 & 0.0641141778557994 & 0.128228355711599 & 0.935885822144201 \tabularnewline
28 & 0.140091926632595 & 0.280183853265191 & 0.859908073367404 \tabularnewline
29 & 0.173413178807788 & 0.346826357615576 & 0.826586821192212 \tabularnewline
\hline
\end{tabular}
%Source: https://freestatistics.org/blog/index.php?pk=190525&T=5

[TABLE]
[ROW][C]Goldfeld-Quandt test for Heteroskedasticity[/C][/ROW]
[ROW][C]p-values[/C][C]Alternative Hypothesis[/C][/ROW]
[ROW][C]breakpoint index[/C][C]greater[/C][C]2-sided[/C][C]less[/C][/ROW]
[ROW][C]10[/C][C]0.416407221339155[/C][C]0.832814442678311[/C][C]0.583592778660845[/C][/ROW]
[ROW][C]11[/C][C]0.31690259710667[/C][C]0.633805194213339[/C][C]0.683097402893331[/C][/ROW]
[ROW][C]12[/C][C]0.203691392901885[/C][C]0.407382785803771[/C][C]0.796308607098115[/C][/ROW]
[ROW][C]13[/C][C]0.201905911460156[/C][C]0.403811822920313[/C][C]0.798094088539844[/C][/ROW]
[ROW][C]14[/C][C]0.127327200453763[/C][C]0.254654400907525[/C][C]0.872672799546237[/C][/ROW]
[ROW][C]15[/C][C]0.205435753129501[/C][C]0.410871506259002[/C][C]0.794564246870499[/C][/ROW]
[ROW][C]16[/C][C]0.134618997168053[/C][C]0.269237994336105[/C][C]0.865381002831947[/C][/ROW]
[ROW][C]17[/C][C]0.0975556737013218[/C][C]0.195111347402644[/C][C]0.902444326298678[/C][/ROW]
[ROW][C]18[/C][C]0.085004314268886[/C][C]0.170008628537772[/C][C]0.914995685731114[/C][/ROW]
[ROW][C]19[/C][C]0.324425168900158[/C][C]0.648850337800316[/C][C]0.675574831099842[/C][/ROW]
[ROW][C]20[/C][C]0.333390638072277[/C][C]0.666781276144554[/C][C]0.666609361927723[/C][/ROW]
[ROW][C]21[/C][C]0.236151450455677[/C][C]0.472302900911353[/C][C]0.763848549544323[/C][/ROW]
[ROW][C]22[/C][C]0.164485508257484[/C][C]0.328971016514968[/C][C]0.835514491742516[/C][/ROW]
[ROW][C]23[/C][C]0.18798965124016[/C][C]0.37597930248032[/C][C]0.81201034875984[/C][/ROW]
[ROW][C]24[/C][C]0.123113156527188[/C][C]0.246226313054377[/C][C]0.876886843472812[/C][/ROW]
[ROW][C]25[/C][C]0.0897921867842211[/C][C]0.179584373568442[/C][C]0.910207813215779[/C][/ROW]
[ROW][C]26[/C][C]0.101700095222268[/C][C]0.203400190444537[/C][C]0.898299904777732[/C][/ROW]
[ROW][C]27[/C][C]0.0641141778557994[/C][C]0.128228355711599[/C][C]0.935885822144201[/C][/ROW]
[ROW][C]28[/C][C]0.140091926632595[/C][C]0.280183853265191[/C][C]0.859908073367404[/C][/ROW]
[ROW][C]29[/C][C]0.173413178807788[/C][C]0.346826357615576[/C][C]0.826586821192212[/C][/ROW]
[/TABLE]
Source: https://freestatistics.org/blog/index.php?pk=190525&T=5

Globally Unique Identifier (entire table): ba.freestatistics.org/blog/index.php?pk=190525&T=5

As an alternative you can also use a QR Code:  

The GUIDs for individual cells are displayed in the table below:

Goldfeld-Quandt test for Heteroskedasticity
p-valuesAlternative Hypothesis
breakpoint indexgreater2-sidedless
100.4164072213391550.8328144426783110.583592778660845
110.316902597106670.6338051942133390.683097402893331
120.2036913929018850.4073827858037710.796308607098115
130.2019059114601560.4038118229203130.798094088539844
140.1273272004537630.2546544009075250.872672799546237
150.2054357531295010.4108715062590020.794564246870499
160.1346189971680530.2692379943361050.865381002831947
170.09755567370132180.1951113474026440.902444326298678
180.0850043142688860.1700086285377720.914995685731114
190.3244251689001580.6488503378003160.675574831099842
200.3333906380722770.6667812761445540.666609361927723
210.2361514504556770.4723029009113530.763848549544323
220.1644855082574840.3289710165149680.835514491742516
230.187989651240160.375979302480320.81201034875984
240.1231131565271880.2462263130543770.876886843472812
250.08979218678422110.1795843735684420.910207813215779
260.1017000952222680.2034001904445370.898299904777732
270.06411417785579940.1282283557115990.935885822144201
280.1400919266325950.2801838532651910.859908073367404
290.1734131788077880.3468263576155760.826586821192212


Meta Analysis of Goldfeld-Quandt test for Heteroskedasticity
Description# significant tests% significant testsOK/NOK
1% type I error level00OK
5% type I error level00OK
10% type I error level00OK

\begin{tabular}{lllllllll}
\hline
Meta Analysis of Goldfeld-Quandt test for Heteroskedasticity \tabularnewline
Description & # significant tests & % significant tests & OK/NOK \tabularnewline
1% type I error level & 0 & 0 & OK \tabularnewline
5% type I error level & 0 & 0 & OK \tabularnewline
10% type I error level & 0 & 0 & OK \tabularnewline
\hline
\end{tabular}
%Source: https://freestatistics.org/blog/index.php?pk=190525&T=6

[TABLE]
[ROW][C]Meta Analysis of Goldfeld-Quandt test for Heteroskedasticity[/C][/ROW]
[ROW][C]Description[/C][C]# significant tests[/C][C]% significant tests[/C][C]OK/NOK[/C][/ROW]
[ROW][C]1% type I error level[/C][C]0[/C][C]0[/C][C]OK[/C][/ROW]
[ROW][C]5% type I error level[/C][C]0[/C][C]0[/C][C]OK[/C][/ROW]
[ROW][C]10% type I error level[/C][C]0[/C][C]0[/C][C]OK[/C][/ROW]
[/TABLE]
Source: https://freestatistics.org/blog/index.php?pk=190525&T=6

Globally Unique Identifier (entire table): ba.freestatistics.org/blog/index.php?pk=190525&T=6

As an alternative you can also use a QR Code:  

The GUIDs for individual cells are displayed in the table below:

Meta Analysis of Goldfeld-Quandt test for Heteroskedasticity
Description# significant tests% significant testsOK/NOK
1% type I error level00OK
5% type I error level00OK
10% type I error level00OK


Parameters (Session):
par1 = 1 ; par2 = Do not include Seasonal Dummies ; par3 = No Linear Trend ;
Parameters (R input):
par1 = 1 ; par2 = Do not include Seasonal Dummies ; par3 = No Linear Trend ;
R code (references can be found in the software module):
library(lattice)
library(lmtest)
n25 <- 25 #minimum number of obs. for Goldfeld-Quandt test
par1 <- as.numeric(par1)
x <- t(y)
k <- length(x[1,])
n <- length(x[,1])
x1 <- cbind(x[,par1], x[,1:k!=par1])
mycolnames <- c(colnames(x)[par1], colnames(x)[1:k!=par1])
colnames(x1) <- mycolnames #colnames(x)[par1]
x <- x1
if (par3 == 'First Differences'){
x2 <- array(0, dim=c(n-1,k), dimnames=list(1:(n-1), paste('(1-B)',colnames(x),sep='')))
for (i in 1:n-1) {
for (j in 1:k) {
x2[i,j] <- x[i+1,j] - x[i,j]
}
}
x <- x2
}
if (par2 == 'Include Monthly Dummies'){
x2 <- array(0, dim=c(n,11), dimnames=list(1:n, paste('M', seq(1:11), sep ='')))
for (i in 1:11){
x2[seq(i,n,12),i] <- 1
}
x <- cbind(x, x2)
}
if (par2 == 'Include Quarterly Dummies'){
x2 <- array(0, dim=c(n,3), dimnames=list(1:n, paste('Q', seq(1:3), sep ='')))
for (i in 1:3){
x2[seq(i,n,4),i] <- 1
}
x <- cbind(x, x2)
}
k <- length(x[1,])
if (par3 == 'Linear Trend'){
x <- cbind(x, c(1:n))
colnames(x)[k+1] <- 't'
}
x
k <- length(x[1,])
df <- as.data.frame(x)
(mylm <- lm(df))
(mysum <- summary(mylm))
if (n > n25) {
kp3 <- k + 3
nmkm3 <- n - k - 3
gqarr <- array(NA, dim=c(nmkm3-kp3+1,3))
numgqtests <- 0
numsignificant1 <- 0
numsignificant5 <- 0
numsignificant10 <- 0
for (mypoint in kp3:nmkm3) {
j <- 0
numgqtests <- numgqtests + 1
for (myalt in c('greater', 'two.sided', 'less')) {
j <- j + 1
gqarr[mypoint-kp3+1,j] <- gqtest(mylm, point=mypoint, alternative=myalt)$p.value
}
if (gqarr[mypoint-kp3+1,2] < 0.01) numsignificant1 <- numsignificant1 + 1
if (gqarr[mypoint-kp3+1,2] < 0.05) numsignificant5 <- numsignificant5 + 1
if (gqarr[mypoint-kp3+1,2] < 0.10) numsignificant10 <- numsignificant10 + 1
}
gqarr
}
bitmap(file='test0.png')
plot(x[,1], type='l', main='Actuals and Interpolation', ylab='value of Actuals and Interpolation (dots)', xlab='time or index')
points(x[,1]-mysum$resid)
grid()
dev.off()
bitmap(file='test1.png')
plot(mysum$resid, type='b', pch=19, main='Residuals', ylab='value of Residuals', xlab='time or index')
grid()
dev.off()
bitmap(file='test2.png')
hist(mysum$resid, main='Residual Histogram', xlab='values of Residuals')
grid()
dev.off()
bitmap(file='test3.png')
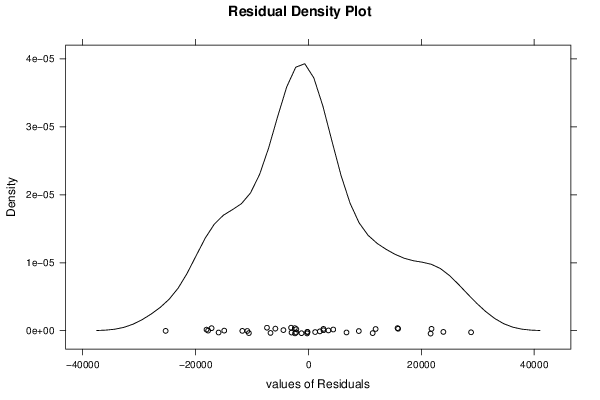
densityplot(~mysum$resid,col='black',main='Residual Density Plot', xlab='values of Residuals')
dev.off()
bitmap(file='test4.png')
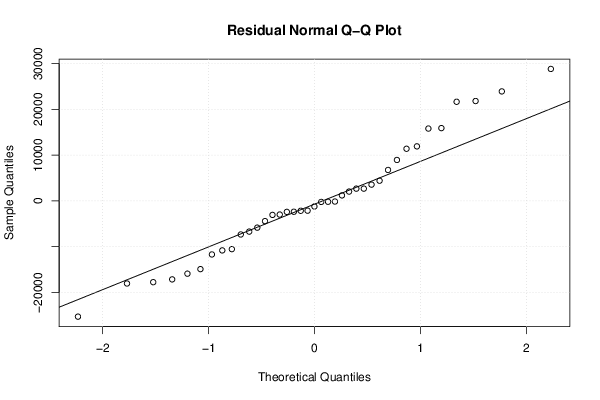
qqnorm(mysum$resid, main='Residual Normal Q-Q Plot')
qqline(mysum$resid)
grid()
dev.off()
(myerror <- as.ts(mysum$resid))
bitmap(file='test5.png')
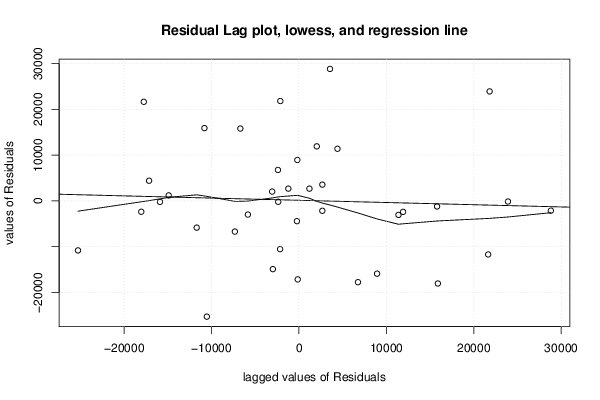
dum <- cbind(lag(myerror,k=1),myerror)
dum
dum1 <- dum[2:length(myerror),]
dum1
z <- as.data.frame(dum1)
z
plot(z,main=paste('Residual Lag plot, lowess, and regression line'), ylab='values of Residuals', xlab='lagged values of Residuals')
lines(lowess(z))
abline(lm(z))
grid()
dev.off()
bitmap(file='test6.png')
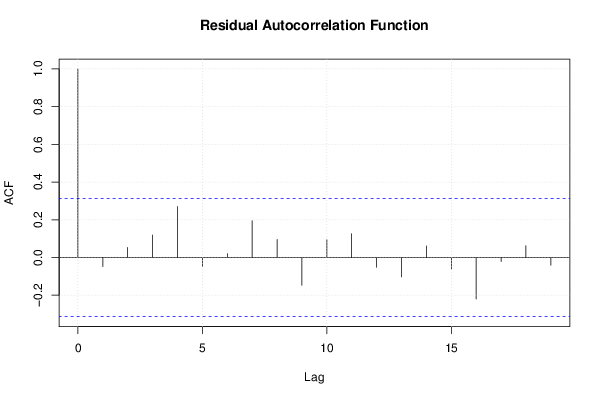
acf(mysum$resid, lag.max=length(mysum$resid)/2, main='Residual Autocorrelation Function')
grid()
dev.off()
bitmap(file='test7.png')
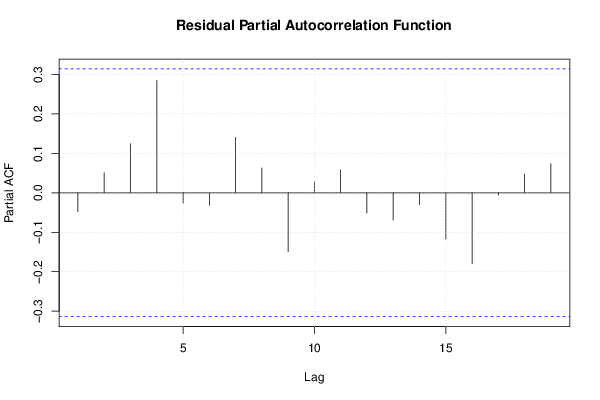
pacf(mysum$resid, lag.max=length(mysum$resid)/2, main='Residual Partial Autocorrelation Function')
grid()
dev.off()
bitmap(file='test8.png')
opar <- par(mfrow = c(2,2), oma = c(0, 0, 1.1, 0))
plot(mylm, las = 1, sub='Residual Diagnostics')
par(opar)
dev.off()
if (n > n25) {
bitmap(file='test9.png')
plot(kp3:nmkm3,gqarr[,2], main='Goldfeld-Quandt test',ylab='2-sided p-value',xlab='breakpoint')
grid()
dev.off()
}
load(file='createtable')
a<-table.start()
a<-table.row.start(a)
a<-table.element(a, 'Multiple Linear Regression - Estimated Regression Equation', 1, TRUE)
a<-table.row.end(a)
myeq <- colnames(x)[1]
myeq <- paste(myeq, '[t] = ', sep='')
for (i in 1:k){
if (mysum$coefficients[i,1] > 0) myeq <- paste(myeq, '+', '')
myeq <- paste(myeq, mysum$coefficients[i,1], sep=' ')
if (rownames(mysum$coefficients)[i] != '(Intercept)') {
myeq <- paste(myeq, rownames(mysum$coefficients)[i], sep='')
if (rownames(mysum$coefficients)[i] != 't') myeq <- paste(myeq, '[t]', sep='')
}
}
myeq <- paste(myeq, ' + e[t]')
a<-table.row.start(a)
a<-table.element(a, myeq)
a<-table.row.end(a)
a<-table.end(a)
table.save(a,file='mytable1.tab')
a<-table.start()
a<-table.row.start(a)
a<-table.element(a,hyperlink('ols1.htm','Multiple Linear Regression - Ordinary Least Squares',''), 6, TRUE)
a<-table.row.end(a)
a<-table.row.start(a)
a<-table.element(a,'Variable',header=TRUE)
a<-table.element(a,'Parameter',header=TRUE)
a<-table.element(a,'S.D.',header=TRUE)
a<-table.element(a,'T-STAT
H0: parameter = 0',header=TRUE)
a<-table.element(a,'2-tail p-value',header=TRUE)
a<-table.element(a,'1-tail p-value',header=TRUE)
a<-table.row.end(a)
for (i in 1:k){
a<-table.row.start(a)
a<-table.element(a,rownames(mysum$coefficients)[i],header=TRUE)
a<-table.element(a,mysum$coefficients[i,1])
a<-table.element(a, round(mysum$coefficients[i,2],6))
a<-table.element(a, round(mysum$coefficients[i,3],4))
a<-table.element(a, round(mysum$coefficients[i,4],6))
a<-table.element(a, round(mysum$coefficients[i,4]/2,6))
a<-table.row.end(a)
}
a<-table.end(a)
table.save(a,file='mytable2.tab')
a<-table.start()
a<-table.row.start(a)
a<-table.element(a, 'Multiple Linear Regression - Regression Statistics', 2, TRUE)
a<-table.row.end(a)
a<-table.row.start(a)
a<-table.element(a, 'Multiple R',1,TRUE)
a<-table.element(a, sqrt(mysum$r.squared))
a<-table.row.end(a)
a<-table.row.start(a)
a<-table.element(a, 'R-squared',1,TRUE)
a<-table.element(a, mysum$r.squared)
a<-table.row.end(a)
a<-table.row.start(a)
a<-table.element(a, 'Adjusted R-squared',1,TRUE)
a<-table.element(a, mysum$adj.r.squared)
a<-table.row.end(a)
a<-table.row.start(a)
a<-table.element(a, 'F-TEST (value)',1,TRUE)
a<-table.element(a, mysum$fstatistic[1])
a<-table.row.end(a)
a<-table.row.start(a)
a<-table.element(a, 'F-TEST (DF numerator)',1,TRUE)
a<-table.element(a, mysum$fstatistic[2])
a<-table.row.end(a)
a<-table.row.start(a)
a<-table.element(a, 'F-TEST (DF denominator)',1,TRUE)
a<-table.element(a, mysum$fstatistic[3])
a<-table.row.end(a)
a<-table.row.start(a)
a<-table.element(a, 'p-value',1,TRUE)
a<-table.element(a, 1-pf(mysum$fstatistic[1],mysum$fstatistic[2],mysum$fstatistic[3]))
a<-table.row.end(a)
a<-table.row.start(a)
a<-table.element(a, 'Multiple Linear Regression - Residual Statistics', 2, TRUE)
a<-table.row.end(a)
a<-table.row.start(a)
a<-table.element(a, 'Residual Standard Deviation',1,TRUE)
a<-table.element(a, mysum$sigma)
a<-table.row.end(a)
a<-table.row.start(a)
a<-table.element(a, 'Sum Squared Residuals',1,TRUE)
a<-table.element(a, sum(myerror*myerror))
a<-table.row.end(a)
a<-table.end(a)
table.save(a,file='mytable3.tab')
a<-table.start()
a<-table.row.start(a)
a<-table.element(a, 'Multiple Linear Regression - Actuals, Interpolation, and Residuals', 4, TRUE)
a<-table.row.end(a)
a<-table.row.start(a)
a<-table.element(a, 'Time or Index', 1, TRUE)
a<-table.element(a, 'Actuals', 1, TRUE)
a<-table.element(a, 'Interpolation
Forecast', 1, TRUE)
a<-table.element(a, 'Residuals
Prediction Error', 1, TRUE)
a<-table.row.end(a)
for (i in 1:n) {
a<-table.row.start(a)
a<-table.element(a,i, 1, TRUE)
a<-table.element(a,x[i])
a<-table.element(a,x[i]-mysum$resid[i])
a<-table.element(a,mysum$resid[i])
a<-table.row.end(a)
}
a<-table.end(a)
table.save(a,file='mytable4.tab')
if (n > n25) {
a<-table.start()
a<-table.row.start(a)
a<-table.element(a,'Goldfeld-Quandt test for Heteroskedasticity',4,TRUE)
a<-table.row.end(a)
a<-table.row.start(a)
a<-table.element(a,'p-values',header=TRUE)
a<-table.element(a,'Alternative Hypothesis',3,header=TRUE)
a<-table.row.end(a)
a<-table.row.start(a)
a<-table.element(a,'breakpoint index',header=TRUE)
a<-table.element(a,'greater',header=TRUE)
a<-table.element(a,'2-sided',header=TRUE)
a<-table.element(a,'less',header=TRUE)
a<-table.row.end(a)
for (mypoint in kp3:nmkm3) {
a<-table.row.start(a)
a<-table.element(a,mypoint,header=TRUE)
a<-table.element(a,gqarr[mypoint-kp3+1,1])
a<-table.element(a,gqarr[mypoint-kp3+1,2])
a<-table.element(a,gqarr[mypoint-kp3+1,3])
a<-table.row.end(a)
}
a<-table.end(a)
table.save(a,file='mytable5.tab')
a<-table.start()
a<-table.row.start(a)
a<-table.element(a,'Meta Analysis of Goldfeld-Quandt test for Heteroskedasticity',4,TRUE)
a<-table.row.end(a)
a<-table.row.start(a)
a<-table.element(a,'Description',header=TRUE)
a<-table.element(a,'# significant tests',header=TRUE)
a<-table.element(a,'% significant tests',header=TRUE)
a<-table.element(a,'OK/NOK',header=TRUE)
a<-table.row.end(a)
a<-table.row.start(a)
a<-table.element(a,'1% type I error level',header=TRUE)
a<-table.element(a,numsignificant1)
a<-table.element(a,numsignificant1/numgqtests)
if (numsignificant1/numgqtests < 0.01) dum <- 'OK' else dum <- 'NOK'
a<-table.element(a,dum)
a<-table.row.end(a)
a<-table.row.start(a)
a<-table.element(a,'5% type I error level',header=TRUE)
a<-table.element(a,numsignificant5)
a<-table.element(a,numsignificant5/numgqtests)
if (numsignificant5/numgqtests < 0.05) dum <- 'OK' else dum <- 'NOK'
a<-table.element(a,dum)
a<-table.row.end(a)
a<-table.row.start(a)
a<-table.element(a,'10% type I error level',header=TRUE)
a<-table.element(a,numsignificant10)
a<-table.element(a,numsignificant10/numgqtests)
if (numsignificant10/numgqtests < 0.1) dum <- 'OK' else dum <- 'NOK'
a<-table.element(a,dum)
a<-table.row.end(a)
a<-table.end(a)
table.save(a,file='mytable6.tab')
}