Free Statistics

of Irreproducible Research!

Author's title

Author*The author of this computation has been verified*
R Software Modulerwasp_multipleregression.wasp
Title produced by softwareMultiple Regression
Date of computationMon, 19 Nov 2012 11:51:03 -0500
Cite this page as followsStatistical Computations at FreeStatistics.org, Office for Research Development and Education, URL https://freestatistics.org/blog/index.php?v=date/2012/Nov/19/t1353344003c1mfvjouxo89dqv.htm/, Retrieved Sun, 28 Apr 2024 13:16:56 +0000
Statistical Computations at FreeStatistics.org, Office for Research Development and Education, URL https://freestatistics.org/blog/index.php?pk=190661, Retrieved Sun, 28 Apr 2024 13:16:56 +0000
QR Codes:

Original text written by user:
IsPrivate?No (this computation is public)
User-defined keywords
Estimated Impact80
Family? (F = Feedback message, R = changed R code, M = changed R Module, P = changed Parameters, D = changed Data)
-     [Multiple Regression] [Competence to learn] [2010-11-17 07:43:53] [b98453cac15ba1066b407e146608df68]
- R PD  [Multiple Regression] [] [2012-11-17 11:47:21] [6808ef3204f32b6b44f616bd4c52b0ae]
-   PD    [Multiple Regression] [] [2012-11-19 12:16:25] [6808ef3204f32b6b44f616bd4c52b0ae]
- R PD        [Multiple Regression] [] [2012-11-19 16:51:03] [2bb2c61d8bf509471ce26eaff71e2f73] [Current]
Feedback Forum

Post a new message
Dataseries X:
36	27	71	8.1	3.34	11.4	81.5	3243	8.8	42.6	11.7	21	15	59	59	921
35	23	72	11.1	3.14	11.0	78.8	4281	3.6	50.7	14.4	8	10	39	57	997
44	29	74	10.4	3.21	9.8	81.6	4260	0.8	39.4	12.4	6	6	33	54	962
47	45	79	6.5	3.41	11.1	77.5	3125	27.1	50.2	20.6	18	8	24	56	982
43	35	77	7.6	3.44	9.6	84.6	6441	24.4	43.7	14.3	43	38	206	55	107
53	45	80	7.7	3.45	10.2	66.8	3325	38.5	43.1	25.5	30	32	72	54	103
43	30	74	10.9	3.23	12.1	83.9	4679	3.5	49.2	11.3	21	32	62	56	934
45	30	73	9.3	3.29	10.6	86.0	2140	5.3	40.4	10.5	6	4	4	56	899
36	24	70	9.0	3.31	10.5	83.2	6582	8.1	42.5	12.6	18	12	37	61	100
36	27	72	9.5	3.36	10.7	79.3	4213	6.7	41.0	13.2	12	7	20	59	912
52	42	79	7.7	3.39	9.6	69.2	2302	22.2	41.3	24.2	18	8	27	56	101
33	26	76	8.6	3.20	10.9	83.4	6122	16.3	44.9	10.7	88	63	278	58	102
40	34	77	9.2	3.21	10.2	77.0	4101	13.0	45.7	15.1	26	26	146	57	970
35	28	71	8.8	3.29	11.1	86.3	3042	14.7	44.6	11.4	31	21	64	60	985
37	31	75	8.0	3.26	11.9	78.4	4259	13.1	49.6	13.9	23	9	15	58	958
35	46	85	7.1	3.22	11.8	79.9	1441	14.8	51.2	16.1	1	1	1	54	860
36	30	75	7.5	3.35	11.4	81.9	4029	12.4	44.0	12.0	6	4	16	58	936
15	30	73	8.2	3.15	12.2	84.2	4824	4.7	53.1	12.7	17	8	28	38	871
31	27	74	7.2	3.44	10.8	87.0	4834	15.8	43.5	13.6	52	35	124	59	959
30	24	72	6.5	3.53	10.8	79.5	3694	13.1	33.8	12.4	11	4	11	61	941
31	45	85	7.3	3.22	11.4	80.7	1844	11.5	48.1	18.5	1	1	1	53	891
31	24	72	9.0	3.37	10.9	82.8	3226	5.1	45.2	12.3	5	3	10	61	871
42	40	77	6.1	3.45	10.4	71.8	2269	22.7	41.4	19.5	8	3	5	53	971
43	27	72	9.0	3.25	11.5	87.1	2909	7.2	51.6	9.5	7	3	10	56	887
46	55	84	5.6	3.35	11.4	79.7	2647	21.0	46.9	17.9	6	5	1	59	952
39	29	76	8.7	3.23	11.4	78.6	4412	15.6	46.6	13.2	13	7	33	60	968
35	31	81	9.2	3.10	12.0	78.3	3262	12.6	48.6	13.9	7	4	4	55	919
43	32	74	10.1	3.38	9.5	79.2	3214	2.9	43.7	12.0	11	7	32	54	844
11	53	68	9.2	2.99	12.1	90.6	4700	7.8	48.9	12.3	648	319	130	47	861
30	35	71	8.3	3.37	9.9	77.4	4474	13.1	42.6	17.7	38	37	193	57	989
50	42	82	7.3	3.49	10.4	72.5	3497	36.7	43.3	26.4	15	10	34	59	100
60	67	82	10.0	2.98	11.5	88.6	4657	13.6	47.3	22.4	3	1	1	60	861
30	20	69	8.8	3.26	11.1	85.4	2934	5.8	44.0	9.4	33	23	125	64	929
25	12	73	9.2	3.28	12.1	83.1	2095	2.0	51.9	9.8	20	11	26	50	857
45	40	80	8.3	3.32	10.1	70.3	2682	21.0	46.1	24.1	17	14	78	56	961
46	30	72	10.2	3.16	11.3	83.2	3327	8.8	45.3	12.2	4	3	8	58	923
54	54	81	7.4	3.36	9.7	72.8	3172	31.4	45.5	24.2	20	17	1	62	111
42	33	77	9.7	3.03	10.7	83.5	7462	11.3	48.7	12.4	41	26	108	58	994
42	32	76	9.1	3.32	10.5	87.5	6092	17.5	45.3	13.2	29	32	161	54	101
36	29	72	9.5	3.32	10.6	77.6	3437	8.1	45.5	13.8	45	59	263	56	991
37	38	67	11.3	2.99	12.0	81.5	3387	3.6	50.3	13.5	56	21	44	73	893
42	29	72	10.7	3.19	10.1	79.5	3508	2.2	38.3	15.7	6	4	18	56	938
41	33	77	11.2	3.08	9.6	79.9	4843	2.7	38.6	14.1	11	11	89	54	946
44	39	78	8.2	3.32	11.0	79.9	3768	28.6	49.5	17.5	12	9	48	53	102
32	25	72	10.9	3.21	11.1	82.5	4355	5.0	46.4	10.8	7	4	18	60	874
34	32	79	9.3	3.23	9.7	76.8	5160	17.2	45.1	15.3	31	15	68	57	953
10	55	70	7.3	3.11	12.1	88.9	3033	5.9	51.0	14.0	144	66	20	61	839
18	48	63	9.2	2.92	12.2	87.7	4253	13.7	51.2	12.0	311	171	86	71	911
13	49	68	7.0	3.36	12.2	90.7	2702	3.0	51.9	9.7	105	32	3	71	790
35	40	64	9.6	3.02	12.2	82.5	3626	5.7	54.3	10.1	20	7	20	72	899
45	28	74	10.6	3.21	11.1	82.6	1883	3.4	41.9	12.3	5	4	20	56	904
38	24	72	9.8	3.34	11.4	78.0	4923	3.8	50.5	11.1	8	5	25	61	950
31	26	73	9.3	3.22	10.7	81.3	3249	9.5	43.9	13.6	11	7	25	59	972
40	23	71	11.3	3.28	10.3	73.8	1671	2.5	47.4	13.5	5	2	11	60	912
41	37	78	6.2	3.25	12.3	89.5	5308	25.9	59.7	10.3	65	28	102	52	967
28	32	81	7.0	3.27	12.1	81.0	3665	7.5	51.6	13.2	4	2	1	54	823
45	33	76	7.7	3.39	11.3	82.2	3152	12.1	47.3	10.9	14	11	42	56	100
45	24	70	11.8	3.25	11.1	79.8	3678	1.0	44.8	14.0	7	3	8	56	895
42	83	76	9.7	3.22	9.0	76.2	9699	4.8	42.2	14.5	8	8	49	54	911
38	28	72	8.9	3.48	10.7	79.8	3451	11.7	37.5	13.0	14	13	39	58	954


Summary of computational transaction
Raw Inputview raw input (R code)
Raw Outputview raw output of R engine
Computing time8 seconds
R Server'Gertrude Mary Cox' @ cox.wessa.net

\begin{tabular}{lllllllll}
\hline
Summary of computational transaction \tabularnewline
Raw Input & view raw input (R code)  \tabularnewline
Raw Output & view raw output of R engine  \tabularnewline
Computing time & 8 seconds \tabularnewline
R Server & 'Gertrude Mary Cox' @ cox.wessa.net \tabularnewline
\hline
\end{tabular}
%Source: https://freestatistics.org/blog/index.php?pk=190661&T=0

[TABLE]
[ROW][C]Summary of computational transaction[/C][/ROW]
[ROW][C]Raw Input[/C][C]view raw input (R code) [/C][/ROW]
[ROW][C]Raw Output[/C][C]view raw output of R engine [/C][/ROW]
[ROW][C]Computing time[/C][C]8 seconds[/C][/ROW]
[ROW][C]R Server[/C][C]'Gertrude Mary Cox' @ cox.wessa.net[/C][/ROW]
[/TABLE]
Source: https://freestatistics.org/blog/index.php?pk=190661&T=0

Globally Unique Identifier (entire table): ba.freestatistics.org/blog/index.php?pk=190661&T=0

As an alternative you can also use a QR Code:  

The GUIDs for individual cells are displayed in the table below:

Summary of computational transaction
Raw Inputview raw input (R code)
Raw Outputview raw output of R engine
Computing time8 seconds
R Server'Gertrude Mary Cox' @ cox.wessa.net


Multiple Linear Regression - Estimated Regression Equation
sterftecijfer[t] = + 5573.72291821456 + 0.185156860093506Gem_jaarlijkse_neerslag[t] + 1.02574417873282Gem_temp_januari[t] -1.75174487619193Gem_temp_juli[t] -66.0779665382136`Omvang_bevolking_>65jaar`[t] -757.873102331411`#leden_per_huishouden`[t] + 43.0198663038218`#jaren_onderwijs_personen>22j`[t] -15.0410952553819huishoudens_met_volledig_uitgeruste_keuken[t] -0.0234468835274374`bevolking_per_mijl\302\262`[t] -20.7521944074557`omvang_niet-blanke_bevolking`[t] -6.31414431985576`#kantoormedewerkers`[t] -9.42415121583915`#gezinnen_inkomen<$3000`[t] -0.0779986609488321index_olievervuiling[t] -0.357116769719697index_stikstofoxidevervuiling[t] + 0.0103298677001577index_zwaveldioxidevervuiling[t] -2.20668562764833luchtvochtigheidgraad[t] + e[t]

\begin{tabular}{lllllllll}
\hline
Multiple Linear Regression - Estimated Regression Equation \tabularnewline
sterftecijfer[t] =  +  5573.72291821456 +  0.185156860093506Gem_jaarlijkse_neerslag[t] +  1.02574417873282Gem_temp_januari[t] -1.75174487619193Gem_temp_juli[t] -66.0779665382136`Omvang_bevolking_>65jaar`[t] -757.873102331411`#leden_per_huishouden`[t] +  43.0198663038218`#jaren_onderwijs_personen>22j`[t] -15.0410952553819huishoudens_met_volledig_uitgeruste_keuken[t] -0.0234468835274374`bevolking_per_mijl\302\262`[t] -20.7521944074557`omvang_niet-blanke_bevolking`[t] -6.31414431985576`#kantoormedewerkers`[t] -9.42415121583915`#gezinnen_inkomen<$3000`[t] -0.0779986609488321index_olievervuiling[t] -0.357116769719697index_stikstofoxidevervuiling[t] +  0.0103298677001577index_zwaveldioxidevervuiling[t] -2.20668562764833luchtvochtigheidgraad[t]  + e[t] \tabularnewline
\hline
\end{tabular}
%Source: https://freestatistics.org/blog/index.php?pk=190661&T=1

[TABLE]
[ROW][C]Multiple Linear Regression - Estimated Regression Equation[/C][/ROW]
[ROW][C]sterftecijfer[t] =  +  5573.72291821456 +  0.185156860093506Gem_jaarlijkse_neerslag[t] +  1.02574417873282Gem_temp_januari[t] -1.75174487619193Gem_temp_juli[t] -66.0779665382136`Omvang_bevolking_>65jaar`[t] -757.873102331411`#leden_per_huishouden`[t] +  43.0198663038218`#jaren_onderwijs_personen>22j`[t] -15.0410952553819huishoudens_met_volledig_uitgeruste_keuken[t] -0.0234468835274374`bevolking_per_mijl\302\262`[t] -20.7521944074557`omvang_niet-blanke_bevolking`[t] -6.31414431985576`#kantoormedewerkers`[t] -9.42415121583915`#gezinnen_inkomen<$3000`[t] -0.0779986609488321index_olievervuiling[t] -0.357116769719697index_stikstofoxidevervuiling[t] +  0.0103298677001577index_zwaveldioxidevervuiling[t] -2.20668562764833luchtvochtigheidgraad[t]  + e[t][/C][/ROW]
[/TABLE]
Source: https://freestatistics.org/blog/index.php?pk=190661&T=1

Globally Unique Identifier (entire table): ba.freestatistics.org/blog/index.php?pk=190661&T=1

As an alternative you can also use a QR Code:  

The GUIDs for individual cells are displayed in the table below:

Multiple Linear Regression - Estimated Regression Equation
sterftecijfer[t] = + 5573.72291821456 + 0.185156860093506Gem_jaarlijkse_neerslag[t] + 1.02574417873282Gem_temp_januari[t] -1.75174487619193Gem_temp_juli[t] -66.0779665382136`Omvang_bevolking_>65jaar`[t] -757.873102331411`#leden_per_huishouden`[t] + 43.0198663038218`#jaren_onderwijs_personen>22j`[t] -15.0410952553819huishoudens_met_volledig_uitgeruste_keuken[t] -0.0234468835274374`bevolking_per_mijl\302\262`[t] -20.7521944074557`omvang_niet-blanke_bevolking`[t] -6.31414431985576`#kantoormedewerkers`[t] -9.42415121583915`#gezinnen_inkomen<$3000`[t] -0.0779986609488321index_olievervuiling[t] -0.357116769719697index_stikstofoxidevervuiling[t] + 0.0103298677001577index_zwaveldioxidevervuiling[t] -2.20668562764833luchtvochtigheidgraad[t] + e[t]


Multiple Linear Regression - Ordinary Least Squares
VariableParameterS.D.T-STATH0: parameter = 02-tail p-value1-tail p-value
(Intercept)5573.722918214563574.6147411.55930.1261010.063051
Gem_jaarlijkse_neerslag0.1851568600935067.3241370.02530.9799460.489973
Gem_temp_januari1.025744178732825.8747790.17460.8621940.431097
Gem_temp_juli-1.7517448761919315.408229-0.11370.9100020.455001
`Omvang_bevolking_>65jaar`-66.077966538213667.401677-0.98040.3322680.166134
`#leden_per_huishouden`-757.873102331411539.493434-1.40480.1671060.083553
`#jaren_onderwijs_personen>22j`43.019866303821897.5548010.4410.6613860.330693
huishoudens_met_volledig_uitgeruste_keuken-15.041095255381912.760139-1.17880.244830.122415
`bevolking_per_mijl\302\262`-0.02344688352743740.035875-0.65360.5167930.258397
`omvang_niet-blanke_bevolking`-20.752194407455711.158573-1.85980.0696140.034807
`#kantoormedewerkers`-6.3141443198557613.49535-0.46790.6421830.321091
`#gezinnen_inkomen<$3000`-9.4241512158391522.318748-0.42230.6748970.337448
index_olievervuiling-0.07799866094883213.936371-0.01980.9842810.49214
index_stikstofoxidevervuiling-0.3571167697196978.131-0.04390.9651670.482583
index_zwaveldioxidevervuiling0.01032986770015771.2379640.00830.993380.49669
luchtvochtigheidgraad-2.206685627648339.150472-0.24120.8105550.405277

\begin{tabular}{lllllllll}
\hline
Multiple Linear Regression - Ordinary Least Squares \tabularnewline
Variable & Parameter & S.D. & T-STATH0: parameter = 0 & 2-tail p-value & 1-tail p-value \tabularnewline
(Intercept) & 5573.72291821456 & 3574.614741 & 1.5593 & 0.126101 & 0.063051 \tabularnewline
Gem_jaarlijkse_neerslag & 0.185156860093506 & 7.324137 & 0.0253 & 0.979946 & 0.489973 \tabularnewline
Gem_temp_januari & 1.02574417873282 & 5.874779 & 0.1746 & 0.862194 & 0.431097 \tabularnewline
Gem_temp_juli & -1.75174487619193 & 15.408229 & -0.1137 & 0.910002 & 0.455001 \tabularnewline
`Omvang_bevolking_>65jaar` & -66.0779665382136 & 67.401677 & -0.9804 & 0.332268 & 0.166134 \tabularnewline
`#leden_per_huishouden` & -757.873102331411 & 539.493434 & -1.4048 & 0.167106 & 0.083553 \tabularnewline
`#jaren_onderwijs_personen>22j` & 43.0198663038218 & 97.554801 & 0.441 & 0.661386 & 0.330693 \tabularnewline
huishoudens_met_volledig_uitgeruste_keuken & -15.0410952553819 & 12.760139 & -1.1788 & 0.24483 & 0.122415 \tabularnewline
`bevolking_per_mijl\302\262` & -0.0234468835274374 & 0.035875 & -0.6536 & 0.516793 & 0.258397 \tabularnewline
`omvang_niet-blanke_bevolking` & -20.7521944074557 & 11.158573 & -1.8598 & 0.069614 & 0.034807 \tabularnewline
`#kantoormedewerkers` & -6.31414431985576 & 13.49535 & -0.4679 & 0.642183 & 0.321091 \tabularnewline
`#gezinnen_inkomen<$3000` & -9.42415121583915 & 22.318748 & -0.4223 & 0.674897 & 0.337448 \tabularnewline
index_olievervuiling & -0.0779986609488321 & 3.936371 & -0.0198 & 0.984281 & 0.49214 \tabularnewline
index_stikstofoxidevervuiling & -0.357116769719697 & 8.131 & -0.0439 & 0.965167 & 0.482583 \tabularnewline
index_zwaveldioxidevervuiling & 0.0103298677001577 & 1.237964 & 0.0083 & 0.99338 & 0.49669 \tabularnewline
luchtvochtigheidgraad & -2.20668562764833 & 9.150472 & -0.2412 & 0.810555 & 0.405277 \tabularnewline
\hline
\end{tabular}
%Source: https://freestatistics.org/blog/index.php?pk=190661&T=2

[TABLE]
[ROW][C]Multiple Linear Regression - Ordinary Least Squares[/C][/ROW]
[ROW][C]Variable[/C][C]Parameter[/C][C]S.D.[/C][C]T-STATH0: parameter = 0[/C][C]2-tail p-value[/C][C]1-tail p-value[/C][/ROW]
[ROW][C](Intercept)[/C][C]5573.72291821456[/C][C]3574.614741[/C][C]1.5593[/C][C]0.126101[/C][C]0.063051[/C][/ROW]
[ROW][C]Gem_jaarlijkse_neerslag[/C][C]0.185156860093506[/C][C]7.324137[/C][C]0.0253[/C][C]0.979946[/C][C]0.489973[/C][/ROW]
[ROW][C]Gem_temp_januari[/C][C]1.02574417873282[/C][C]5.874779[/C][C]0.1746[/C][C]0.862194[/C][C]0.431097[/C][/ROW]
[ROW][C]Gem_temp_juli[/C][C]-1.75174487619193[/C][C]15.408229[/C][C]-0.1137[/C][C]0.910002[/C][C]0.455001[/C][/ROW]
[ROW][C]`Omvang_bevolking_>65jaar`[/C][C]-66.0779665382136[/C][C]67.401677[/C][C]-0.9804[/C][C]0.332268[/C][C]0.166134[/C][/ROW]
[ROW][C]`#leden_per_huishouden`[/C][C]-757.873102331411[/C][C]539.493434[/C][C]-1.4048[/C][C]0.167106[/C][C]0.083553[/C][/ROW]
[ROW][C]`#jaren_onderwijs_personen>22j`[/C][C]43.0198663038218[/C][C]97.554801[/C][C]0.441[/C][C]0.661386[/C][C]0.330693[/C][/ROW]
[ROW][C]huishoudens_met_volledig_uitgeruste_keuken[/C][C]-15.0410952553819[/C][C]12.760139[/C][C]-1.1788[/C][C]0.24483[/C][C]0.122415[/C][/ROW]
[ROW][C]`bevolking_per_mijl\302\262`[/C][C]-0.0234468835274374[/C][C]0.035875[/C][C]-0.6536[/C][C]0.516793[/C][C]0.258397[/C][/ROW]
[ROW][C]`omvang_niet-blanke_bevolking`[/C][C]-20.7521944074557[/C][C]11.158573[/C][C]-1.8598[/C][C]0.069614[/C][C]0.034807[/C][/ROW]
[ROW][C]`#kantoormedewerkers`[/C][C]-6.31414431985576[/C][C]13.49535[/C][C]-0.4679[/C][C]0.642183[/C][C]0.321091[/C][/ROW]
[ROW][C]`#gezinnen_inkomen<$3000`[/C][C]-9.42415121583915[/C][C]22.318748[/C][C]-0.4223[/C][C]0.674897[/C][C]0.337448[/C][/ROW]
[ROW][C]index_olievervuiling[/C][C]-0.0779986609488321[/C][C]3.936371[/C][C]-0.0198[/C][C]0.984281[/C][C]0.49214[/C][/ROW]
[ROW][C]index_stikstofoxidevervuiling[/C][C]-0.357116769719697[/C][C]8.131[/C][C]-0.0439[/C][C]0.965167[/C][C]0.482583[/C][/ROW]
[ROW][C]index_zwaveldioxidevervuiling[/C][C]0.0103298677001577[/C][C]1.237964[/C][C]0.0083[/C][C]0.99338[/C][C]0.49669[/C][/ROW]
[ROW][C]luchtvochtigheidgraad[/C][C]-2.20668562764833[/C][C]9.150472[/C][C]-0.2412[/C][C]0.810555[/C][C]0.405277[/C][/ROW]
[/TABLE]
Source: https://freestatistics.org/blog/index.php?pk=190661&T=2

Globally Unique Identifier (entire table): ba.freestatistics.org/blog/index.php?pk=190661&T=2

As an alternative you can also use a QR Code:  

The GUIDs for individual cells are displayed in the table below:

Multiple Linear Regression - Ordinary Least Squares
VariableParameterS.D.T-STATH0: parameter = 02-tail p-value1-tail p-value
(Intercept)5573.722918214563574.6147411.55930.1261010.063051
Gem_jaarlijkse_neerslag0.1851568600935067.3241370.02530.9799460.489973
Gem_temp_januari1.025744178732825.8747790.17460.8621940.431097
Gem_temp_juli-1.7517448761919315.408229-0.11370.9100020.455001
`Omvang_bevolking_>65jaar`-66.077966538213667.401677-0.98040.3322680.166134
`#leden_per_huishouden`-757.873102331411539.493434-1.40480.1671060.083553
`#jaren_onderwijs_personen>22j`43.019866303821897.5548010.4410.6613860.330693
huishoudens_met_volledig_uitgeruste_keuken-15.041095255381912.760139-1.17880.244830.122415
`bevolking_per_mijl\302\262`-0.02344688352743740.035875-0.65360.5167930.258397
`omvang_niet-blanke_bevolking`-20.752194407455711.158573-1.85980.0696140.034807
`#kantoormedewerkers`-6.3141443198557613.49535-0.46790.6421830.321091
`#gezinnen_inkomen<$3000`-9.4241512158391522.318748-0.42230.6748970.337448
index_olievervuiling-0.07799866094883213.936371-0.01980.9842810.49214
index_stikstofoxidevervuiling-0.3571167697196978.131-0.04390.9651670.482583
index_zwaveldioxidevervuiling0.01032986770015771.2379640.00830.993380.49669
luchtvochtigheidgraad-2.206685627648339.150472-0.24120.8105550.405277


Multiple Linear Regression - Regression Statistics
Multiple R0.624498386666687
R-squared0.389998234949295
Adjusted R-squared0.182043087772918
F-TEST (value)1.87539592188367
F-TEST (DF numerator)15
F-TEST (DF denominator)44
p-value0.0535559662015176
Multiple Linear Regression - Residual Statistics
Residual Standard Deviation281.335775779578
Sum Squared Residuals3482592.02427386

\begin{tabular}{lllllllll}
\hline
Multiple Linear Regression - Regression Statistics \tabularnewline
Multiple R & 0.624498386666687 \tabularnewline
R-squared & 0.389998234949295 \tabularnewline
Adjusted R-squared & 0.182043087772918 \tabularnewline
F-TEST (value) & 1.87539592188367 \tabularnewline
F-TEST (DF numerator) & 15 \tabularnewline
F-TEST (DF denominator) & 44 \tabularnewline
p-value & 0.0535559662015176 \tabularnewline
Multiple Linear Regression - Residual Statistics \tabularnewline
Residual Standard Deviation & 281.335775779578 \tabularnewline
Sum Squared Residuals & 3482592.02427386 \tabularnewline
\hline
\end{tabular}
%Source: https://freestatistics.org/blog/index.php?pk=190661&T=3

[TABLE]
[ROW][C]Multiple Linear Regression - Regression Statistics[/C][/ROW]
[ROW][C]Multiple R[/C][C]0.624498386666687[/C][/ROW]
[ROW][C]R-squared[/C][C]0.389998234949295[/C][/ROW]
[ROW][C]Adjusted R-squared[/C][C]0.182043087772918[/C][/ROW]
[ROW][C]F-TEST (value)[/C][C]1.87539592188367[/C][/ROW]
[ROW][C]F-TEST (DF numerator)[/C][C]15[/C][/ROW]
[ROW][C]F-TEST (DF denominator)[/C][C]44[/C][/ROW]
[ROW][C]p-value[/C][C]0.0535559662015176[/C][/ROW]
[ROW][C]Multiple Linear Regression - Residual Statistics[/C][/ROW]
[ROW][C]Residual Standard Deviation[/C][C]281.335775779578[/C][/ROW]
[ROW][C]Sum Squared Residuals[/C][C]3482592.02427386[/C][/ROW]
[/TABLE]
Source: https://freestatistics.org/blog/index.php?pk=190661&T=3

Globally Unique Identifier (entire table): ba.freestatistics.org/blog/index.php?pk=190661&T=3

As an alternative you can also use a QR Code:  

The GUIDs for individual cells are displayed in the table below:

Multiple Linear Regression - Regression Statistics
Multiple R0.624498386666687
R-squared0.389998234949295
Adjusted R-squared0.182043087772918
F-TEST (value)1.87539592188367
F-TEST (DF numerator)15
F-TEST (DF denominator)44
p-value0.0535559662015176
Multiple Linear Regression - Residual Statistics
Residual Standard Deviation281.335775779578
Sum Squared Residuals3482592.02427386


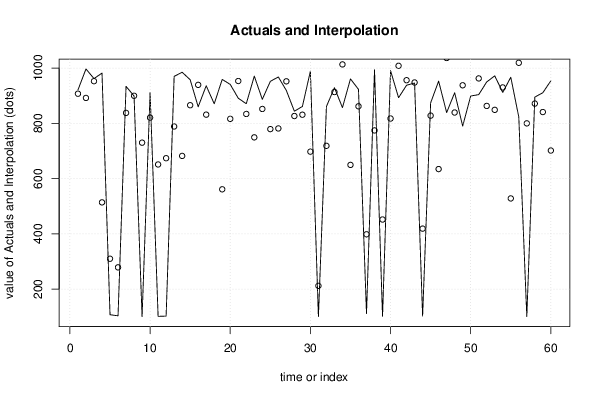
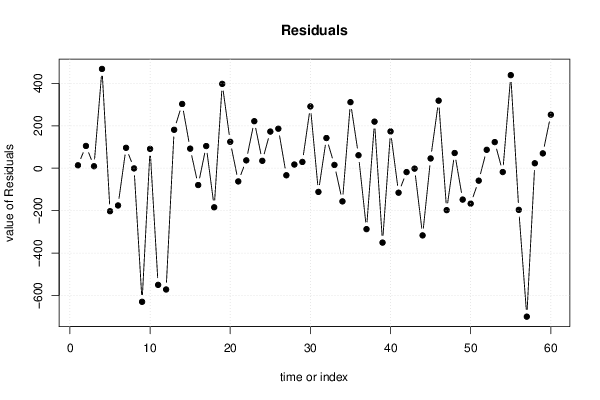
Multiple Linear Regression - Actuals, Interpolation, and Residuals
Time or IndexActualsInterpolationForecastResidualsPrediction Error
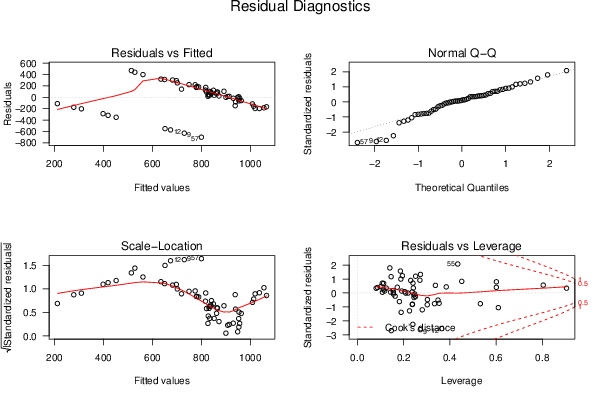
1921907.27690901864613.7230909813539
2997891.970870973005105.029129026995
3962952.6920153862769.30798461372387
4982513.826577947916468.173422052084
5107309.706868237439-202.706868237439
6103278.589239115447-175.589239115447
7934837.75129268636596.248707313635
8899899.861207581887-0.861207581886657
9100729.981491208755-629.981491208755
10912820.79364467954991.2063553204512
11101651.132790489304-550.132790489304
12102673.770201771466-571.770201771466
13970788.68729351898181.31270648102
14985682.049467553252302.950532446748
15958865.68329858833492.3167014116655
16860939.317016013865-79.3170160138652
17936831.455340813285104.544659186715
188711055.27917833629-184.279178336291
19959561.193983828368397.806016171632
20941816.293768104562124.706231895438
21891953.289945945515-62.2899459455154
22871833.97672277319637.0232772268036
23971749.312745470374221.687254529626
24887852.06340449059434.9365955094056
25952779.125815998156172.874184001844
26968781.552109489621186.447890510379
27919952.181523456547-33.1815234565473
28844826.5689542321117.4310457678903
29861831.28380789677929.7161921032207
30989697.531396489493291.468603510507
31100211.616145819393-111.616145819393
32861718.59610784849142.403892151511
33929913.49112960378215.5088703962183
348571013.42734822636-156.427348226358
35961649.491986076389311.508013923611
36923861.79698276434661.2030172356539
37111398.305049407989-287.305049407989
38994774.360181968579219.639818031421
39101451.736312263537-350.736312263537
40991817.487688609385173.512311390615
418931008.4017197109-115.401719710897
42938956.222281681493-18.2222816814931
43946947.945756994411-1.94575699441064
44102418.752789000392-316.752789000392
45874827.95463765565446.0453623443457
46953634.401153110721318.598846889279
478391036.68622341773-197.686223417734
48911839.25357421668271.7464257833183
49790937.898704716838-147.898704716838
508991065.86583583595-166.865835835949
51904962.699729371848-58.6997293718483
52950863.09305745158686.9069425484144
53972848.871628812539123.128371187461
54912929.945971546506-17.9459715465057
55967528.101883833459438.898116166541
568231019.30079389803-196.300793898027
57100799.979014003808-699.979014003808
58895871.57351102469723.4264889753032
59911840.9786126921770.02138730783
60954701.565306340964252.434693659036

\begin{tabular}{lllllllll}
\hline
Multiple Linear Regression - Actuals, Interpolation, and Residuals \tabularnewline
Time or Index & Actuals & InterpolationForecast & ResidualsPrediction Error \tabularnewline
1 & 921 & 907.276909018646 & 13.7230909813539 \tabularnewline
2 & 997 & 891.970870973005 & 105.029129026995 \tabularnewline
3 & 962 & 952.692015386276 & 9.30798461372387 \tabularnewline
4 & 982 & 513.826577947916 & 468.173422052084 \tabularnewline
5 & 107 & 309.706868237439 & -202.706868237439 \tabularnewline
6 & 103 & 278.589239115447 & -175.589239115447 \tabularnewline
7 & 934 & 837.751292686365 & 96.248707313635 \tabularnewline
8 & 899 & 899.861207581887 & -0.861207581886657 \tabularnewline
9 & 100 & 729.981491208755 & -629.981491208755 \tabularnewline
10 & 912 & 820.793644679549 & 91.2063553204512 \tabularnewline
11 & 101 & 651.132790489304 & -550.132790489304 \tabularnewline
12 & 102 & 673.770201771466 & -571.770201771466 \tabularnewline
13 & 970 & 788.68729351898 & 181.31270648102 \tabularnewline
14 & 985 & 682.049467553252 & 302.950532446748 \tabularnewline
15 & 958 & 865.683298588334 & 92.3167014116655 \tabularnewline
16 & 860 & 939.317016013865 & -79.3170160138652 \tabularnewline
17 & 936 & 831.455340813285 & 104.544659186715 \tabularnewline
18 & 871 & 1055.27917833629 & -184.279178336291 \tabularnewline
19 & 959 & 561.193983828368 & 397.806016171632 \tabularnewline
20 & 941 & 816.293768104562 & 124.706231895438 \tabularnewline
21 & 891 & 953.289945945515 & -62.2899459455154 \tabularnewline
22 & 871 & 833.976722773196 & 37.0232772268036 \tabularnewline
23 & 971 & 749.312745470374 & 221.687254529626 \tabularnewline
24 & 887 & 852.063404490594 & 34.9365955094056 \tabularnewline
25 & 952 & 779.125815998156 & 172.874184001844 \tabularnewline
26 & 968 & 781.552109489621 & 186.447890510379 \tabularnewline
27 & 919 & 952.181523456547 & -33.1815234565473 \tabularnewline
28 & 844 & 826.56895423211 & 17.4310457678903 \tabularnewline
29 & 861 & 831.283807896779 & 29.7161921032207 \tabularnewline
30 & 989 & 697.531396489493 & 291.468603510507 \tabularnewline
31 & 100 & 211.616145819393 & -111.616145819393 \tabularnewline
32 & 861 & 718.59610784849 & 142.403892151511 \tabularnewline
33 & 929 & 913.491129603782 & 15.5088703962183 \tabularnewline
34 & 857 & 1013.42734822636 & -156.427348226358 \tabularnewline
35 & 961 & 649.491986076389 & 311.508013923611 \tabularnewline
36 & 923 & 861.796982764346 & 61.2030172356539 \tabularnewline
37 & 111 & 398.305049407989 & -287.305049407989 \tabularnewline
38 & 994 & 774.360181968579 & 219.639818031421 \tabularnewline
39 & 101 & 451.736312263537 & -350.736312263537 \tabularnewline
40 & 991 & 817.487688609385 & 173.512311390615 \tabularnewline
41 & 893 & 1008.4017197109 & -115.401719710897 \tabularnewline
42 & 938 & 956.222281681493 & -18.2222816814931 \tabularnewline
43 & 946 & 947.945756994411 & -1.94575699441064 \tabularnewline
44 & 102 & 418.752789000392 & -316.752789000392 \tabularnewline
45 & 874 & 827.954637655654 & 46.0453623443457 \tabularnewline
46 & 953 & 634.401153110721 & 318.598846889279 \tabularnewline
47 & 839 & 1036.68622341773 & -197.686223417734 \tabularnewline
48 & 911 & 839.253574216682 & 71.7464257833183 \tabularnewline
49 & 790 & 937.898704716838 & -147.898704716838 \tabularnewline
50 & 899 & 1065.86583583595 & -166.865835835949 \tabularnewline
51 & 904 & 962.699729371848 & -58.6997293718483 \tabularnewline
52 & 950 & 863.093057451586 & 86.9069425484144 \tabularnewline
53 & 972 & 848.871628812539 & 123.128371187461 \tabularnewline
54 & 912 & 929.945971546506 & -17.9459715465057 \tabularnewline
55 & 967 & 528.101883833459 & 438.898116166541 \tabularnewline
56 & 823 & 1019.30079389803 & -196.300793898027 \tabularnewline
57 & 100 & 799.979014003808 & -699.979014003808 \tabularnewline
58 & 895 & 871.573511024697 & 23.4264889753032 \tabularnewline
59 & 911 & 840.97861269217 & 70.02138730783 \tabularnewline
60 & 954 & 701.565306340964 & 252.434693659036 \tabularnewline
\hline
\end{tabular}
%Source: https://freestatistics.org/blog/index.php?pk=190661&T=4

[TABLE]
[ROW][C]Multiple Linear Regression - Actuals, Interpolation, and Residuals[/C][/ROW]
[ROW][C]Time or Index[/C][C]Actuals[/C][C]InterpolationForecast[/C][C]ResidualsPrediction Error[/C][/ROW]
[ROW][C]1[/C][C]921[/C][C]907.276909018646[/C][C]13.7230909813539[/C][/ROW]
[ROW][C]2[/C][C]997[/C][C]891.970870973005[/C][C]105.029129026995[/C][/ROW]
[ROW][C]3[/C][C]962[/C][C]952.692015386276[/C][C]9.30798461372387[/C][/ROW]
[ROW][C]4[/C][C]982[/C][C]513.826577947916[/C][C]468.173422052084[/C][/ROW]
[ROW][C]5[/C][C]107[/C][C]309.706868237439[/C][C]-202.706868237439[/C][/ROW]
[ROW][C]6[/C][C]103[/C][C]278.589239115447[/C][C]-175.589239115447[/C][/ROW]
[ROW][C]7[/C][C]934[/C][C]837.751292686365[/C][C]96.248707313635[/C][/ROW]
[ROW][C]8[/C][C]899[/C][C]899.861207581887[/C][C]-0.861207581886657[/C][/ROW]
[ROW][C]9[/C][C]100[/C][C]729.981491208755[/C][C]-629.981491208755[/C][/ROW]
[ROW][C]10[/C][C]912[/C][C]820.793644679549[/C][C]91.2063553204512[/C][/ROW]
[ROW][C]11[/C][C]101[/C][C]651.132790489304[/C][C]-550.132790489304[/C][/ROW]
[ROW][C]12[/C][C]102[/C][C]673.770201771466[/C][C]-571.770201771466[/C][/ROW]
[ROW][C]13[/C][C]970[/C][C]788.68729351898[/C][C]181.31270648102[/C][/ROW]
[ROW][C]14[/C][C]985[/C][C]682.049467553252[/C][C]302.950532446748[/C][/ROW]
[ROW][C]15[/C][C]958[/C][C]865.683298588334[/C][C]92.3167014116655[/C][/ROW]
[ROW][C]16[/C][C]860[/C][C]939.317016013865[/C][C]-79.3170160138652[/C][/ROW]
[ROW][C]17[/C][C]936[/C][C]831.455340813285[/C][C]104.544659186715[/C][/ROW]
[ROW][C]18[/C][C]871[/C][C]1055.27917833629[/C][C]-184.279178336291[/C][/ROW]
[ROW][C]19[/C][C]959[/C][C]561.193983828368[/C][C]397.806016171632[/C][/ROW]
[ROW][C]20[/C][C]941[/C][C]816.293768104562[/C][C]124.706231895438[/C][/ROW]
[ROW][C]21[/C][C]891[/C][C]953.289945945515[/C][C]-62.2899459455154[/C][/ROW]
[ROW][C]22[/C][C]871[/C][C]833.976722773196[/C][C]37.0232772268036[/C][/ROW]
[ROW][C]23[/C][C]971[/C][C]749.312745470374[/C][C]221.687254529626[/C][/ROW]
[ROW][C]24[/C][C]887[/C][C]852.063404490594[/C][C]34.9365955094056[/C][/ROW]
[ROW][C]25[/C][C]952[/C][C]779.125815998156[/C][C]172.874184001844[/C][/ROW]
[ROW][C]26[/C][C]968[/C][C]781.552109489621[/C][C]186.447890510379[/C][/ROW]
[ROW][C]27[/C][C]919[/C][C]952.181523456547[/C][C]-33.1815234565473[/C][/ROW]
[ROW][C]28[/C][C]844[/C][C]826.56895423211[/C][C]17.4310457678903[/C][/ROW]
[ROW][C]29[/C][C]861[/C][C]831.283807896779[/C][C]29.7161921032207[/C][/ROW]
[ROW][C]30[/C][C]989[/C][C]697.531396489493[/C][C]291.468603510507[/C][/ROW]
[ROW][C]31[/C][C]100[/C][C]211.616145819393[/C][C]-111.616145819393[/C][/ROW]
[ROW][C]32[/C][C]861[/C][C]718.59610784849[/C][C]142.403892151511[/C][/ROW]
[ROW][C]33[/C][C]929[/C][C]913.491129603782[/C][C]15.5088703962183[/C][/ROW]
[ROW][C]34[/C][C]857[/C][C]1013.42734822636[/C][C]-156.427348226358[/C][/ROW]
[ROW][C]35[/C][C]961[/C][C]649.491986076389[/C][C]311.508013923611[/C][/ROW]
[ROW][C]36[/C][C]923[/C][C]861.796982764346[/C][C]61.2030172356539[/C][/ROW]
[ROW][C]37[/C][C]111[/C][C]398.305049407989[/C][C]-287.305049407989[/C][/ROW]
[ROW][C]38[/C][C]994[/C][C]774.360181968579[/C][C]219.639818031421[/C][/ROW]
[ROW][C]39[/C][C]101[/C][C]451.736312263537[/C][C]-350.736312263537[/C][/ROW]
[ROW][C]40[/C][C]991[/C][C]817.487688609385[/C][C]173.512311390615[/C][/ROW]
[ROW][C]41[/C][C]893[/C][C]1008.4017197109[/C][C]-115.401719710897[/C][/ROW]
[ROW][C]42[/C][C]938[/C][C]956.222281681493[/C][C]-18.2222816814931[/C][/ROW]
[ROW][C]43[/C][C]946[/C][C]947.945756994411[/C][C]-1.94575699441064[/C][/ROW]
[ROW][C]44[/C][C]102[/C][C]418.752789000392[/C][C]-316.752789000392[/C][/ROW]
[ROW][C]45[/C][C]874[/C][C]827.954637655654[/C][C]46.0453623443457[/C][/ROW]
[ROW][C]46[/C][C]953[/C][C]634.401153110721[/C][C]318.598846889279[/C][/ROW]
[ROW][C]47[/C][C]839[/C][C]1036.68622341773[/C][C]-197.686223417734[/C][/ROW]
[ROW][C]48[/C][C]911[/C][C]839.253574216682[/C][C]71.7464257833183[/C][/ROW]
[ROW][C]49[/C][C]790[/C][C]937.898704716838[/C][C]-147.898704716838[/C][/ROW]
[ROW][C]50[/C][C]899[/C][C]1065.86583583595[/C][C]-166.865835835949[/C][/ROW]
[ROW][C]51[/C][C]904[/C][C]962.699729371848[/C][C]-58.6997293718483[/C][/ROW]
[ROW][C]52[/C][C]950[/C][C]863.093057451586[/C][C]86.9069425484144[/C][/ROW]
[ROW][C]53[/C][C]972[/C][C]848.871628812539[/C][C]123.128371187461[/C][/ROW]
[ROW][C]54[/C][C]912[/C][C]929.945971546506[/C][C]-17.9459715465057[/C][/ROW]
[ROW][C]55[/C][C]967[/C][C]528.101883833459[/C][C]438.898116166541[/C][/ROW]
[ROW][C]56[/C][C]823[/C][C]1019.30079389803[/C][C]-196.300793898027[/C][/ROW]
[ROW][C]57[/C][C]100[/C][C]799.979014003808[/C][C]-699.979014003808[/C][/ROW]
[ROW][C]58[/C][C]895[/C][C]871.573511024697[/C][C]23.4264889753032[/C][/ROW]
[ROW][C]59[/C][C]911[/C][C]840.97861269217[/C][C]70.02138730783[/C][/ROW]
[ROW][C]60[/C][C]954[/C][C]701.565306340964[/C][C]252.434693659036[/C][/ROW]
[/TABLE]
Source: https://freestatistics.org/blog/index.php?pk=190661&T=4

Globally Unique Identifier (entire table): ba.freestatistics.org/blog/index.php?pk=190661&T=4

As an alternative you can also use a QR Code:  

The GUIDs for individual cells are displayed in the table below:

Multiple Linear Regression - Actuals, Interpolation, and Residuals
Time or IndexActualsInterpolationForecastResidualsPrediction Error
1921907.27690901864613.7230909813539
2997891.970870973005105.029129026995
3962952.6920153862769.30798461372387
4982513.826577947916468.173422052084
5107309.706868237439-202.706868237439
6103278.589239115447-175.589239115447
7934837.75129268636596.248707313635
8899899.861207581887-0.861207581886657
9100729.981491208755-629.981491208755
10912820.79364467954991.2063553204512
11101651.132790489304-550.132790489304
12102673.770201771466-571.770201771466
13970788.68729351898181.31270648102
14985682.049467553252302.950532446748
15958865.68329858833492.3167014116655
16860939.317016013865-79.3170160138652
17936831.455340813285104.544659186715
188711055.27917833629-184.279178336291
19959561.193983828368397.806016171632
20941816.293768104562124.706231895438
21891953.289945945515-62.2899459455154
22871833.97672277319637.0232772268036
23971749.312745470374221.687254529626
24887852.06340449059434.9365955094056
25952779.125815998156172.874184001844
26968781.552109489621186.447890510379
27919952.181523456547-33.1815234565473
28844826.5689542321117.4310457678903
29861831.28380789677929.7161921032207
30989697.531396489493291.468603510507
31100211.616145819393-111.616145819393
32861718.59610784849142.403892151511
33929913.49112960378215.5088703962183
348571013.42734822636-156.427348226358
35961649.491986076389311.508013923611
36923861.79698276434661.2030172356539
37111398.305049407989-287.305049407989
38994774.360181968579219.639818031421
39101451.736312263537-350.736312263537
40991817.487688609385173.512311390615
418931008.4017197109-115.401719710897
42938956.222281681493-18.2222816814931
43946947.945756994411-1.94575699441064
44102418.752789000392-316.752789000392
45874827.95463765565446.0453623443457
46953634.401153110721318.598846889279
478391036.68622341773-197.686223417734
48911839.25357421668271.7464257833183
49790937.898704716838-147.898704716838
508991065.86583583595-166.865835835949
51904962.699729371848-58.6997293718483
52950863.09305745158686.9069425484144
53972848.871628812539123.128371187461
54912929.945971546506-17.9459715465057
55967528.101883833459438.898116166541
568231019.30079389803-196.300793898027
57100799.979014003808-699.979014003808
58895871.57351102469723.4264889753032
59911840.9786126921770.02138730783
60954701.565306340964252.434693659036


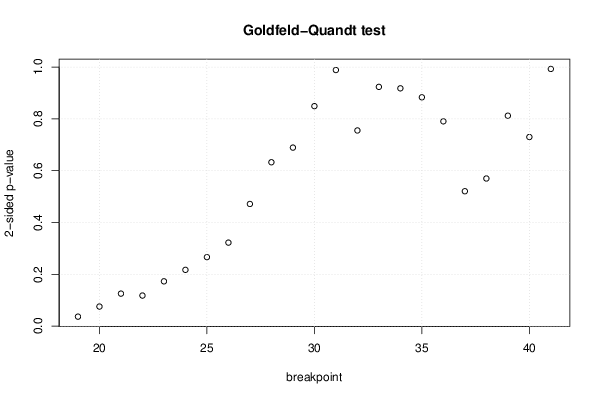
Goldfeld-Quandt test for Heteroskedasticity
p-valuesAlternative Hypothesis
breakpoint indexgreater2-sidedless
190.9816997049454620.03660059010907670.0183002950545383
200.9622343980348740.0755312039302520.037765601965126
210.9372778730323510.1254442539352980.0627221269676491
220.9409840217817880.1180319564364240.0590159782182122
230.9135296468135930.1729407063728130.0864703531864066
240.8913640099986250.217271980002750.108635990001375
250.8668088471321010.2663823057357980.133191152867899
260.8388511159875480.3222977680249040.161148884012452
270.7642447524836540.4715104950326910.235755247516346
280.6837686446517090.6324627106965820.316231355348291
290.6554647047222770.6890705905554460.344535295277723
300.5754829924751010.8490340150497970.424517007524899
310.5057693088239710.9884613823520580.494230691176029
320.6224003156355680.7551993687288640.377599684364432
330.5382801445819920.9234397108360160.461719855418008
340.4589204047158440.9178408094316890.541079595284156
350.4415896275330180.8831792550660360.558410372466982
360.395192116135070.790384232270140.60480788386493
370.7396910088822640.5206179822354720.260308991117736
380.7151078961402020.5697842077195960.284892103859798
390.59392469804350.8121506039130.4060753019565
400.6351023994944960.7297952010110070.364897600505504
410.5036914238296740.9926171523406530.496308576170326

\begin{tabular}{lllllllll}
\hline
Goldfeld-Quandt test for Heteroskedasticity \tabularnewline
p-values & Alternative Hypothesis \tabularnewline
breakpoint index & greater & 2-sided & less \tabularnewline
19 & 0.981699704945462 & 0.0366005901090767 & 0.0183002950545383 \tabularnewline
20 & 0.962234398034874 & 0.075531203930252 & 0.037765601965126 \tabularnewline
21 & 0.937277873032351 & 0.125444253935298 & 0.0627221269676491 \tabularnewline
22 & 0.940984021781788 & 0.118031956436424 & 0.0590159782182122 \tabularnewline
23 & 0.913529646813593 & 0.172940706372813 & 0.0864703531864066 \tabularnewline
24 & 0.891364009998625 & 0.21727198000275 & 0.108635990001375 \tabularnewline
25 & 0.866808847132101 & 0.266382305735798 & 0.133191152867899 \tabularnewline
26 & 0.838851115987548 & 0.322297768024904 & 0.161148884012452 \tabularnewline
27 & 0.764244752483654 & 0.471510495032691 & 0.235755247516346 \tabularnewline
28 & 0.683768644651709 & 0.632462710696582 & 0.316231355348291 \tabularnewline
29 & 0.655464704722277 & 0.689070590555446 & 0.344535295277723 \tabularnewline
30 & 0.575482992475101 & 0.849034015049797 & 0.424517007524899 \tabularnewline
31 & 0.505769308823971 & 0.988461382352058 & 0.494230691176029 \tabularnewline
32 & 0.622400315635568 & 0.755199368728864 & 0.377599684364432 \tabularnewline
33 & 0.538280144581992 & 0.923439710836016 & 0.461719855418008 \tabularnewline
34 & 0.458920404715844 & 0.917840809431689 & 0.541079595284156 \tabularnewline
35 & 0.441589627533018 & 0.883179255066036 & 0.558410372466982 \tabularnewline
36 & 0.39519211613507 & 0.79038423227014 & 0.60480788386493 \tabularnewline
37 & 0.739691008882264 & 0.520617982235472 & 0.260308991117736 \tabularnewline
38 & 0.715107896140202 & 0.569784207719596 & 0.284892103859798 \tabularnewline
39 & 0.5939246980435 & 0.812150603913 & 0.4060753019565 \tabularnewline
40 & 0.635102399494496 & 0.729795201011007 & 0.364897600505504 \tabularnewline
41 & 0.503691423829674 & 0.992617152340653 & 0.496308576170326 \tabularnewline
\hline
\end{tabular}
%Source: https://freestatistics.org/blog/index.php?pk=190661&T=5

[TABLE]
[ROW][C]Goldfeld-Quandt test for Heteroskedasticity[/C][/ROW]
[ROW][C]p-values[/C][C]Alternative Hypothesis[/C][/ROW]
[ROW][C]breakpoint index[/C][C]greater[/C][C]2-sided[/C][C]less[/C][/ROW]
[ROW][C]19[/C][C]0.981699704945462[/C][C]0.0366005901090767[/C][C]0.0183002950545383[/C][/ROW]
[ROW][C]20[/C][C]0.962234398034874[/C][C]0.075531203930252[/C][C]0.037765601965126[/C][/ROW]
[ROW][C]21[/C][C]0.937277873032351[/C][C]0.125444253935298[/C][C]0.0627221269676491[/C][/ROW]
[ROW][C]22[/C][C]0.940984021781788[/C][C]0.118031956436424[/C][C]0.0590159782182122[/C][/ROW]
[ROW][C]23[/C][C]0.913529646813593[/C][C]0.172940706372813[/C][C]0.0864703531864066[/C][/ROW]
[ROW][C]24[/C][C]0.891364009998625[/C][C]0.21727198000275[/C][C]0.108635990001375[/C][/ROW]
[ROW][C]25[/C][C]0.866808847132101[/C][C]0.266382305735798[/C][C]0.133191152867899[/C][/ROW]
[ROW][C]26[/C][C]0.838851115987548[/C][C]0.322297768024904[/C][C]0.161148884012452[/C][/ROW]
[ROW][C]27[/C][C]0.764244752483654[/C][C]0.471510495032691[/C][C]0.235755247516346[/C][/ROW]
[ROW][C]28[/C][C]0.683768644651709[/C][C]0.632462710696582[/C][C]0.316231355348291[/C][/ROW]
[ROW][C]29[/C][C]0.655464704722277[/C][C]0.689070590555446[/C][C]0.344535295277723[/C][/ROW]
[ROW][C]30[/C][C]0.575482992475101[/C][C]0.849034015049797[/C][C]0.424517007524899[/C][/ROW]
[ROW][C]31[/C][C]0.505769308823971[/C][C]0.988461382352058[/C][C]0.494230691176029[/C][/ROW]
[ROW][C]32[/C][C]0.622400315635568[/C][C]0.755199368728864[/C][C]0.377599684364432[/C][/ROW]
[ROW][C]33[/C][C]0.538280144581992[/C][C]0.923439710836016[/C][C]0.461719855418008[/C][/ROW]
[ROW][C]34[/C][C]0.458920404715844[/C][C]0.917840809431689[/C][C]0.541079595284156[/C][/ROW]
[ROW][C]35[/C][C]0.441589627533018[/C][C]0.883179255066036[/C][C]0.558410372466982[/C][/ROW]
[ROW][C]36[/C][C]0.39519211613507[/C][C]0.79038423227014[/C][C]0.60480788386493[/C][/ROW]
[ROW][C]37[/C][C]0.739691008882264[/C][C]0.520617982235472[/C][C]0.260308991117736[/C][/ROW]
[ROW][C]38[/C][C]0.715107896140202[/C][C]0.569784207719596[/C][C]0.284892103859798[/C][/ROW]
[ROW][C]39[/C][C]0.5939246980435[/C][C]0.812150603913[/C][C]0.4060753019565[/C][/ROW]
[ROW][C]40[/C][C]0.635102399494496[/C][C]0.729795201011007[/C][C]0.364897600505504[/C][/ROW]
[ROW][C]41[/C][C]0.503691423829674[/C][C]0.992617152340653[/C][C]0.496308576170326[/C][/ROW]
[/TABLE]
Source: https://freestatistics.org/blog/index.php?pk=190661&T=5

Globally Unique Identifier (entire table): ba.freestatistics.org/blog/index.php?pk=190661&T=5

As an alternative you can also use a QR Code:  

The GUIDs for individual cells are displayed in the table below:

Goldfeld-Quandt test for Heteroskedasticity
p-valuesAlternative Hypothesis
breakpoint indexgreater2-sidedless
190.9816997049454620.03660059010907670.0183002950545383
200.9622343980348740.0755312039302520.037765601965126
210.9372778730323510.1254442539352980.0627221269676491
220.9409840217817880.1180319564364240.0590159782182122
230.9135296468135930.1729407063728130.0864703531864066
240.8913640099986250.217271980002750.108635990001375
250.8668088471321010.2663823057357980.133191152867899
260.8388511159875480.3222977680249040.161148884012452
270.7642447524836540.4715104950326910.235755247516346
280.6837686446517090.6324627106965820.316231355348291
290.6554647047222770.6890705905554460.344535295277723
300.5754829924751010.8490340150497970.424517007524899
310.5057693088239710.9884613823520580.494230691176029
320.6224003156355680.7551993687288640.377599684364432
330.5382801445819920.9234397108360160.461719855418008
340.4589204047158440.9178408094316890.541079595284156
350.4415896275330180.8831792550660360.558410372466982
360.395192116135070.790384232270140.60480788386493
370.7396910088822640.5206179822354720.260308991117736
380.7151078961402020.5697842077195960.284892103859798
390.59392469804350.8121506039130.4060753019565
400.6351023994944960.7297952010110070.364897600505504
410.5036914238296740.9926171523406530.496308576170326


Meta Analysis of Goldfeld-Quandt test for Heteroskedasticity
Description# significant tests% significant testsOK/NOK
1% type I error level00OK
5% type I error level10.0434782608695652OK
10% type I error level20.0869565217391304OK

\begin{tabular}{lllllllll}
\hline
Meta Analysis of Goldfeld-Quandt test for Heteroskedasticity \tabularnewline
Description & # significant tests & % significant tests & OK/NOK \tabularnewline
1% type I error level & 0 & 0 & OK \tabularnewline
5% type I error level & 1 & 0.0434782608695652 & OK \tabularnewline
10% type I error level & 2 & 0.0869565217391304 & OK \tabularnewline
\hline
\end{tabular}
%Source: https://freestatistics.org/blog/index.php?pk=190661&T=6

[TABLE]
[ROW][C]Meta Analysis of Goldfeld-Quandt test for Heteroskedasticity[/C][/ROW]
[ROW][C]Description[/C][C]# significant tests[/C][C]% significant tests[/C][C]OK/NOK[/C][/ROW]
[ROW][C]1% type I error level[/C][C]0[/C][C]0[/C][C]OK[/C][/ROW]
[ROW][C]5% type I error level[/C][C]1[/C][C]0.0434782608695652[/C][C]OK[/C][/ROW]
[ROW][C]10% type I error level[/C][C]2[/C][C]0.0869565217391304[/C][C]OK[/C][/ROW]
[/TABLE]
Source: https://freestatistics.org/blog/index.php?pk=190661&T=6

Globally Unique Identifier (entire table): ba.freestatistics.org/blog/index.php?pk=190661&T=6

As an alternative you can also use a QR Code:  

The GUIDs for individual cells are displayed in the table below:

Meta Analysis of Goldfeld-Quandt test for Heteroskedasticity
Description# significant tests% significant testsOK/NOK
1% type I error level00OK
5% type I error level10.0434782608695652OK
10% type I error level20.0869565217391304OK


Parameters (Session):
par1 = 16 ; par2 = Do not include Seasonal Dummies ; par3 = No Linear Trend ;
Parameters (R input):
par1 = 16 ; par2 = Do not include Seasonal Dummies ; par3 = No Linear Trend ;
R code (references can be found in the software module):
library(lattice)
library(lmtest)
n25 <- 25 #minimum number of obs. for Goldfeld-Quandt test
par1 <- as.numeric(par1)
x <- t(y)
k <- length(x[1,])
n <- length(x[,1])
x1 <- cbind(x[,par1], x[,1:k!=par1])
mycolnames <- c(colnames(x)[par1], colnames(x)[1:k!=par1])
colnames(x1) <- mycolnames #colnames(x)[par1]
x <- x1
if (par3 == 'First Differences'){
x2 <- array(0, dim=c(n-1,k), dimnames=list(1:(n-1), paste('(1-B)',colnames(x),sep='')))
for (i in 1:n-1) {
for (j in 1:k) {
x2[i,j] <- x[i+1,j] - x[i,j]
}
}
x <- x2
}
if (par2 == 'Include Monthly Dummies'){
x2 <- array(0, dim=c(n,11), dimnames=list(1:n, paste('M', seq(1:11), sep ='')))
for (i in 1:11){
x2[seq(i,n,12),i] <- 1
}
x <- cbind(x, x2)
}
if (par2 == 'Include Quarterly Dummies'){
x2 <- array(0, dim=c(n,3), dimnames=list(1:n, paste('Q', seq(1:3), sep ='')))
for (i in 1:3){
x2[seq(i,n,4),i] <- 1
}
x <- cbind(x, x2)
}
k <- length(x[1,])
if (par3 == 'Linear Trend'){
x <- cbind(x, c(1:n))
colnames(x)[k+1] <- 't'
}
x
k <- length(x[1,])
df <- as.data.frame(x)
(mylm <- lm(df))
(mysum <- summary(mylm))
if (n > n25) {
kp3 <- k + 3
nmkm3 <- n - k - 3
gqarr <- array(NA, dim=c(nmkm3-kp3+1,3))
numgqtests <- 0
numsignificant1 <- 0
numsignificant5 <- 0
numsignificant10 <- 0
for (mypoint in kp3:nmkm3) {
j <- 0
numgqtests <- numgqtests + 1
for (myalt in c('greater', 'two.sided', 'less')) {
j <- j + 1
gqarr[mypoint-kp3+1,j] <- gqtest(mylm, point=mypoint, alternative=myalt)$p.value
}
if (gqarr[mypoint-kp3+1,2] < 0.01) numsignificant1 <- numsignificant1 + 1
if (gqarr[mypoint-kp3+1,2] < 0.05) numsignificant5 <- numsignificant5 + 1
if (gqarr[mypoint-kp3+1,2] < 0.10) numsignificant10 <- numsignificant10 + 1
}
gqarr
}
bitmap(file='test0.png')
plot(x[,1], type='l', main='Actuals and Interpolation', ylab='value of Actuals and Interpolation (dots)', xlab='time or index')
points(x[,1]-mysum$resid)
grid()
dev.off()
bitmap(file='test1.png')
plot(mysum$resid, type='b', pch=19, main='Residuals', ylab='value of Residuals', xlab='time or index')
grid()
dev.off()
bitmap(file='test2.png')
hist(mysum$resid, main='Residual Histogram', xlab='values of Residuals')
grid()
dev.off()
bitmap(file='test3.png')
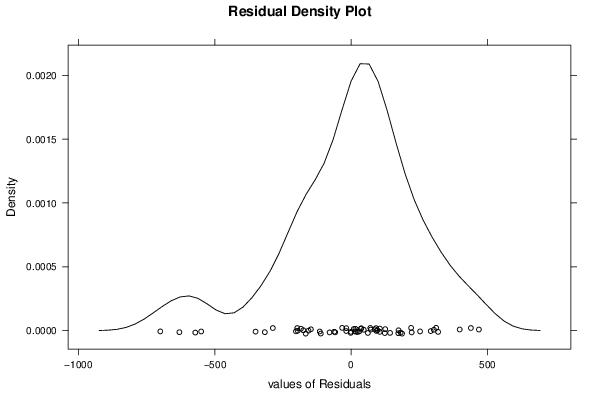
densityplot(~mysum$resid,col='black',main='Residual Density Plot', xlab='values of Residuals')
dev.off()
bitmap(file='test4.png')
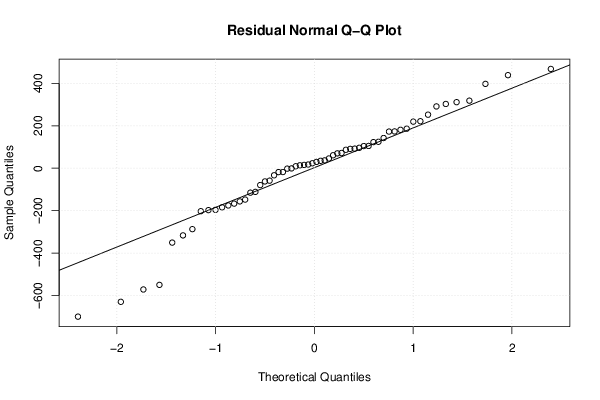
qqnorm(mysum$resid, main='Residual Normal Q-Q Plot')
qqline(mysum$resid)
grid()
dev.off()
(myerror <- as.ts(mysum$resid))
bitmap(file='test5.png')
dum <- cbind(lag(myerror,k=1),myerror)
dum
dum1 <- dum[2:length(myerror),]
dum1
z <- as.data.frame(dum1)
z
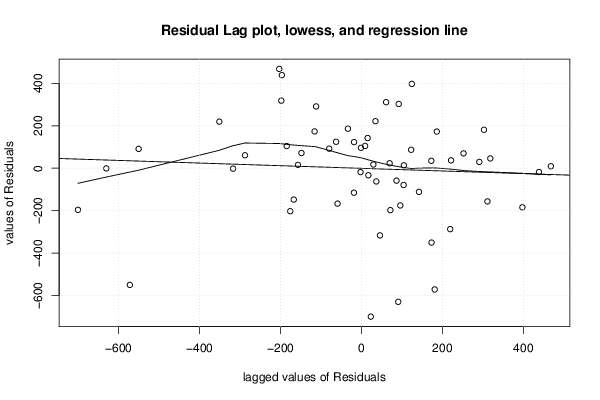
plot(z,main=paste('Residual Lag plot, lowess, and regression line'), ylab='values of Residuals', xlab='lagged values of Residuals')
lines(lowess(z))
abline(lm(z))
grid()
dev.off()
bitmap(file='test6.png')
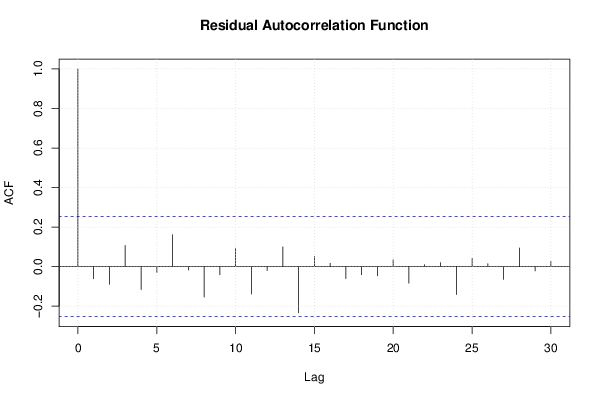
acf(mysum$resid, lag.max=length(mysum$resid)/2, main='Residual Autocorrelation Function')
grid()
dev.off()
bitmap(file='test7.png')
pacf(mysum$resid, lag.max=length(mysum$resid)/2, main='Residual Partial Autocorrelation Function')
grid()
dev.off()
bitmap(file='test8.png')
opar <- par(mfrow = c(2,2), oma = c(0, 0, 1.1, 0))
plot(mylm, las = 1, sub='Residual Diagnostics')
par(opar)
dev.off()
if (n > n25) {
bitmap(file='test9.png')
plot(kp3:nmkm3,gqarr[,2], main='Goldfeld-Quandt test',ylab='2-sided p-value',xlab='breakpoint')
grid()
dev.off()
}
load(file='createtable')
a<-table.start()
a<-table.row.start(a)
a<-table.element(a, 'Multiple Linear Regression - Estimated Regression Equation', 1, TRUE)
a<-table.row.end(a)
myeq <- colnames(x)[1]
myeq <- paste(myeq, '[t] = ', sep='')
for (i in 1:k){
if (mysum$coefficients[i,1] > 0) myeq <- paste(myeq, '+', '')
myeq <- paste(myeq, mysum$coefficients[i,1], sep=' ')
if (rownames(mysum$coefficients)[i] != '(Intercept)') {
myeq <- paste(myeq, rownames(mysum$coefficients)[i], sep='')
if (rownames(mysum$coefficients)[i] != 't') myeq <- paste(myeq, '[t]', sep='')
}
}
myeq <- paste(myeq, ' + e[t]')
a<-table.row.start(a)
a<-table.element(a, myeq)
a<-table.row.end(a)
a<-table.end(a)
table.save(a,file='mytable1.tab')
a<-table.start()
a<-table.row.start(a)
a<-table.element(a,hyperlink('ols1.htm','Multiple Linear Regression - Ordinary Least Squares',''), 6, TRUE)
a<-table.row.end(a)
a<-table.row.start(a)
a<-table.element(a,'Variable',header=TRUE)
a<-table.element(a,'Parameter',header=TRUE)
a<-table.element(a,'S.D.',header=TRUE)
a<-table.element(a,'T-STAT
H0: parameter = 0',header=TRUE)
a<-table.element(a,'2-tail p-value',header=TRUE)
a<-table.element(a,'1-tail p-value',header=TRUE)
a<-table.row.end(a)
for (i in 1:k){
a<-table.row.start(a)
a<-table.element(a,rownames(mysum$coefficients)[i],header=TRUE)
a<-table.element(a,mysum$coefficients[i,1])
a<-table.element(a, round(mysum$coefficients[i,2],6))
a<-table.element(a, round(mysum$coefficients[i,3],4))
a<-table.element(a, round(mysum$coefficients[i,4],6))
a<-table.element(a, round(mysum$coefficients[i,4]/2,6))
a<-table.row.end(a)
}
a<-table.end(a)
table.save(a,file='mytable2.tab')
a<-table.start()
a<-table.row.start(a)
a<-table.element(a, 'Multiple Linear Regression - Regression Statistics', 2, TRUE)
a<-table.row.end(a)
a<-table.row.start(a)
a<-table.element(a, 'Multiple R',1,TRUE)
a<-table.element(a, sqrt(mysum$r.squared))
a<-table.row.end(a)
a<-table.row.start(a)
a<-table.element(a, 'R-squared',1,TRUE)
a<-table.element(a, mysum$r.squared)
a<-table.row.end(a)
a<-table.row.start(a)
a<-table.element(a, 'Adjusted R-squared',1,TRUE)
a<-table.element(a, mysum$adj.r.squared)
a<-table.row.end(a)
a<-table.row.start(a)
a<-table.element(a, 'F-TEST (value)',1,TRUE)
a<-table.element(a, mysum$fstatistic[1])
a<-table.row.end(a)
a<-table.row.start(a)
a<-table.element(a, 'F-TEST (DF numerator)',1,TRUE)
a<-table.element(a, mysum$fstatistic[2])
a<-table.row.end(a)
a<-table.row.start(a)
a<-table.element(a, 'F-TEST (DF denominator)',1,TRUE)
a<-table.element(a, mysum$fstatistic[3])
a<-table.row.end(a)
a<-table.row.start(a)
a<-table.element(a, 'p-value',1,TRUE)
a<-table.element(a, 1-pf(mysum$fstatistic[1],mysum$fstatistic[2],mysum$fstatistic[3]))
a<-table.row.end(a)
a<-table.row.start(a)
a<-table.element(a, 'Multiple Linear Regression - Residual Statistics', 2, TRUE)
a<-table.row.end(a)
a<-table.row.start(a)
a<-table.element(a, 'Residual Standard Deviation',1,TRUE)
a<-table.element(a, mysum$sigma)
a<-table.row.end(a)
a<-table.row.start(a)
a<-table.element(a, 'Sum Squared Residuals',1,TRUE)
a<-table.element(a, sum(myerror*myerror))
a<-table.row.end(a)
a<-table.end(a)
table.save(a,file='mytable3.tab')
a<-table.start()
a<-table.row.start(a)
a<-table.element(a, 'Multiple Linear Regression - Actuals, Interpolation, and Residuals', 4, TRUE)
a<-table.row.end(a)
a<-table.row.start(a)
a<-table.element(a, 'Time or Index', 1, TRUE)
a<-table.element(a, 'Actuals', 1, TRUE)
a<-table.element(a, 'Interpolation
Forecast', 1, TRUE)
a<-table.element(a, 'Residuals
Prediction Error', 1, TRUE)
a<-table.row.end(a)
for (i in 1:n) {
a<-table.row.start(a)
a<-table.element(a,i, 1, TRUE)
a<-table.element(a,x[i])
a<-table.element(a,x[i]-mysum$resid[i])
a<-table.element(a,mysum$resid[i])
a<-table.row.end(a)
}
a<-table.end(a)
table.save(a,file='mytable4.tab')
if (n > n25) {
a<-table.start()
a<-table.row.start(a)
a<-table.element(a,'Goldfeld-Quandt test for Heteroskedasticity',4,TRUE)
a<-table.row.end(a)
a<-table.row.start(a)
a<-table.element(a,'p-values',header=TRUE)
a<-table.element(a,'Alternative Hypothesis',3,header=TRUE)
a<-table.row.end(a)
a<-table.row.start(a)
a<-table.element(a,'breakpoint index',header=TRUE)
a<-table.element(a,'greater',header=TRUE)
a<-table.element(a,'2-sided',header=TRUE)
a<-table.element(a,'less',header=TRUE)
a<-table.row.end(a)
for (mypoint in kp3:nmkm3) {
a<-table.row.start(a)
a<-table.element(a,mypoint,header=TRUE)
a<-table.element(a,gqarr[mypoint-kp3+1,1])
a<-table.element(a,gqarr[mypoint-kp3+1,2])
a<-table.element(a,gqarr[mypoint-kp3+1,3])
a<-table.row.end(a)
}
a<-table.end(a)
table.save(a,file='mytable5.tab')
a<-table.start()
a<-table.row.start(a)
a<-table.element(a,'Meta Analysis of Goldfeld-Quandt test for Heteroskedasticity',4,TRUE)
a<-table.row.end(a)
a<-table.row.start(a)
a<-table.element(a,'Description',header=TRUE)
a<-table.element(a,'# significant tests',header=TRUE)
a<-table.element(a,'% significant tests',header=TRUE)
a<-table.element(a,'OK/NOK',header=TRUE)
a<-table.row.end(a)
a<-table.row.start(a)
a<-table.element(a,'1% type I error level',header=TRUE)
a<-table.element(a,numsignificant1)
a<-table.element(a,numsignificant1/numgqtests)
if (numsignificant1/numgqtests < 0.01) dum <- 'OK' else dum <- 'NOK'
a<-table.element(a,dum)
a<-table.row.end(a)
a<-table.row.start(a)
a<-table.element(a,'5% type I error level',header=TRUE)
a<-table.element(a,numsignificant5)
a<-table.element(a,numsignificant5/numgqtests)
if (numsignificant5/numgqtests < 0.05) dum <- 'OK' else dum <- 'NOK'
a<-table.element(a,dum)
a<-table.row.end(a)
a<-table.row.start(a)
a<-table.element(a,'10% type I error level',header=TRUE)
a<-table.element(a,numsignificant10)
a<-table.element(a,numsignificant10/numgqtests)
if (numsignificant10/numgqtests < 0.1) dum <- 'OK' else dum <- 'NOK'
a<-table.element(a,dum)
a<-table.row.end(a)
a<-table.end(a)
table.save(a,file='mytable6.tab')
}