Free Statistics

of Irreproducible Research!

Author's title

Author*The author of this computation has been verified*
R Software Modulerwasp_autocorrelation.wasp
Title produced by software(Partial) Autocorrelation Function
Date of computationTue, 20 Nov 2012 11:53:29 -0500
Cite this page as followsStatistical Computations at FreeStatistics.org, Office for Research Development and Education, URL https://freestatistics.org/blog/index.php?v=date/2012/Nov/20/t13534304402lwofpv5ya6ldop.htm/, Retrieved Mon, 29 Apr 2024 21:54:51 +0000
Statistical Computations at FreeStatistics.org, Office for Research Development and Education, URL https://freestatistics.org/blog/index.php?pk=191177, Retrieved Mon, 29 Apr 2024 21:54:51 +0000
QR Codes:

Original text written by user:
IsPrivate?No (this computation is public)
User-defined keywords
Estimated Impact60
Family? (F = Feedback message, R = changed R code, M = changed R Module, P = changed Parameters, D = changed Data)
-       [(Partial) Autocorrelation Function] [WS 9 ACF 1] [2012-11-20 16:53:29] [851af2766980873020febd248b5479af] [Current]
Feedback Forum

Post a new message
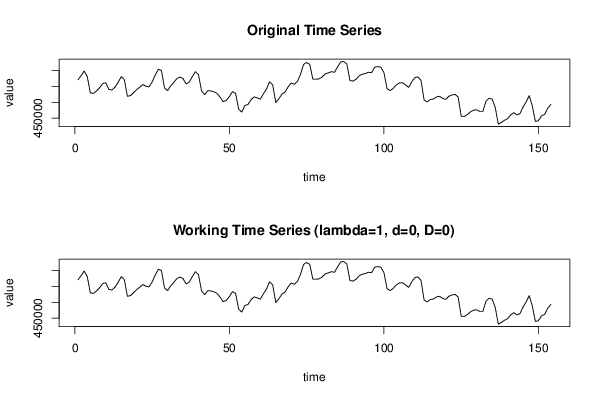
Dataseries X:
571000
584000
599000
582000
530000
528000
536000
546000
559000
562000
541000
539000
548000
563000
581000
572000
519000
521000
531000
540000
548000
556000
551000
549000
564000
586000
604000
601000
545000
537000
552000
563000
575000
580000
575000
558000
564000
581000
597000
587000
536000
524000
537000
536000
533000
528000
516000
502000
506000
518000
534000
528000
478000
469000
490000
493000
508000
517000
514000
510000
527000
542000
565000
555000
499000
511000
526000
532000
549000
561000
557000
566000
588000
620000
626000
620000
573000
573000
574000
580000
590000
593000
597000
595000
612000
628000
629000
621000
569000
567000
573000
584000
589000
591000
595000
594000
611000
613000
611000
594000
543000
537000
544000
555000
561000
562000
555000
547000
565000
578000
580000
569000
507000
501000
509000
510000
517000
519000
512000
509000
519000
523000
525000
517000
456000
455000
461000
470000
475000
476000
471000
471000
503000
513000
510000
484000
431000
436000
443000
448000
460000
467000
460000
464000
485000
501000
521000
488000
439000
442000
457000
462000
481000
493000


Summary of computational transaction
Raw Inputview raw input (R code)
Raw Outputview raw output of R engine
Computing time3 seconds
R Server'Sir Maurice George Kendall' @ kendall.wessa.net

\begin{tabular}{lllllllll}
\hline
Summary of computational transaction \tabularnewline
Raw Input & view raw input (R code)  \tabularnewline
Raw Output & view raw output of R engine  \tabularnewline
Computing time & 3 seconds \tabularnewline
R Server & 'Sir Maurice George Kendall' @ kendall.wessa.net \tabularnewline
\hline
\end{tabular}
%Source: https://freestatistics.org/blog/index.php?pk=191177&T=0

[TABLE]
[ROW][C]Summary of computational transaction[/C][/ROW]
[ROW][C]Raw Input[/C][C]view raw input (R code) [/C][/ROW]
[ROW][C]Raw Output[/C][C]view raw output of R engine [/C][/ROW]
[ROW][C]Computing time[/C][C]3 seconds[/C][/ROW]
[ROW][C]R Server[/C][C]'Sir Maurice George Kendall' @ kendall.wessa.net[/C][/ROW]
[/TABLE]
Source: https://freestatistics.org/blog/index.php?pk=191177&T=0

Globally Unique Identifier (entire table): ba.freestatistics.org/blog/index.php?pk=191177&T=0

As an alternative you can also use a QR Code:  

The GUIDs for individual cells are displayed in the table below:

Summary of computational transaction
Raw Inputview raw input (R code)
Raw Outputview raw output of R engine
Computing time3 seconds
R Server'Sir Maurice George Kendall' @ kendall.wessa.net


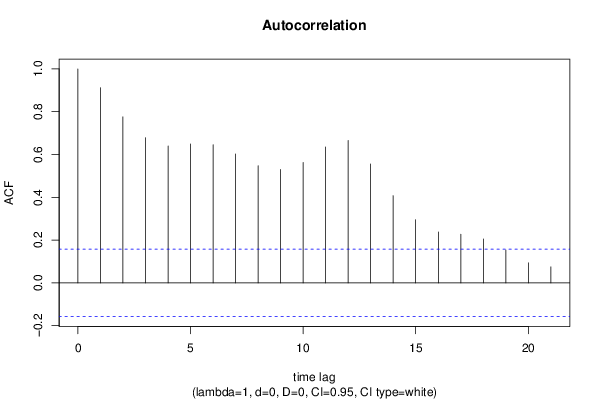
Autocorrelation Function
Time lag kACF(k)T-STATP-value
10.91225711.32080
20.7758769.62840
30.6786778.42220
40.6400497.94280
50.6491668.05590
60.6456138.01180
70.6024217.47590
80.5475646.79510
90.5302476.58020
100.5629766.98640
110.6351867.88240
120.6653878.25720
130.5560566.90050
140.4077185.05961e-06
150.2953093.66470.00017
160.2380122.95370.001817
170.2269512.81640.002746
180.2049932.54390.005974
190.1535421.90540.029296
200.0934931.16020.123879
210.0748360.92870.177251

\begin{tabular}{lllllllll}
\hline
Autocorrelation Function \tabularnewline
Time lag k & ACF(k) & T-STAT & P-value \tabularnewline
1 & 0.912257 & 11.3208 & 0 \tabularnewline
2 & 0.775876 & 9.6284 & 0 \tabularnewline
3 & 0.678677 & 8.4222 & 0 \tabularnewline
4 & 0.640049 & 7.9428 & 0 \tabularnewline
5 & 0.649166 & 8.0559 & 0 \tabularnewline
6 & 0.645613 & 8.0118 & 0 \tabularnewline
7 & 0.602421 & 7.4759 & 0 \tabularnewline
8 & 0.547564 & 6.7951 & 0 \tabularnewline
9 & 0.530247 & 6.5802 & 0 \tabularnewline
10 & 0.562976 & 6.9864 & 0 \tabularnewline
11 & 0.635186 & 7.8824 & 0 \tabularnewline
12 & 0.665387 & 8.2572 & 0 \tabularnewline
13 & 0.556056 & 6.9005 & 0 \tabularnewline
14 & 0.407718 & 5.0596 & 1e-06 \tabularnewline
15 & 0.295309 & 3.6647 & 0.00017 \tabularnewline
16 & 0.238012 & 2.9537 & 0.001817 \tabularnewline
17 & 0.226951 & 2.8164 & 0.002746 \tabularnewline
18 & 0.204993 & 2.5439 & 0.005974 \tabularnewline
19 & 0.153542 & 1.9054 & 0.029296 \tabularnewline
20 & 0.093493 & 1.1602 & 0.123879 \tabularnewline
21 & 0.074836 & 0.9287 & 0.177251 \tabularnewline
\hline
\end{tabular}
%Source: https://freestatistics.org/blog/index.php?pk=191177&T=1

[TABLE]
[ROW][C]Autocorrelation Function[/C][/ROW]
[ROW][C]Time lag k[/C][C]ACF(k)[/C][C]T-STAT[/C][C]P-value[/C][/ROW]
[ROW][C]1[/C][C]0.912257[/C][C]11.3208[/C][C]0[/C][/ROW]
[ROW][C]2[/C][C]0.775876[/C][C]9.6284[/C][C]0[/C][/ROW]
[ROW][C]3[/C][C]0.678677[/C][C]8.4222[/C][C]0[/C][/ROW]
[ROW][C]4[/C][C]0.640049[/C][C]7.9428[/C][C]0[/C][/ROW]
[ROW][C]5[/C][C]0.649166[/C][C]8.0559[/C][C]0[/C][/ROW]
[ROW][C]6[/C][C]0.645613[/C][C]8.0118[/C][C]0[/C][/ROW]
[ROW][C]7[/C][C]0.602421[/C][C]7.4759[/C][C]0[/C][/ROW]
[ROW][C]8[/C][C]0.547564[/C][C]6.7951[/C][C]0[/C][/ROW]
[ROW][C]9[/C][C]0.530247[/C][C]6.5802[/C][C]0[/C][/ROW]
[ROW][C]10[/C][C]0.562976[/C][C]6.9864[/C][C]0[/C][/ROW]
[ROW][C]11[/C][C]0.635186[/C][C]7.8824[/C][C]0[/C][/ROW]
[ROW][C]12[/C][C]0.665387[/C][C]8.2572[/C][C]0[/C][/ROW]
[ROW][C]13[/C][C]0.556056[/C][C]6.9005[/C][C]0[/C][/ROW]
[ROW][C]14[/C][C]0.407718[/C][C]5.0596[/C][C]1e-06[/C][/ROW]
[ROW][C]15[/C][C]0.295309[/C][C]3.6647[/C][C]0.00017[/C][/ROW]
[ROW][C]16[/C][C]0.238012[/C][C]2.9537[/C][C]0.001817[/C][/ROW]
[ROW][C]17[/C][C]0.226951[/C][C]2.8164[/C][C]0.002746[/C][/ROW]
[ROW][C]18[/C][C]0.204993[/C][C]2.5439[/C][C]0.005974[/C][/ROW]
[ROW][C]19[/C][C]0.153542[/C][C]1.9054[/C][C]0.029296[/C][/ROW]
[ROW][C]20[/C][C]0.093493[/C][C]1.1602[/C][C]0.123879[/C][/ROW]
[ROW][C]21[/C][C]0.074836[/C][C]0.9287[/C][C]0.177251[/C][/ROW]
[/TABLE]
Source: https://freestatistics.org/blog/index.php?pk=191177&T=1

Globally Unique Identifier (entire table): ba.freestatistics.org/blog/index.php?pk=191177&T=1

As an alternative you can also use a QR Code:  

The GUIDs for individual cells are displayed in the table below:

Autocorrelation Function
Time lag kACF(k)T-STATP-value
10.91225711.32080
20.7758769.62840
30.6786778.42220
40.6400497.94280
50.6491668.05590
60.6456138.01180
70.6024217.47590
80.5475646.79510
90.5302476.58020
100.5629766.98640
110.6351867.88240
120.6653878.25720
130.5560566.90050
140.4077185.05961e-06
150.2953093.66470.00017
160.2380122.95370.001817
170.2269512.81640.002746
180.2049932.54390.005974
190.1535421.90540.029296
200.0934931.16020.123879
210.0748360.92870.177251


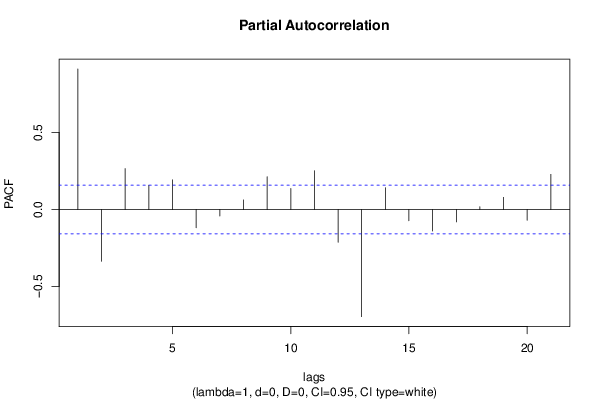
Partial Autocorrelation Function
Time lag kPACF(k)T-STATP-value
10.91225711.32080
2-0.335764-4.16672.6e-05
30.2655183.2950.000611
40.1579791.96050.025873
50.192322.38660.009109
6-0.118315-1.46820.072038
7-0.041722-0.51780.302686
80.0623420.77360.220165
90.2128062.64090.004561
100.1362371.69070.046463
110.2518533.12540.001061
12-0.21237-2.63540.004631
13-0.695365-8.62930
140.1410911.75090.040978
15-0.072875-0.90440.183611
16-0.139229-1.72780.043016
17-0.080476-0.99870.159759
180.0177080.21980.413178
190.0789980.98030.164229
20-0.070015-0.86890.193137
210.2281562.83130.002627

\begin{tabular}{lllllllll}
\hline
Partial Autocorrelation Function \tabularnewline
Time lag k & PACF(k) & T-STAT & P-value \tabularnewline
1 & 0.912257 & 11.3208 & 0 \tabularnewline
2 & -0.335764 & -4.1667 & 2.6e-05 \tabularnewline
3 & 0.265518 & 3.295 & 0.000611 \tabularnewline
4 & 0.157979 & 1.9605 & 0.025873 \tabularnewline
5 & 0.19232 & 2.3866 & 0.009109 \tabularnewline
6 & -0.118315 & -1.4682 & 0.072038 \tabularnewline
7 & -0.041722 & -0.5178 & 0.302686 \tabularnewline
8 & 0.062342 & 0.7736 & 0.220165 \tabularnewline
9 & 0.212806 & 2.6409 & 0.004561 \tabularnewline
10 & 0.136237 & 1.6907 & 0.046463 \tabularnewline
11 & 0.251853 & 3.1254 & 0.001061 \tabularnewline
12 & -0.21237 & -2.6354 & 0.004631 \tabularnewline
13 & -0.695365 & -8.6293 & 0 \tabularnewline
14 & 0.141091 & 1.7509 & 0.040978 \tabularnewline
15 & -0.072875 & -0.9044 & 0.183611 \tabularnewline
16 & -0.139229 & -1.7278 & 0.043016 \tabularnewline
17 & -0.080476 & -0.9987 & 0.159759 \tabularnewline
18 & 0.017708 & 0.2198 & 0.413178 \tabularnewline
19 & 0.078998 & 0.9803 & 0.164229 \tabularnewline
20 & -0.070015 & -0.8689 & 0.193137 \tabularnewline
21 & 0.228156 & 2.8313 & 0.002627 \tabularnewline
\hline
\end{tabular}
%Source: https://freestatistics.org/blog/index.php?pk=191177&T=2

[TABLE]
[ROW][C]Partial Autocorrelation Function[/C][/ROW]
[ROW][C]Time lag k[/C][C]PACF(k)[/C][C]T-STAT[/C][C]P-value[/C][/ROW]
[ROW][C]1[/C][C]0.912257[/C][C]11.3208[/C][C]0[/C][/ROW]
[ROW][C]2[/C][C]-0.335764[/C][C]-4.1667[/C][C]2.6e-05[/C][/ROW]
[ROW][C]3[/C][C]0.265518[/C][C]3.295[/C][C]0.000611[/C][/ROW]
[ROW][C]4[/C][C]0.157979[/C][C]1.9605[/C][C]0.025873[/C][/ROW]
[ROW][C]5[/C][C]0.19232[/C][C]2.3866[/C][C]0.009109[/C][/ROW]
[ROW][C]6[/C][C]-0.118315[/C][C]-1.4682[/C][C]0.072038[/C][/ROW]
[ROW][C]7[/C][C]-0.041722[/C][C]-0.5178[/C][C]0.302686[/C][/ROW]
[ROW][C]8[/C][C]0.062342[/C][C]0.7736[/C][C]0.220165[/C][/ROW]
[ROW][C]9[/C][C]0.212806[/C][C]2.6409[/C][C]0.004561[/C][/ROW]
[ROW][C]10[/C][C]0.136237[/C][C]1.6907[/C][C]0.046463[/C][/ROW]
[ROW][C]11[/C][C]0.251853[/C][C]3.1254[/C][C]0.001061[/C][/ROW]
[ROW][C]12[/C][C]-0.21237[/C][C]-2.6354[/C][C]0.004631[/C][/ROW]
[ROW][C]13[/C][C]-0.695365[/C][C]-8.6293[/C][C]0[/C][/ROW]
[ROW][C]14[/C][C]0.141091[/C][C]1.7509[/C][C]0.040978[/C][/ROW]
[ROW][C]15[/C][C]-0.072875[/C][C]-0.9044[/C][C]0.183611[/C][/ROW]
[ROW][C]16[/C][C]-0.139229[/C][C]-1.7278[/C][C]0.043016[/C][/ROW]
[ROW][C]17[/C][C]-0.080476[/C][C]-0.9987[/C][C]0.159759[/C][/ROW]
[ROW][C]18[/C][C]0.017708[/C][C]0.2198[/C][C]0.413178[/C][/ROW]
[ROW][C]19[/C][C]0.078998[/C][C]0.9803[/C][C]0.164229[/C][/ROW]
[ROW][C]20[/C][C]-0.070015[/C][C]-0.8689[/C][C]0.193137[/C][/ROW]
[ROW][C]21[/C][C]0.228156[/C][C]2.8313[/C][C]0.002627[/C][/ROW]
[/TABLE]
Source: https://freestatistics.org/blog/index.php?pk=191177&T=2

Globally Unique Identifier (entire table): ba.freestatistics.org/blog/index.php?pk=191177&T=2

As an alternative you can also use a QR Code:  

The GUIDs for individual cells are displayed in the table below:

Partial Autocorrelation Function
Time lag kPACF(k)T-STATP-value
10.91225711.32080
2-0.335764-4.16672.6e-05
30.2655183.2950.000611
40.1579791.96050.025873
50.192322.38660.009109
6-0.118315-1.46820.072038
7-0.041722-0.51780.302686
80.0623420.77360.220165
90.2128062.64090.004561
100.1362371.69070.046463
110.2518533.12540.001061
12-0.21237-2.63540.004631
13-0.695365-8.62930
140.1410911.75090.040978
15-0.072875-0.90440.183611
16-0.139229-1.72780.043016
17-0.080476-0.99870.159759
180.0177080.21980.413178
190.0789980.98030.164229
20-0.070015-0.86890.193137
210.2281562.83130.002627


Parameters (Session):
par1 = Default ; par2 = 1 ; par3 = 0 ; par4 = 0 ; par5 = 12 ; par6 = White Noise ; par7 = 0.95 ;
Parameters (R input):
par1 = Default ; par2 = 1 ; par3 = 0 ; par4 = 0 ; par5 = 12 ; par6 = White Noise ; par7 = 0.95 ; par8 = ;
R code (references can be found in the software module):
if (par1 == 'Default') {
par1 = 10*log10(length(x))
} else {
par1 <- as.numeric(par1)
}
par2 <- as.numeric(par2)
par3 <- as.numeric(par3)
par4 <- as.numeric(par4)
par5 <- as.numeric(par5)
if (par6 == 'White Noise') par6 <- 'white' else par6 <- 'ma'
par7 <- as.numeric(par7)
if (par8 != '') par8 <- as.numeric(par8)
ox <- x
if (par8 == '') {
if (par2 == 0) {
x <- log(x)
} else {
x <- (x ^ par2 - 1) / par2
}
} else {
x <- log(x,base=par8)
}
if (par3 > 0) x <- diff(x,lag=1,difference=par3)
if (par4 > 0) x <- diff(x,lag=par5,difference=par4)
bitmap(file='picts.png')
op <- par(mfrow=c(2,1))
plot(ox,type='l',main='Original Time Series',xlab='time',ylab='value')
if (par8=='') {
mytitle <- paste('Working Time Series (lambda=',par2,', d=',par3,', D=',par4,')',sep='')
mysub <- paste('(lambda=',par2,', d=',par3,', D=',par4,', CI=', par7, ', CI type=',par6,')',sep='')
} else {
mytitle <- paste('Working Time Series (base=',par8,', d=',par3,', D=',par4,')',sep='')
mysub <- paste('(base=',par8,', d=',par3,', D=',par4,', CI=', par7, ', CI type=',par6,')',sep='')
}
plot(x,type='l', main=mytitle,xlab='time',ylab='value')
par(op)
dev.off()
bitmap(file='pic1.png')
racf <- acf(x, par1, main='Autocorrelation', xlab='time lag', ylab='ACF', ci.type=par6, ci=par7, sub=mysub)
dev.off()
bitmap(file='pic2.png')
rpacf <- pacf(x,par1,main='Partial Autocorrelation',xlab='lags',ylab='PACF',sub=mysub)
dev.off()
(myacf <- c(racf$acf))
(mypacf <- c(rpacf$acf))
lengthx <- length(x)
sqrtn <- sqrt(lengthx)
load(file='createtable')
a<-table.start()
a<-table.row.start(a)
a<-table.element(a,'Autocorrelation Function',4,TRUE)
a<-table.row.end(a)
a<-table.row.start(a)
a<-table.element(a,'Time lag k',header=TRUE)
a<-table.element(a,hyperlink('basics.htm','ACF(k)','click here for more information about the Autocorrelation Function'),header=TRUE)
a<-table.element(a,'T-STAT',header=TRUE)
a<-table.element(a,'P-value',header=TRUE)
a<-table.row.end(a)
for (i in 2:(par1+1)) {
a<-table.row.start(a)
a<-table.element(a,i-1,header=TRUE)
a<-table.element(a,round(myacf[i],6))
mytstat <- myacf[i]*sqrtn
a<-table.element(a,round(mytstat,4))
a<-table.element(a,round(1-pt(abs(mytstat),lengthx),6))
a<-table.row.end(a)
}
a<-table.end(a)
table.save(a,file='mytable.tab')
a<-table.start()
a<-table.row.start(a)
a<-table.element(a,'Partial Autocorrelation Function',4,TRUE)
a<-table.row.end(a)
a<-table.row.start(a)
a<-table.element(a,'Time lag k',header=TRUE)
a<-table.element(a,hyperlink('basics.htm','PACF(k)','click here for more information about the Partial Autocorrelation Function'),header=TRUE)
a<-table.element(a,'T-STAT',header=TRUE)
a<-table.element(a,'P-value',header=TRUE)
a<-table.row.end(a)
for (i in 1:par1) {
a<-table.row.start(a)
a<-table.element(a,i,header=TRUE)
a<-table.element(a,round(mypacf[i],6))
mytstat <- mypacf[i]*sqrtn
a<-table.element(a,round(mytstat,4))
a<-table.element(a,round(1-pt(abs(mytstat),lengthx),6))
a<-table.row.end(a)
}
a<-table.end(a)
table.save(a,file='mytable1.tab')