Free Statistics

of Irreproducible Research!

Author's title

Author*The author of this computation has been verified*
R Software Modulerwasp_multipleregression.wasp
Title produced by softwareMultiple Regression
Date of computationTue, 20 Nov 2012 12:16:18 -0500
Cite this page as followsStatistical Computations at FreeStatistics.org, Office for Research Development and Education, URL https://freestatistics.org/blog/index.php?v=date/2012/Nov/20/t1353431895g6mwy0pttrpo9nm.htm/, Retrieved Mon, 29 Apr 2024 23:10:29 +0000
Statistical Computations at FreeStatistics.org, Office for Research Development and Education, URL https://freestatistics.org/blog/index.php?pk=191199, Retrieved Mon, 29 Apr 2024 23:10:29 +0000
QR Codes:

Original text written by user:
IsPrivate?No (this computation is public)
User-defined keywords
Estimated Impact82
Family? (F = Feedback message, R = changed R code, M = changed R Module, P = changed Parameters, D = changed Data)
-       [Multiple Regression] [] [2012-11-20 17:16:18] [8320012c80513ed9c03312c2688c5a59] [Current]
Feedback Forum

Post a new message
Dataseries X:
73	80	75	152
93	88	93	185
89	91	90	180
96	98	100	196
73	66	70	142
53	46	55	101
69	74	77	149
47	56	60	115
87	79	90	175
79	70	88	164
69	70	73	141
70	65	74	141
93	95	91	184
79	80	73	152
70	73	78	148
93	89	96	192
78	75	68	147
81	90	93	183
88	92	86	177
78	83	77	159
82	86	90	177
86	82	89	175
78	83	85	175
76	83	71	149
96	93	95	192


Summary of computational transaction
Raw Inputview raw input (R code)
Raw Outputview raw output of R engine
Computing time7 seconds
R Server'Sir Maurice George Kendall' @ kendall.wessa.net

\begin{tabular}{lllllllll}
\hline
Summary of computational transaction \tabularnewline
Raw Input & view raw input (R code)  \tabularnewline
Raw Output & view raw output of R engine  \tabularnewline
Computing time & 7 seconds \tabularnewline
R Server & 'Sir Maurice George Kendall' @ kendall.wessa.net \tabularnewline
\hline
\end{tabular}
%Source: https://freestatistics.org/blog/index.php?pk=191199&T=0

[TABLE]
[ROW][C]Summary of computational transaction[/C][/ROW]
[ROW][C]Raw Input[/C][C]view raw input (R code) [/C][/ROW]
[ROW][C]Raw Output[/C][C]view raw output of R engine [/C][/ROW]
[ROW][C]Computing time[/C][C]7 seconds[/C][/ROW]
[ROW][C]R Server[/C][C]'Sir Maurice George Kendall' @ kendall.wessa.net[/C][/ROW]
[/TABLE]
Source: https://freestatistics.org/blog/index.php?pk=191199&T=0

Globally Unique Identifier (entire table): ba.freestatistics.org/blog/index.php?pk=191199&T=0

As an alternative you can also use a QR Code:  

The GUIDs for individual cells are displayed in the table below:

Summary of computational transaction
Raw Inputview raw input (R code)
Raw Outputview raw output of R engine
Computing time7 seconds
R Server'Sir Maurice George Kendall' @ kendall.wessa.net


Multiple Linear Regression - Estimated Regression Equation
FINAL[t] = -4.33610240124024 + 0.355938218661821EXAM1[t] + 0.542518757618704EXAM2[t] + 1.16744421628222EXAM3[t] + e[t]

\begin{tabular}{lllllllll}
\hline
Multiple Linear Regression - Estimated Regression Equation \tabularnewline
FINAL[t] =  -4.33610240124024 +  0.355938218661821EXAM1[t] +  0.542518757618704EXAM2[t] +  1.16744421628222EXAM3[t]  + e[t] \tabularnewline
\hline
\end{tabular}
%Source: https://freestatistics.org/blog/index.php?pk=191199&T=1

[TABLE]
[ROW][C]Multiple Linear Regression - Estimated Regression Equation[/C][/ROW]
[ROW][C]FINAL[t] =  -4.33610240124024 +  0.355938218661821EXAM1[t] +  0.542518757618704EXAM2[t] +  1.16744421628222EXAM3[t]  + e[t][/C][/ROW]
[/TABLE]
Source: https://freestatistics.org/blog/index.php?pk=191199&T=1

Globally Unique Identifier (entire table): ba.freestatistics.org/blog/index.php?pk=191199&T=1

As an alternative you can also use a QR Code:  

The GUIDs for individual cells are displayed in the table below:

Multiple Linear Regression - Estimated Regression Equation
FINAL[t] = -4.33610240124024 + 0.355938218661821EXAM1[t] + 0.542518757618704EXAM2[t] + 1.16744421628222EXAM3[t] + e[t]


Multiple Linear Regression - Ordinary Least Squares
VariableParameterS.D.T-STATH0: parameter = 02-tail p-value1-tail p-value
(Intercept)-4.336102401240243.764226-1.15190.2622980.131149
EXAM10.3559382186618210.1213892.93220.0079610.003981
EXAM20.5425187576187040.1008495.37952.5e-051.2e-05
EXAM31.167444216282220.10301411.332900

\begin{tabular}{lllllllll}
\hline
Multiple Linear Regression - Ordinary Least Squares \tabularnewline
Variable & Parameter & S.D. & T-STATH0: parameter = 0 & 2-tail p-value & 1-tail p-value \tabularnewline
(Intercept) & -4.33610240124024 & 3.764226 & -1.1519 & 0.262298 & 0.131149 \tabularnewline
EXAM1 & 0.355938218661821 & 0.121389 & 2.9322 & 0.007961 & 0.003981 \tabularnewline
EXAM2 & 0.542518757618704 & 0.100849 & 5.3795 & 2.5e-05 & 1.2e-05 \tabularnewline
EXAM3 & 1.16744421628222 & 0.103014 & 11.3329 & 0 & 0 \tabularnewline
\hline
\end{tabular}
%Source: https://freestatistics.org/blog/index.php?pk=191199&T=2

[TABLE]
[ROW][C]Multiple Linear Regression - Ordinary Least Squares[/C][/ROW]
[ROW][C]Variable[/C][C]Parameter[/C][C]S.D.[/C][C]T-STATH0: parameter = 0[/C][C]2-tail p-value[/C][C]1-tail p-value[/C][/ROW]
[ROW][C](Intercept)[/C][C]-4.33610240124024[/C][C]3.764226[/C][C]-1.1519[/C][C]0.262298[/C][C]0.131149[/C][/ROW]
[ROW][C]EXAM1[/C][C]0.355938218661821[/C][C]0.121389[/C][C]2.9322[/C][C]0.007961[/C][C]0.003981[/C][/ROW]
[ROW][C]EXAM2[/C][C]0.542518757618704[/C][C]0.100849[/C][C]5.3795[/C][C]2.5e-05[/C][C]1.2e-05[/C][/ROW]
[ROW][C]EXAM3[/C][C]1.16744421628222[/C][C]0.103014[/C][C]11.3329[/C][C]0[/C][C]0[/C][/ROW]
[/TABLE]
Source: https://freestatistics.org/blog/index.php?pk=191199&T=2

Globally Unique Identifier (entire table): ba.freestatistics.org/blog/index.php?pk=191199&T=2

As an alternative you can also use a QR Code:  

The GUIDs for individual cells are displayed in the table below:

Multiple Linear Regression - Ordinary Least Squares
VariableParameterS.D.T-STATH0: parameter = 02-tail p-value1-tail p-value
(Intercept)-4.336102401240243.764226-1.15190.2622980.131149
EXAM10.3559382186618210.1213892.93220.0079610.003981
EXAM20.5425187576187040.1008495.37952.5e-051.2e-05
EXAM31.167444216282220.10301411.332900


Multiple Linear Regression - Regression Statistics
Multiple R0.994817359591619
R-squared0.98966157894484
Adjusted R-squared0.988184661651246
F-TEST (value)670.085984663602
F-TEST (DF numerator)3
F-TEST (DF denominator)21
p-value0
Multiple Linear Regression - Residual Statistics
Residual Standard Deviation2.61356514949275
Sum Squared Residuals143.445178603504

\begin{tabular}{lllllllll}
\hline
Multiple Linear Regression - Regression Statistics \tabularnewline
Multiple R & 0.994817359591619 \tabularnewline
R-squared & 0.98966157894484 \tabularnewline
Adjusted R-squared & 0.988184661651246 \tabularnewline
F-TEST (value) & 670.085984663602 \tabularnewline
F-TEST (DF numerator) & 3 \tabularnewline
F-TEST (DF denominator) & 21 \tabularnewline
p-value & 0 \tabularnewline
Multiple Linear Regression - Residual Statistics \tabularnewline
Residual Standard Deviation & 2.61356514949275 \tabularnewline
Sum Squared Residuals & 143.445178603504 \tabularnewline
\hline
\end{tabular}
%Source: https://freestatistics.org/blog/index.php?pk=191199&T=3

[TABLE]
[ROW][C]Multiple Linear Regression - Regression Statistics[/C][/ROW]
[ROW][C]Multiple R[/C][C]0.994817359591619[/C][/ROW]
[ROW][C]R-squared[/C][C]0.98966157894484[/C][/ROW]
[ROW][C]Adjusted R-squared[/C][C]0.988184661651246[/C][/ROW]
[ROW][C]F-TEST (value)[/C][C]670.085984663602[/C][/ROW]
[ROW][C]F-TEST (DF numerator)[/C][C]3[/C][/ROW]
[ROW][C]F-TEST (DF denominator)[/C][C]21[/C][/ROW]
[ROW][C]p-value[/C][C]0[/C][/ROW]
[ROW][C]Multiple Linear Regression - Residual Statistics[/C][/ROW]
[ROW][C]Residual Standard Deviation[/C][C]2.61356514949275[/C][/ROW]
[ROW][C]Sum Squared Residuals[/C][C]143.445178603504[/C][/ROW]
[/TABLE]
Source: https://freestatistics.org/blog/index.php?pk=191199&T=3

Globally Unique Identifier (entire table): ba.freestatistics.org/blog/index.php?pk=191199&T=3

As an alternative you can also use a QR Code:  

The GUIDs for individual cells are displayed in the table below:

Multiple Linear Regression - Regression Statistics
Multiple R0.994817359591619
R-squared0.98966157894484
Adjusted R-squared0.988184661651246
F-TEST (value)670.085984663602
F-TEST (DF numerator)3
F-TEST (DF denominator)21
p-value0
Multiple Linear Regression - Residual Statistics
Residual Standard Deviation2.61356514949275
Sum Squared Residuals143.445178603504


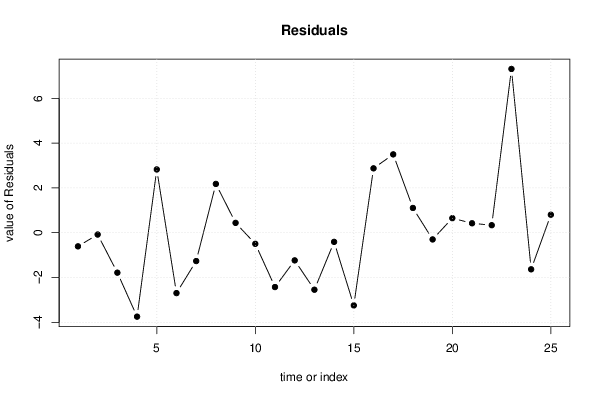
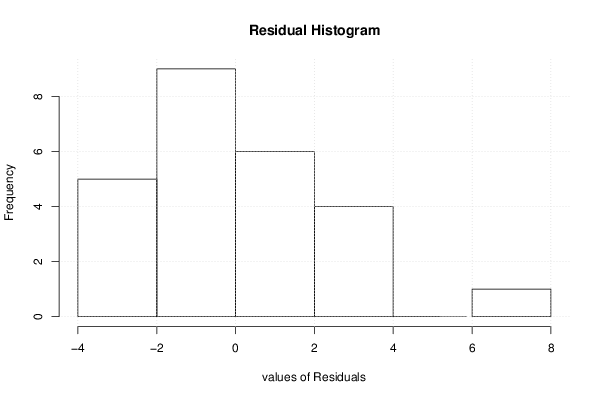
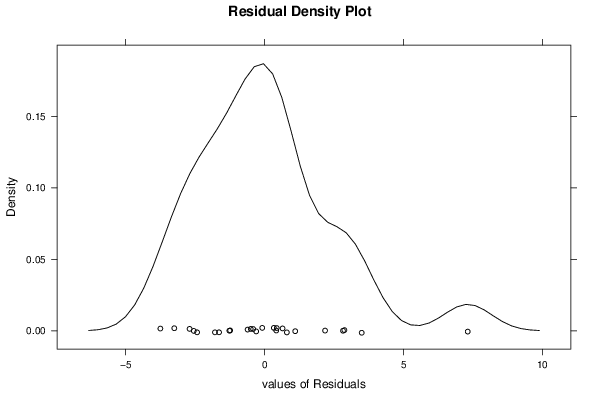
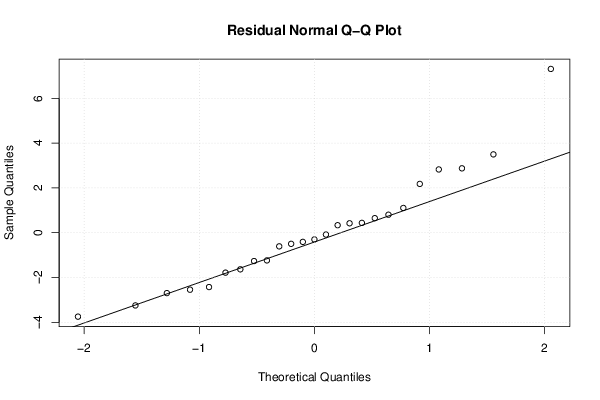
Multiple Linear Regression - Actuals, Interpolation, and Residuals
Time or IndexActualsInterpolationForecastResidualsPrediction Error
1152152.607204391736-0.607204391735592
2185185.080114719002-0.0801147190015528
3180181.781585468364-1.78158546836372
4196199.74522646515-3.7452264651496
5142139.1747207036632.82527929633742
6101103.693917933819-2.69391793381877
7149150.26322740394-1.26322740394047
8115112.8206972794462.17930272055401
9175174.5594839396160.440516060384367
10164164.494420939188-0.494420939188291
11141143.423375508337-2.42337550833677
12141142.234164155187-1.2341641551873
13184186.542857589768-2.54285758976804
14152152.407945271142-0.40794527114202
15148151.244091081266-3.24409108126581
16192189.1249661254672.87503387453308
17147143.5021921829763.49780781702442
18183181.8938936102971.10610638970288
19177177.298389142192-0.298389142191725
20159158.3493401904650.650659809534807
21177176.5774241496370.422575850362542
22175174.6636577775280.336342222472297
23175167.6888939207237.31110607927704
24149150.632798455448-1.63279845544823
25192191.1954115956450.80458840435502

\begin{tabular}{lllllllll}
\hline
Multiple Linear Regression - Actuals, Interpolation, and Residuals \tabularnewline
Time or Index & Actuals & InterpolationForecast & ResidualsPrediction Error \tabularnewline
1 & 152 & 152.607204391736 & -0.607204391735592 \tabularnewline
2 & 185 & 185.080114719002 & -0.0801147190015528 \tabularnewline
3 & 180 & 181.781585468364 & -1.78158546836372 \tabularnewline
4 & 196 & 199.74522646515 & -3.7452264651496 \tabularnewline
5 & 142 & 139.174720703663 & 2.82527929633742 \tabularnewline
6 & 101 & 103.693917933819 & -2.69391793381877 \tabularnewline
7 & 149 & 150.26322740394 & -1.26322740394047 \tabularnewline
8 & 115 & 112.820697279446 & 2.17930272055401 \tabularnewline
9 & 175 & 174.559483939616 & 0.440516060384367 \tabularnewline
10 & 164 & 164.494420939188 & -0.494420939188291 \tabularnewline
11 & 141 & 143.423375508337 & -2.42337550833677 \tabularnewline
12 & 141 & 142.234164155187 & -1.2341641551873 \tabularnewline
13 & 184 & 186.542857589768 & -2.54285758976804 \tabularnewline
14 & 152 & 152.407945271142 & -0.40794527114202 \tabularnewline
15 & 148 & 151.244091081266 & -3.24409108126581 \tabularnewline
16 & 192 & 189.124966125467 & 2.87503387453308 \tabularnewline
17 & 147 & 143.502192182976 & 3.49780781702442 \tabularnewline
18 & 183 & 181.893893610297 & 1.10610638970288 \tabularnewline
19 & 177 & 177.298389142192 & -0.298389142191725 \tabularnewline
20 & 159 & 158.349340190465 & 0.650659809534807 \tabularnewline
21 & 177 & 176.577424149637 & 0.422575850362542 \tabularnewline
22 & 175 & 174.663657777528 & 0.336342222472297 \tabularnewline
23 & 175 & 167.688893920723 & 7.31110607927704 \tabularnewline
24 & 149 & 150.632798455448 & -1.63279845544823 \tabularnewline
25 & 192 & 191.195411595645 & 0.80458840435502 \tabularnewline
\hline
\end{tabular}
%Source: https://freestatistics.org/blog/index.php?pk=191199&T=4

[TABLE]
[ROW][C]Multiple Linear Regression - Actuals, Interpolation, and Residuals[/C][/ROW]
[ROW][C]Time or Index[/C][C]Actuals[/C][C]InterpolationForecast[/C][C]ResidualsPrediction Error[/C][/ROW]
[ROW][C]1[/C][C]152[/C][C]152.607204391736[/C][C]-0.607204391735592[/C][/ROW]
[ROW][C]2[/C][C]185[/C][C]185.080114719002[/C][C]-0.0801147190015528[/C][/ROW]
[ROW][C]3[/C][C]180[/C][C]181.781585468364[/C][C]-1.78158546836372[/C][/ROW]
[ROW][C]4[/C][C]196[/C][C]199.74522646515[/C][C]-3.7452264651496[/C][/ROW]
[ROW][C]5[/C][C]142[/C][C]139.174720703663[/C][C]2.82527929633742[/C][/ROW]
[ROW][C]6[/C][C]101[/C][C]103.693917933819[/C][C]-2.69391793381877[/C][/ROW]
[ROW][C]7[/C][C]149[/C][C]150.26322740394[/C][C]-1.26322740394047[/C][/ROW]
[ROW][C]8[/C][C]115[/C][C]112.820697279446[/C][C]2.17930272055401[/C][/ROW]
[ROW][C]9[/C][C]175[/C][C]174.559483939616[/C][C]0.440516060384367[/C][/ROW]
[ROW][C]10[/C][C]164[/C][C]164.494420939188[/C][C]-0.494420939188291[/C][/ROW]
[ROW][C]11[/C][C]141[/C][C]143.423375508337[/C][C]-2.42337550833677[/C][/ROW]
[ROW][C]12[/C][C]141[/C][C]142.234164155187[/C][C]-1.2341641551873[/C][/ROW]
[ROW][C]13[/C][C]184[/C][C]186.542857589768[/C][C]-2.54285758976804[/C][/ROW]
[ROW][C]14[/C][C]152[/C][C]152.407945271142[/C][C]-0.40794527114202[/C][/ROW]
[ROW][C]15[/C][C]148[/C][C]151.244091081266[/C][C]-3.24409108126581[/C][/ROW]
[ROW][C]16[/C][C]192[/C][C]189.124966125467[/C][C]2.87503387453308[/C][/ROW]
[ROW][C]17[/C][C]147[/C][C]143.502192182976[/C][C]3.49780781702442[/C][/ROW]
[ROW][C]18[/C][C]183[/C][C]181.893893610297[/C][C]1.10610638970288[/C][/ROW]
[ROW][C]19[/C][C]177[/C][C]177.298389142192[/C][C]-0.298389142191725[/C][/ROW]
[ROW][C]20[/C][C]159[/C][C]158.349340190465[/C][C]0.650659809534807[/C][/ROW]
[ROW][C]21[/C][C]177[/C][C]176.577424149637[/C][C]0.422575850362542[/C][/ROW]
[ROW][C]22[/C][C]175[/C][C]174.663657777528[/C][C]0.336342222472297[/C][/ROW]
[ROW][C]23[/C][C]175[/C][C]167.688893920723[/C][C]7.31110607927704[/C][/ROW]
[ROW][C]24[/C][C]149[/C][C]150.632798455448[/C][C]-1.63279845544823[/C][/ROW]
[ROW][C]25[/C][C]192[/C][C]191.195411595645[/C][C]0.80458840435502[/C][/ROW]
[/TABLE]
Source: https://freestatistics.org/blog/index.php?pk=191199&T=4

Globally Unique Identifier (entire table): ba.freestatistics.org/blog/index.php?pk=191199&T=4

As an alternative you can also use a QR Code:  

The GUIDs for individual cells are displayed in the table below:

Multiple Linear Regression - Actuals, Interpolation, and Residuals
Time or IndexActualsInterpolationForecastResidualsPrediction Error
1152152.607204391736-0.607204391735592
2185185.080114719002-0.0801147190015528
3180181.781585468364-1.78158546836372
4196199.74522646515-3.7452264651496
5142139.1747207036632.82527929633742
6101103.693917933819-2.69391793381877
7149150.26322740394-1.26322740394047
8115112.8206972794462.17930272055401
9175174.5594839396160.440516060384367
10164164.494420939188-0.494420939188291
11141143.423375508337-2.42337550833677
12141142.234164155187-1.2341641551873
13184186.542857589768-2.54285758976804
14152152.407945271142-0.40794527114202
15148151.244091081266-3.24409108126581
16192189.1249661254672.87503387453308
17147143.5021921829763.49780781702442
18183181.8938936102971.10610638970288
19177177.298389142192-0.298389142191725
20159158.3493401904650.650659809534807
21177176.5774241496370.422575850362542
22175174.6636577775280.336342222472297
23175167.6888939207237.31110607927704
24149150.632798455448-1.63279845544823
25192191.1954115956450.80458840435502


Parameters (Session):
par1 = 4 ; par2 = Do not include Seasonal Dummies ; par3 = No Linear Trend ;
Parameters (R input):
par1 = 4 ; par2 = Do not include Seasonal Dummies ; par3 = No Linear Trend ;
R code (references can be found in the software module):
library(lattice)
library(lmtest)
n25 <- 25 #minimum number of obs. for Goldfeld-Quandt test
par1 <- as.numeric(par1)
x <- t(y)
k <- length(x[1,])
n <- length(x[,1])
x1 <- cbind(x[,par1], x[,1:k!=par1])
mycolnames <- c(colnames(x)[par1], colnames(x)[1:k!=par1])
colnames(x1) <- mycolnames #colnames(x)[par1]
x <- x1
if (par3 == 'First Differences'){
x2 <- array(0, dim=c(n-1,k), dimnames=list(1:(n-1), paste('(1-B)',colnames(x),sep='')))
for (i in 1:n-1) {
for (j in 1:k) {
x2[i,j] <- x[i+1,j] - x[i,j]
}
}
x <- x2
}
if (par2 == 'Include Monthly Dummies'){
x2 <- array(0, dim=c(n,11), dimnames=list(1:n, paste('M', seq(1:11), sep ='')))
for (i in 1:11){
x2[seq(i,n,12),i] <- 1
}
x <- cbind(x, x2)
}
if (par2 == 'Include Quarterly Dummies'){
x2 <- array(0, dim=c(n,3), dimnames=list(1:n, paste('Q', seq(1:3), sep ='')))
for (i in 1:3){
x2[seq(i,n,4),i] <- 1
}
x <- cbind(x, x2)
}
k <- length(x[1,])
if (par3 == 'Linear Trend'){
x <- cbind(x, c(1:n))
colnames(x)[k+1] <- 't'
}
x
k <- length(x[1,])
df <- as.data.frame(x)
(mylm <- lm(df))
(mysum <- summary(mylm))
if (n > n25) {
kp3 <- k + 3
nmkm3 <- n - k - 3
gqarr <- array(NA, dim=c(nmkm3-kp3+1,3))
numgqtests <- 0
numsignificant1 <- 0
numsignificant5 <- 0
numsignificant10 <- 0
for (mypoint in kp3:nmkm3) {
j <- 0
numgqtests <- numgqtests + 1
for (myalt in c('greater', 'two.sided', 'less')) {
j <- j + 1
gqarr[mypoint-kp3+1,j] <- gqtest(mylm, point=mypoint, alternative=myalt)$p.value
}
if (gqarr[mypoint-kp3+1,2] < 0.01) numsignificant1 <- numsignificant1 + 1
if (gqarr[mypoint-kp3+1,2] < 0.05) numsignificant5 <- numsignificant5 + 1
if (gqarr[mypoint-kp3+1,2] < 0.10) numsignificant10 <- numsignificant10 + 1
}
gqarr
}
bitmap(file='test0.png')
plot(x[,1], type='l', main='Actuals and Interpolation', ylab='value of Actuals and Interpolation (dots)', xlab='time or index')
points(x[,1]-mysum$resid)
grid()
dev.off()
bitmap(file='test1.png')
plot(mysum$resid, type='b', pch=19, main='Residuals', ylab='value of Residuals', xlab='time or index')
grid()
dev.off()
bitmap(file='test2.png')
hist(mysum$resid, main='Residual Histogram', xlab='values of Residuals')
grid()
dev.off()
bitmap(file='test3.png')
densityplot(~mysum$resid,col='black',main='Residual Density Plot', xlab='values of Residuals')
dev.off()
bitmap(file='test4.png')
qqnorm(mysum$resid, main='Residual Normal Q-Q Plot')
qqline(mysum$resid)
grid()
dev.off()
(myerror <- as.ts(mysum$resid))
bitmap(file='test5.png')
dum <- cbind(lag(myerror,k=1),myerror)
dum
dum1 <- dum[2:length(myerror),]
dum1
z <- as.data.frame(dum1)
z
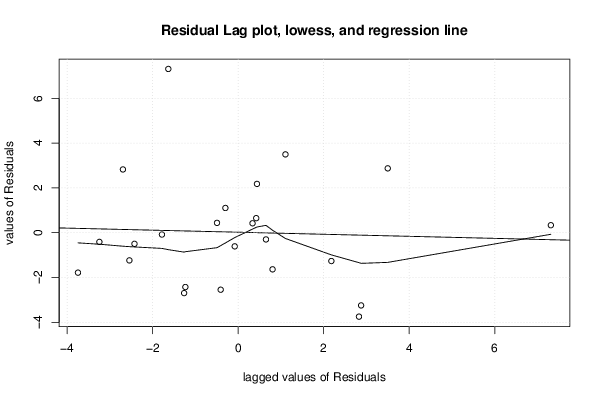
plot(z,main=paste('Residual Lag plot, lowess, and regression line'), ylab='values of Residuals', xlab='lagged values of Residuals')
lines(lowess(z))
abline(lm(z))
grid()
dev.off()
bitmap(file='test6.png')
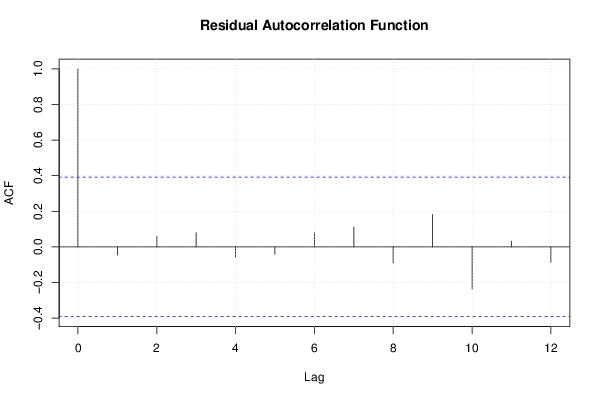
acf(mysum$resid, lag.max=length(mysum$resid)/2, main='Residual Autocorrelation Function')
grid()
dev.off()
bitmap(file='test7.png')
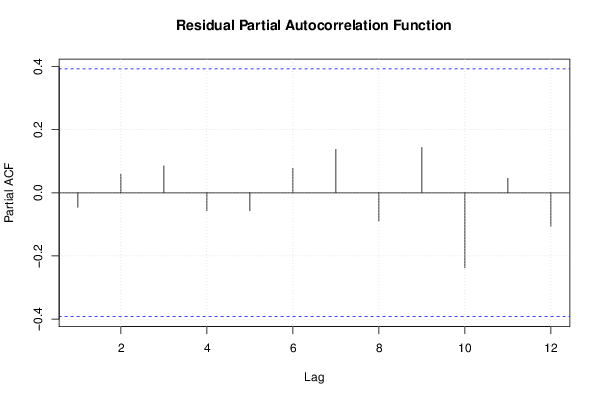
pacf(mysum$resid, lag.max=length(mysum$resid)/2, main='Residual Partial Autocorrelation Function')
grid()
dev.off()
bitmap(file='test8.png')
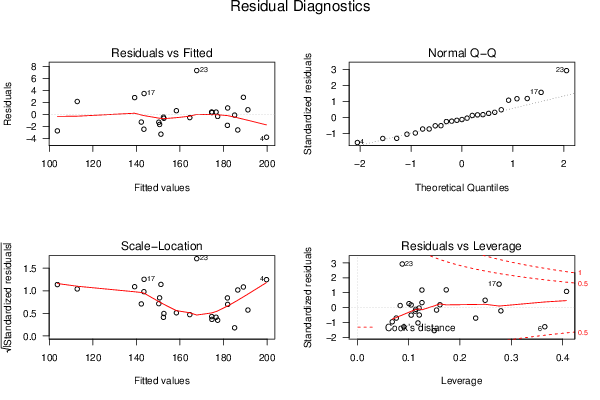
opar <- par(mfrow = c(2,2), oma = c(0, 0, 1.1, 0))
plot(mylm, las = 1, sub='Residual Diagnostics')
par(opar)
dev.off()
if (n > n25) {
bitmap(file='test9.png')
plot(kp3:nmkm3,gqarr[,2], main='Goldfeld-Quandt test',ylab='2-sided p-value',xlab='breakpoint')
grid()
dev.off()
}
load(file='createtable')
a<-table.start()
a<-table.row.start(a)
a<-table.element(a, 'Multiple Linear Regression - Estimated Regression Equation', 1, TRUE)
a<-table.row.end(a)
myeq <- colnames(x)[1]
myeq <- paste(myeq, '[t] = ', sep='')
for (i in 1:k){
if (mysum$coefficients[i,1] > 0) myeq <- paste(myeq, '+', '')
myeq <- paste(myeq, mysum$coefficients[i,1], sep=' ')
if (rownames(mysum$coefficients)[i] != '(Intercept)') {
myeq <- paste(myeq, rownames(mysum$coefficients)[i], sep='')
if (rownames(mysum$coefficients)[i] != 't') myeq <- paste(myeq, '[t]', sep='')
}
}
myeq <- paste(myeq, ' + e[t]')
a<-table.row.start(a)
a<-table.element(a, myeq)
a<-table.row.end(a)
a<-table.end(a)
table.save(a,file='mytable1.tab')
a<-table.start()
a<-table.row.start(a)
a<-table.element(a,hyperlink('ols1.htm','Multiple Linear Regression - Ordinary Least Squares',''), 6, TRUE)
a<-table.row.end(a)
a<-table.row.start(a)
a<-table.element(a,'Variable',header=TRUE)
a<-table.element(a,'Parameter',header=TRUE)
a<-table.element(a,'S.D.',header=TRUE)
a<-table.element(a,'T-STAT
H0: parameter = 0',header=TRUE)
a<-table.element(a,'2-tail p-value',header=TRUE)
a<-table.element(a,'1-tail p-value',header=TRUE)
a<-table.row.end(a)
for (i in 1:k){
a<-table.row.start(a)
a<-table.element(a,rownames(mysum$coefficients)[i],header=TRUE)
a<-table.element(a,mysum$coefficients[i,1])
a<-table.element(a, round(mysum$coefficients[i,2],6))
a<-table.element(a, round(mysum$coefficients[i,3],4))
a<-table.element(a, round(mysum$coefficients[i,4],6))
a<-table.element(a, round(mysum$coefficients[i,4]/2,6))
a<-table.row.end(a)
}
a<-table.end(a)
table.save(a,file='mytable2.tab')
a<-table.start()
a<-table.row.start(a)
a<-table.element(a, 'Multiple Linear Regression - Regression Statistics', 2, TRUE)
a<-table.row.end(a)
a<-table.row.start(a)
a<-table.element(a, 'Multiple R',1,TRUE)
a<-table.element(a, sqrt(mysum$r.squared))
a<-table.row.end(a)
a<-table.row.start(a)
a<-table.element(a, 'R-squared',1,TRUE)
a<-table.element(a, mysum$r.squared)
a<-table.row.end(a)
a<-table.row.start(a)
a<-table.element(a, 'Adjusted R-squared',1,TRUE)
a<-table.element(a, mysum$adj.r.squared)
a<-table.row.end(a)
a<-table.row.start(a)
a<-table.element(a, 'F-TEST (value)',1,TRUE)
a<-table.element(a, mysum$fstatistic[1])
a<-table.row.end(a)
a<-table.row.start(a)
a<-table.element(a, 'F-TEST (DF numerator)',1,TRUE)
a<-table.element(a, mysum$fstatistic[2])
a<-table.row.end(a)
a<-table.row.start(a)
a<-table.element(a, 'F-TEST (DF denominator)',1,TRUE)
a<-table.element(a, mysum$fstatistic[3])
a<-table.row.end(a)
a<-table.row.start(a)
a<-table.element(a, 'p-value',1,TRUE)
a<-table.element(a, 1-pf(mysum$fstatistic[1],mysum$fstatistic[2],mysum$fstatistic[3]))
a<-table.row.end(a)
a<-table.row.start(a)
a<-table.element(a, 'Multiple Linear Regression - Residual Statistics', 2, TRUE)
a<-table.row.end(a)
a<-table.row.start(a)
a<-table.element(a, 'Residual Standard Deviation',1,TRUE)
a<-table.element(a, mysum$sigma)
a<-table.row.end(a)
a<-table.row.start(a)
a<-table.element(a, 'Sum Squared Residuals',1,TRUE)
a<-table.element(a, sum(myerror*myerror))
a<-table.row.end(a)
a<-table.end(a)
table.save(a,file='mytable3.tab')
a<-table.start()
a<-table.row.start(a)
a<-table.element(a, 'Multiple Linear Regression - Actuals, Interpolation, and Residuals', 4, TRUE)
a<-table.row.end(a)
a<-table.row.start(a)
a<-table.element(a, 'Time or Index', 1, TRUE)
a<-table.element(a, 'Actuals', 1, TRUE)
a<-table.element(a, 'Interpolation
Forecast', 1, TRUE)
a<-table.element(a, 'Residuals
Prediction Error', 1, TRUE)
a<-table.row.end(a)
for (i in 1:n) {
a<-table.row.start(a)
a<-table.element(a,i, 1, TRUE)
a<-table.element(a,x[i])
a<-table.element(a,x[i]-mysum$resid[i])
a<-table.element(a,mysum$resid[i])
a<-table.row.end(a)
}
a<-table.end(a)
table.save(a,file='mytable4.tab')
if (n > n25) {
a<-table.start()
a<-table.row.start(a)
a<-table.element(a,'Goldfeld-Quandt test for Heteroskedasticity',4,TRUE)
a<-table.row.end(a)
a<-table.row.start(a)
a<-table.element(a,'p-values',header=TRUE)
a<-table.element(a,'Alternative Hypothesis',3,header=TRUE)
a<-table.row.end(a)
a<-table.row.start(a)
a<-table.element(a,'breakpoint index',header=TRUE)
a<-table.element(a,'greater',header=TRUE)
a<-table.element(a,'2-sided',header=TRUE)
a<-table.element(a,'less',header=TRUE)
a<-table.row.end(a)
for (mypoint in kp3:nmkm3) {
a<-table.row.start(a)
a<-table.element(a,mypoint,header=TRUE)
a<-table.element(a,gqarr[mypoint-kp3+1,1])
a<-table.element(a,gqarr[mypoint-kp3+1,2])
a<-table.element(a,gqarr[mypoint-kp3+1,3])
a<-table.row.end(a)
}
a<-table.end(a)
table.save(a,file='mytable5.tab')
a<-table.start()
a<-table.row.start(a)
a<-table.element(a,'Meta Analysis of Goldfeld-Quandt test for Heteroskedasticity',4,TRUE)
a<-table.row.end(a)
a<-table.row.start(a)
a<-table.element(a,'Description',header=TRUE)
a<-table.element(a,'# significant tests',header=TRUE)
a<-table.element(a,'% significant tests',header=TRUE)
a<-table.element(a,'OK/NOK',header=TRUE)
a<-table.row.end(a)
a<-table.row.start(a)
a<-table.element(a,'1% type I error level',header=TRUE)
a<-table.element(a,numsignificant1)
a<-table.element(a,numsignificant1/numgqtests)
if (numsignificant1/numgqtests < 0.01) dum <- 'OK' else dum <- 'NOK'
a<-table.element(a,dum)
a<-table.row.end(a)
a<-table.row.start(a)
a<-table.element(a,'5% type I error level',header=TRUE)
a<-table.element(a,numsignificant5)
a<-table.element(a,numsignificant5/numgqtests)
if (numsignificant5/numgqtests < 0.05) dum <- 'OK' else dum <- 'NOK'
a<-table.element(a,dum)
a<-table.row.end(a)
a<-table.row.start(a)
a<-table.element(a,'10% type I error level',header=TRUE)
a<-table.element(a,numsignificant10)
a<-table.element(a,numsignificant10/numgqtests)
if (numsignificant10/numgqtests < 0.1) dum <- 'OK' else dum <- 'NOK'
a<-table.element(a,dum)
a<-table.row.end(a)
a<-table.end(a)
table.save(a,file='mytable6.tab')
}