Free Statistics

of Irreproducible Research!

Author's title

Author*The author of this computation has been verified*
R Software Modulerwasp_arimaforecasting.wasp
Title produced by softwareARIMA Forecasting
Date of computationSat, 24 Nov 2012 09:13:34 -0500
Cite this page as followsStatistical Computations at FreeStatistics.org, Office for Research Development and Education, URL https://freestatistics.org/blog/index.php?v=date/2012/Nov/24/t1353766433lwxabdaznisl63q.htm/, Retrieved Sun, 28 Apr 2024 20:53:48 +0000
Statistical Computations at FreeStatistics.org, Office for Research Development and Education, URL https://freestatistics.org/blog/index.php?pk=192432, Retrieved Sun, 28 Apr 2024 20:53:48 +0000
QR Codes:

Original text written by user:
IsPrivate?No (this computation is public)
User-defined keywords
Estimated Impact136
Family? (F = Feedback message, R = changed R code, M = changed R Module, P = changed Parameters, D = changed Data)
-     [ARIMA Backward Selection] [] [2012-11-24 13:06:47] [391561951b5d7f721cfaa4f5575ab127]
- R  D  [ARIMA Backward Selection] [] [2012-11-24 13:21:16] [391561951b5d7f721cfaa4f5575ab127]
- RMP       [ARIMA Forecasting] [Forcast Faillisse...] [2012-11-24 14:13:34] [7338cd26db379c04f0557b08db763c32] [Current]
- R P         [ARIMA Forecasting] [] [2012-12-20 20:11:23] [74be16979710d4c4e7c6647856088456]
Feedback Forum

Post a new message
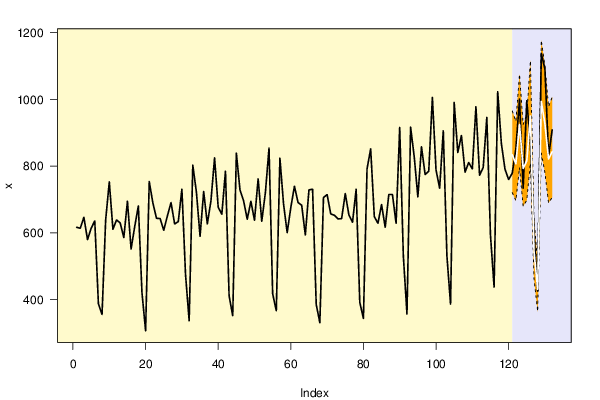
Dataseries X:
617
614
647
580
614
636
388
356
639
753
611
639
630
586
695
552
619
681
421
307
754
690
644
643
608
651
691
627
634
731
475
337
803
722
590
724
627
696
825
677
656
785
412
352
839
729
696
641
695
638
762
635
721
854
418
367
824
687
601
676
740
691
683
594
729
731
386
331
706
715
657
653
642
643
718
654
632
731
392
344
792
852
649
629
685
617
715
715
629
916
531
357
917
828
708
858
775
785
1006
789
734
906
532
387
991
841
892
782
811
792
978
773
796
946
594
438
1023
868
791
760
779
852
1001
734
996
869
599
426
1138
1091
830
909


Summary of computational transaction
Raw Inputview raw input (R code)
Raw Outputview raw output of R engine
Computing time2 seconds
R Server'Gwilym Jenkins' @ jenkins.wessa.net

\begin{tabular}{lllllllll}
\hline
Summary of computational transaction \tabularnewline
Raw Input & view raw input (R code)  \tabularnewline
Raw Output & view raw output of R engine  \tabularnewline
Computing time & 2 seconds \tabularnewline
R Server & 'Gwilym Jenkins' @ jenkins.wessa.net \tabularnewline
\hline
\end{tabular}
%Source: https://freestatistics.org/blog/index.php?pk=192432&T=0

[TABLE]
[ROW][C]Summary of computational transaction[/C][/ROW]
[ROW][C]Raw Input[/C][C]view raw input (R code) [/C][/ROW]
[ROW][C]Raw Output[/C][C]view raw output of R engine [/C][/ROW]
[ROW][C]Computing time[/C][C]2 seconds[/C][/ROW]
[ROW][C]R Server[/C][C]'Gwilym Jenkins' @ jenkins.wessa.net[/C][/ROW]
[/TABLE]
Source: https://freestatistics.org/blog/index.php?pk=192432&T=0

Globally Unique Identifier (entire table): ba.freestatistics.org/blog/index.php?pk=192432&T=0

As an alternative you can also use a QR Code:  

The GUIDs for individual cells are displayed in the table below:

Summary of computational transaction
Raw Inputview raw input (R code)
Raw Outputview raw output of R engine
Computing time2 seconds
R Server'Gwilym Jenkins' @ jenkins.wessa.net


Univariate ARIMA Extrapolation Forecast
timeY[t]F[t]95% LB95% UBp-value(H0: Y[t] = F[t])P(F[t]>Y[t-1])P(F[t]>Y[t-s])P(F[t]>Y[120])
108782-------
109811-------
110792-------
111978-------
112773-------
113796-------
114946-------
115594-------
116438-------
1171023-------
118868-------
119791-------
120760-------
121779834.2344720.8898965.40.20460.86630.63580.8663
122852807.054697.0693934.39210.24450.66710.59160.7655
1231001924.8183795.58991075.03740.16010.8290.24390.9842
124734793.408680.4296925.14530.18840.0010.61930.6904
125996815.8052697.4265954.27710.00540.87650.61040.7852
126869950.5865810.14981115.36740.16590.29450.52180.9883
127599544.6124462.7504640.95610.134300.15750
128426431.1212365.2316508.89750.448700.43120
1291138993.9078839.55181176.64310.061110.37750.9939
1301091926.8827780.69341100.44680.03190.00860.7470.9703
131830821.5263690.0008978.12270.45784e-040.64880.7794
132909843.3857706.42311006.90290.21580.56370.84120.8412

\begin{tabular}{lllllllll}
\hline
Univariate ARIMA Extrapolation Forecast \tabularnewline
time & Y[t] & F[t] & 95% LB & 95% UB & p-value(H0: Y[t] = F[t]) & P(F[t]>Y[t-1]) & P(F[t]>Y[t-s]) & P(F[t]>Y[120]) \tabularnewline
108 & 782 & - & - & - & - & - & - & - \tabularnewline
109 & 811 & - & - & - & - & - & - & - \tabularnewline
110 & 792 & - & - & - & - & - & - & - \tabularnewline
111 & 978 & - & - & - & - & - & - & - \tabularnewline
112 & 773 & - & - & - & - & - & - & - \tabularnewline
113 & 796 & - & - & - & - & - & - & - \tabularnewline
114 & 946 & - & - & - & - & - & - & - \tabularnewline
115 & 594 & - & - & - & - & - & - & - \tabularnewline
116 & 438 & - & - & - & - & - & - & - \tabularnewline
117 & 1023 & - & - & - & - & - & - & - \tabularnewline
118 & 868 & - & - & - & - & - & - & - \tabularnewline
119 & 791 & - & - & - & - & - & - & - \tabularnewline
120 & 760 & - & - & - & - & - & - & - \tabularnewline
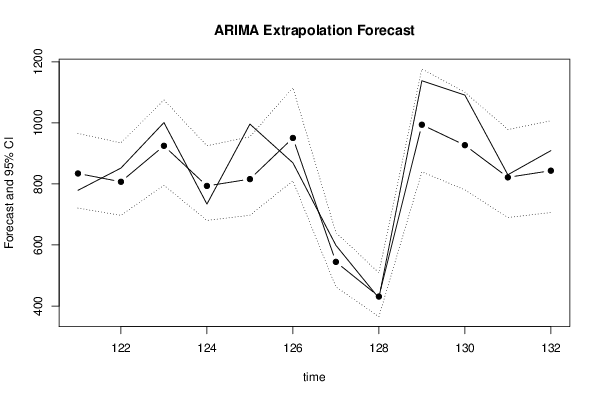
121 & 779 & 834.2344 & 720.8898 & 965.4 & 0.2046 & 0.8663 & 0.6358 & 0.8663 \tabularnewline
122 & 852 & 807.054 & 697.0693 & 934.3921 & 0.2445 & 0.6671 & 0.5916 & 0.7655 \tabularnewline
123 & 1001 & 924.8183 & 795.5899 & 1075.0374 & 0.1601 & 0.829 & 0.2439 & 0.9842 \tabularnewline
124 & 734 & 793.408 & 680.4296 & 925.1453 & 0.1884 & 0.001 & 0.6193 & 0.6904 \tabularnewline
125 & 996 & 815.8052 & 697.4265 & 954.2771 & 0.0054 & 0.8765 & 0.6104 & 0.7852 \tabularnewline
126 & 869 & 950.5865 & 810.1498 & 1115.3674 & 0.1659 & 0.2945 & 0.5218 & 0.9883 \tabularnewline
127 & 599 & 544.6124 & 462.7504 & 640.9561 & 0.1343 & 0 & 0.1575 & 0 \tabularnewline
128 & 426 & 431.1212 & 365.2316 & 508.8975 & 0.4487 & 0 & 0.4312 & 0 \tabularnewline
129 & 1138 & 993.9078 & 839.5518 & 1176.6431 & 0.0611 & 1 & 0.3775 & 0.9939 \tabularnewline
130 & 1091 & 926.8827 & 780.6934 & 1100.4468 & 0.0319 & 0.0086 & 0.747 & 0.9703 \tabularnewline
131 & 830 & 821.5263 & 690.0008 & 978.1227 & 0.4578 & 4e-04 & 0.6488 & 0.7794 \tabularnewline
132 & 909 & 843.3857 & 706.4231 & 1006.9029 & 0.2158 & 0.5637 & 0.8412 & 0.8412 \tabularnewline
\hline
\end{tabular}
%Source: https://freestatistics.org/blog/index.php?pk=192432&T=1

[TABLE]
[ROW][C]Univariate ARIMA Extrapolation Forecast[/C][/ROW]
[ROW][C]time[/C][C]Y[t][/C][C]F[t][/C][C]95% LB[/C][C]95% UB[/C][C]p-value(H0: Y[t] = F[t])[/C][C]P(F[t]>Y[t-1])[/C][C]P(F[t]>Y[t-s])[/C][C]P(F[t]>Y[120])[/C][/ROW]
[ROW][C]108[/C][C]782[/C][C]-[/C][C]-[/C][C]-[/C][C]-[/C][C]-[/C][C]-[/C][C]-[/C][/ROW]
[ROW][C]109[/C][C]811[/C][C]-[/C][C]-[/C][C]-[/C][C]-[/C][C]-[/C][C]-[/C][C]-[/C][/ROW]
[ROW][C]110[/C][C]792[/C][C]-[/C][C]-[/C][C]-[/C][C]-[/C][C]-[/C][C]-[/C][C]-[/C][/ROW]
[ROW][C]111[/C][C]978[/C][C]-[/C][C]-[/C][C]-[/C][C]-[/C][C]-[/C][C]-[/C][C]-[/C][/ROW]
[ROW][C]112[/C][C]773[/C][C]-[/C][C]-[/C][C]-[/C][C]-[/C][C]-[/C][C]-[/C][C]-[/C][/ROW]
[ROW][C]113[/C][C]796[/C][C]-[/C][C]-[/C][C]-[/C][C]-[/C][C]-[/C][C]-[/C][C]-[/C][/ROW]
[ROW][C]114[/C][C]946[/C][C]-[/C][C]-[/C][C]-[/C][C]-[/C][C]-[/C][C]-[/C][C]-[/C][/ROW]
[ROW][C]115[/C][C]594[/C][C]-[/C][C]-[/C][C]-[/C][C]-[/C][C]-[/C][C]-[/C][C]-[/C][/ROW]
[ROW][C]116[/C][C]438[/C][C]-[/C][C]-[/C][C]-[/C][C]-[/C][C]-[/C][C]-[/C][C]-[/C][/ROW]
[ROW][C]117[/C][C]1023[/C][C]-[/C][C]-[/C][C]-[/C][C]-[/C][C]-[/C][C]-[/C][C]-[/C][/ROW]
[ROW][C]118[/C][C]868[/C][C]-[/C][C]-[/C][C]-[/C][C]-[/C][C]-[/C][C]-[/C][C]-[/C][/ROW]
[ROW][C]119[/C][C]791[/C][C]-[/C][C]-[/C][C]-[/C][C]-[/C][C]-[/C][C]-[/C][C]-[/C][/ROW]
[ROW][C]120[/C][C]760[/C][C]-[/C][C]-[/C][C]-[/C][C]-[/C][C]-[/C][C]-[/C][C]-[/C][/ROW]
[ROW][C]121[/C][C]779[/C][C]834.2344[/C][C]720.8898[/C][C]965.4[/C][C]0.2046[/C][C]0.8663[/C][C]0.6358[/C][C]0.8663[/C][/ROW]
[ROW][C]122[/C][C]852[/C][C]807.054[/C][C]697.0693[/C][C]934.3921[/C][C]0.2445[/C][C]0.6671[/C][C]0.5916[/C][C]0.7655[/C][/ROW]
[ROW][C]123[/C][C]1001[/C][C]924.8183[/C][C]795.5899[/C][C]1075.0374[/C][C]0.1601[/C][C]0.829[/C][C]0.2439[/C][C]0.9842[/C][/ROW]
[ROW][C]124[/C][C]734[/C][C]793.408[/C][C]680.4296[/C][C]925.1453[/C][C]0.1884[/C][C]0.001[/C][C]0.6193[/C][C]0.6904[/C][/ROW]
[ROW][C]125[/C][C]996[/C][C]815.8052[/C][C]697.4265[/C][C]954.2771[/C][C]0.0054[/C][C]0.8765[/C][C]0.6104[/C][C]0.7852[/C][/ROW]
[ROW][C]126[/C][C]869[/C][C]950.5865[/C][C]810.1498[/C][C]1115.3674[/C][C]0.1659[/C][C]0.2945[/C][C]0.5218[/C][C]0.9883[/C][/ROW]
[ROW][C]127[/C][C]599[/C][C]544.6124[/C][C]462.7504[/C][C]640.9561[/C][C]0.1343[/C][C]0[/C][C]0.1575[/C][C]0[/C][/ROW]
[ROW][C]128[/C][C]426[/C][C]431.1212[/C][C]365.2316[/C][C]508.8975[/C][C]0.4487[/C][C]0[/C][C]0.4312[/C][C]0[/C][/ROW]
[ROW][C]129[/C][C]1138[/C][C]993.9078[/C][C]839.5518[/C][C]1176.6431[/C][C]0.0611[/C][C]1[/C][C]0.3775[/C][C]0.9939[/C][/ROW]
[ROW][C]130[/C][C]1091[/C][C]926.8827[/C][C]780.6934[/C][C]1100.4468[/C][C]0.0319[/C][C]0.0086[/C][C]0.747[/C][C]0.9703[/C][/ROW]
[ROW][C]131[/C][C]830[/C][C]821.5263[/C][C]690.0008[/C][C]978.1227[/C][C]0.4578[/C][C]4e-04[/C][C]0.6488[/C][C]0.7794[/C][/ROW]
[ROW][C]132[/C][C]909[/C][C]843.3857[/C][C]706.4231[/C][C]1006.9029[/C][C]0.2158[/C][C]0.5637[/C][C]0.8412[/C][C]0.8412[/C][/ROW]
[/TABLE]
Source: https://freestatistics.org/blog/index.php?pk=192432&T=1

Globally Unique Identifier (entire table): ba.freestatistics.org/blog/index.php?pk=192432&T=1

As an alternative you can also use a QR Code:  

The GUIDs for individual cells are displayed in the table below:

Univariate ARIMA Extrapolation Forecast
timeY[t]F[t]95% LB95% UBp-value(H0: Y[t] = F[t])P(F[t]>Y[t-1])P(F[t]>Y[t-s])P(F[t]>Y[120])
108782-------
109811-------
110792-------
111978-------
112773-------
113796-------
114946-------
115594-------
116438-------
1171023-------
118868-------
119791-------
120760-------
121779834.2344720.8898965.40.20460.86630.63580.8663
122852807.054697.0693934.39210.24450.66710.59160.7655
1231001924.8183795.58991075.03740.16010.8290.24390.9842
124734793.408680.4296925.14530.18840.0010.61930.6904
125996815.8052697.4265954.27710.00540.87650.61040.7852
126869950.5865810.14981115.36740.16590.29450.52180.9883
127599544.6124462.7504640.95610.134300.15750
128426431.1212365.2316508.89750.448700.43120
1291138993.9078839.55181176.64310.061110.37750.9939
1301091926.8827780.69341100.44680.03190.00860.7470.9703
131830821.5263690.0008978.12270.45784e-040.64880.7794
132909843.3857706.42311006.90290.21580.56370.84120.8412


Univariate ARIMA Extrapolation Forecast Performance
time% S.E.PEMAPESq.EMSERMSE
1210.0802-0.066203050.839300
1220.08050.05570.0612020.14632535.492850.3537
1230.08290.08240.06815803.65173624.879160.207
1240.0847-0.07490.06983529.31193600.987360.0082
1250.08660.22090.132470.17259374.824396.8237
1260.0884-0.08580.09766656.3618921.747194.455
1270.09030.09990.0982958.00898069.784589.832
1280.092-0.01190.087226.22637064.339784.0496
1290.09380.1450.093620762.55678586.363892.6626
1300.09550.17710.10226934.488310421.1763102.0842
1310.09730.01030.093671.80399480.324397.367
1320.09890.07780.09234305.23229049.066695.1266

\begin{tabular}{lllllllll}
\hline
Univariate ARIMA Extrapolation Forecast Performance \tabularnewline
time & % S.E. & PE & MAPE & Sq.E & MSE & RMSE \tabularnewline
121 & 0.0802 & -0.0662 & 0 & 3050.8393 & 0 & 0 \tabularnewline
122 & 0.0805 & 0.0557 & 0.061 & 2020.1463 & 2535.4928 & 50.3537 \tabularnewline
123 & 0.0829 & 0.0824 & 0.0681 & 5803.6517 & 3624.8791 & 60.207 \tabularnewline
124 & 0.0847 & -0.0749 & 0.0698 & 3529.3119 & 3600.9873 & 60.0082 \tabularnewline
125 & 0.0866 & 0.2209 & 0.1 & 32470.1725 & 9374.8243 & 96.8237 \tabularnewline
126 & 0.0884 & -0.0858 & 0.0976 & 6656.361 & 8921.7471 & 94.455 \tabularnewline
127 & 0.0903 & 0.0999 & 0.098 & 2958.0089 & 8069.7845 & 89.832 \tabularnewline
128 & 0.092 & -0.0119 & 0.0872 & 26.2263 & 7064.3397 & 84.0496 \tabularnewline
129 & 0.0938 & 0.145 & 0.0936 & 20762.5567 & 8586.3638 & 92.6626 \tabularnewline
130 & 0.0955 & 0.1771 & 0.102 & 26934.4883 & 10421.1763 & 102.0842 \tabularnewline
131 & 0.0973 & 0.0103 & 0.0936 & 71.8039 & 9480.3243 & 97.367 \tabularnewline
132 & 0.0989 & 0.0778 & 0.0923 & 4305.2322 & 9049.0666 & 95.1266 \tabularnewline
\hline
\end{tabular}
%Source: https://freestatistics.org/blog/index.php?pk=192432&T=2

[TABLE]
[ROW][C]Univariate ARIMA Extrapolation Forecast Performance[/C][/ROW]
[ROW][C]time[/C][C]% S.E.[/C][C]PE[/C][C]MAPE[/C][C]Sq.E[/C][C]MSE[/C][C]RMSE[/C][/ROW]
[ROW][C]121[/C][C]0.0802[/C][C]-0.0662[/C][C]0[/C][C]3050.8393[/C][C]0[/C][C]0[/C][/ROW]
[ROW][C]122[/C][C]0.0805[/C][C]0.0557[/C][C]0.061[/C][C]2020.1463[/C][C]2535.4928[/C][C]50.3537[/C][/ROW]
[ROW][C]123[/C][C]0.0829[/C][C]0.0824[/C][C]0.0681[/C][C]5803.6517[/C][C]3624.8791[/C][C]60.207[/C][/ROW]
[ROW][C]124[/C][C]0.0847[/C][C]-0.0749[/C][C]0.0698[/C][C]3529.3119[/C][C]3600.9873[/C][C]60.0082[/C][/ROW]
[ROW][C]125[/C][C]0.0866[/C][C]0.2209[/C][C]0.1[/C][C]32470.1725[/C][C]9374.8243[/C][C]96.8237[/C][/ROW]
[ROW][C]126[/C][C]0.0884[/C][C]-0.0858[/C][C]0.0976[/C][C]6656.361[/C][C]8921.7471[/C][C]94.455[/C][/ROW]
[ROW][C]127[/C][C]0.0903[/C][C]0.0999[/C][C]0.098[/C][C]2958.0089[/C][C]8069.7845[/C][C]89.832[/C][/ROW]
[ROW][C]128[/C][C]0.092[/C][C]-0.0119[/C][C]0.0872[/C][C]26.2263[/C][C]7064.3397[/C][C]84.0496[/C][/ROW]
[ROW][C]129[/C][C]0.0938[/C][C]0.145[/C][C]0.0936[/C][C]20762.5567[/C][C]8586.3638[/C][C]92.6626[/C][/ROW]
[ROW][C]130[/C][C]0.0955[/C][C]0.1771[/C][C]0.102[/C][C]26934.4883[/C][C]10421.1763[/C][C]102.0842[/C][/ROW]
[ROW][C]131[/C][C]0.0973[/C][C]0.0103[/C][C]0.0936[/C][C]71.8039[/C][C]9480.3243[/C][C]97.367[/C][/ROW]
[ROW][C]132[/C][C]0.0989[/C][C]0.0778[/C][C]0.0923[/C][C]4305.2322[/C][C]9049.0666[/C][C]95.1266[/C][/ROW]
[/TABLE]
Source: https://freestatistics.org/blog/index.php?pk=192432&T=2

Globally Unique Identifier (entire table): ba.freestatistics.org/blog/index.php?pk=192432&T=2

As an alternative you can also use a QR Code:  

The GUIDs for individual cells are displayed in the table below:

Univariate ARIMA Extrapolation Forecast Performance
time% S.E.PEMAPESq.EMSERMSE
1210.0802-0.066203050.839300
1220.08050.05570.0612020.14632535.492850.3537
1230.08290.08240.06815803.65173624.879160.207
1240.0847-0.07490.06983529.31193600.987360.0082
1250.08660.22090.132470.17259374.824396.8237
1260.0884-0.08580.09766656.3618921.747194.455
1270.09030.09990.0982958.00898069.784589.832
1280.092-0.01190.087226.22637064.339784.0496
1290.09380.1450.093620762.55678586.363892.6626
1300.09550.17710.10226934.488310421.1763102.0842
1310.09730.01030.093671.80399480.324397.367
1320.09890.07780.09234305.23229049.066695.1266


Parameters (Session):
par1 = 12 ; par2 = 0.0 ; par3 = 1 ; par4 = 1 ; par5 = 12 ; par6 = 1 ; par7 = 1 ; par8 = 0 ; par9 = 1 ; par10 = FALSE ;
Parameters (R input):
par1 = 12 ; par2 = 0.0 ; par3 = 1 ; par4 = 1 ; par5 = 12 ; par6 = 1 ; par7 = 1 ; par8 = 0 ; par9 = 1 ; par10 = FALSE ;
R code (references can be found in the software module):
par1 <- as.numeric(par1) #cut off periods
par2 <- as.numeric(par2) #lambda
par3 <- as.numeric(par3) #degree of non-seasonal differencing
par4 <- as.numeric(par4) #degree of seasonal differencing
par5 <- as.numeric(par5) #seasonal period
par6 <- as.numeric(par6) #p
par7 <- as.numeric(par7) #q
par8 <- as.numeric(par8) #P
par9 <- as.numeric(par9) #Q
if (par10 == 'TRUE') par10 <- TRUE
if (par10 == 'FALSE') par10 <- FALSE
if (par2 == 0) x <- log(x)
if (par2 != 0) x <- x^par2
lx <- length(x)
first <- lx - 2*par1
nx <- lx - par1
nx1 <- nx + 1
fx <- lx - nx
if (fx < 1) {
fx <- par5
nx1 <- lx + fx - 1
first <- lx - 2*fx
}
first <- 1
if (fx < 3) fx <- round(lx/10,0)
(arima.out <- arima(x[1:nx], order=c(par6,par3,par7), seasonal=list(order=c(par8,par4,par9), period=par5), include.mean=par10, method='ML'))
(forecast <- predict(arima.out,par1))
(lb <- forecast$pred - 1.96 * forecast$se)
(ub <- forecast$pred + 1.96 * forecast$se)
if (par2 == 0) {
x <- exp(x)
forecast$pred <- exp(forecast$pred)
lb <- exp(lb)
ub <- exp(ub)
}
if (par2 != 0) {
x <- x^(1/par2)
forecast$pred <- forecast$pred^(1/par2)
lb <- lb^(1/par2)
ub <- ub^(1/par2)
}
if (par2 < 0) {
olb <- lb
lb <- ub
ub <- olb
}
(actandfor <- c(x[1:nx], forecast$pred))
(perc.se <- (ub-forecast$pred)/1.96/forecast$pred)
bitmap(file='test1.png')
opar <- par(mar=c(4,4,2,2),las=1)
ylim <- c( min(x[first:nx],lb), max(x[first:nx],ub))
plot(x,ylim=ylim,type='n',xlim=c(first,lx))
usr <- par('usr')
rect(usr[1],usr[3],nx+1,usr[4],border=NA,col='lemonchiffon')
rect(nx1,usr[3],usr[2],usr[4],border=NA,col='lavender')
abline(h= (-3:3)*2 , col ='gray', lty =3)
polygon( c(nx1:lx,lx:nx1), c(lb,rev(ub)), col = 'orange', lty=2,border=NA)
lines(nx1:lx, lb , lty=2)
lines(nx1:lx, ub , lty=2)
lines(x, lwd=2)
lines(nx1:lx, forecast$pred , lwd=2 , col ='white')
box()
par(opar)
dev.off()
prob.dec <- array(NA, dim=fx)
prob.sdec <- array(NA, dim=fx)
prob.ldec <- array(NA, dim=fx)
prob.pval <- array(NA, dim=fx)
perf.pe <- array(0, dim=fx)
perf.mape <- array(0, dim=fx)
perf.mape1 <- array(0, dim=fx)
perf.se <- array(0, dim=fx)
perf.mse <- array(0, dim=fx)
perf.mse1 <- array(0, dim=fx)
perf.rmse <- array(0, dim=fx)
for (i in 1:fx) {
locSD <- (ub[i] - forecast$pred[i]) / 1.96
perf.pe[i] = (x[nx+i] - forecast$pred[i]) / forecast$pred[i]
perf.se[i] = (x[nx+i] - forecast$pred[i])^2
prob.dec[i] = pnorm((x[nx+i-1] - forecast$pred[i]) / locSD)
prob.sdec[i] = pnorm((x[nx+i-par5] - forecast$pred[i]) / locSD)
prob.ldec[i] = pnorm((x[nx] - forecast$pred[i]) / locSD)
prob.pval[i] = pnorm(abs(x[nx+i] - forecast$pred[i]) / locSD)
}
perf.mape[1] = abs(perf.pe[1])
perf.mse[1] = abs(perf.se[1])
for (i in 2:fx) {
perf.mape[i] = perf.mape[i-1] + abs(perf.pe[i])
perf.mape1[i] = perf.mape[i] / i
perf.mse[i] = perf.mse[i-1] + perf.se[i]
perf.mse1[i] = perf.mse[i] / i
}
perf.rmse = sqrt(perf.mse1)
bitmap(file='test2.png')
plot(forecast$pred, pch=19, type='b',main='ARIMA Extrapolation Forecast', ylab='Forecast and 95% CI', xlab='time',ylim=c(min(lb),max(ub)))
dum <- forecast$pred
dum[1:par1] <- x[(nx+1):lx]
lines(dum, lty=1)
lines(ub,lty=3)
lines(lb,lty=3)
dev.off()
load(file='createtable')
a<-table.start()
a<-table.row.start(a)
a<-table.element(a,'Univariate ARIMA Extrapolation Forecast',9,TRUE)
a<-table.row.end(a)
a<-table.row.start(a)
a<-table.element(a,'time',1,header=TRUE)
a<-table.element(a,'Y[t]',1,header=TRUE)
a<-table.element(a,'F[t]',1,header=TRUE)
a<-table.element(a,'95% LB',1,header=TRUE)
a<-table.element(a,'95% UB',1,header=TRUE)
a<-table.element(a,'p-value
(H0: Y[t] = F[t])',1,header=TRUE)
a<-table.element(a,'P(F[t]>Y[t-1])',1,header=TRUE)
a<-table.element(a,'P(F[t]>Y[t-s])',1,header=TRUE)
mylab <- paste('P(F[t]>Y[',nx,sep='')
mylab <- paste(mylab,'])',sep='')
a<-table.element(a,mylab,1,header=TRUE)
a<-table.row.end(a)
for (i in (nx-par5):nx) {
a<-table.row.start(a)
a<-table.element(a,i,header=TRUE)
a<-table.element(a,x[i])
a<-table.element(a,'-')
a<-table.row.end(a)
}
for (i in 1:fx) {
a<-table.row.start(a)
a<-table.element(a,nx+i,header=TRUE)
a<-table.element(a,round(x[nx+i],4))
a<-table.element(a,round(forecast$pred[i],4))
a<-table.element(a,round(lb[i],4))
a<-table.element(a,round(ub[i],4))
a<-table.element(a,round((1-prob.pval[i]),4))
a<-table.element(a,round((1-prob.dec[i]),4))
a<-table.element(a,round((1-prob.sdec[i]),4))
a<-table.element(a,round((1-prob.ldec[i]),4))
a<-table.row.end(a)
}
a<-table.end(a)
table.save(a,file='mytable.tab')
a<-table.start()
a<-table.row.start(a)
a<-table.element(a,'Univariate ARIMA Extrapolation Forecast Performance',7,TRUE)
a<-table.row.end(a)
a<-table.row.start(a)
a<-table.element(a,'time',1,header=TRUE)
a<-table.element(a,'% S.E.',1,header=TRUE)
a<-table.element(a,'PE',1,header=TRUE)
a<-table.element(a,'MAPE',1,header=TRUE)
a<-table.element(a,'Sq.E',1,header=TRUE)
a<-table.element(a,'MSE',1,header=TRUE)
a<-table.element(a,'RMSE',1,header=TRUE)
a<-table.row.end(a)
for (i in 1:fx) {
a<-table.row.start(a)
a<-table.element(a,nx+i,header=TRUE)
a<-table.element(a,round(perc.se[i],4))
a<-table.element(a,round(perf.pe[i],4))
a<-table.element(a,round(perf.mape1[i],4))
a<-table.element(a,round(perf.se[i],4))
a<-table.element(a,round(perf.mse1[i],4))
a<-table.element(a,round(perf.rmse[i],4))
a<-table.row.end(a)
}
a<-table.end(a)
table.save(a,file='mytable1.tab')