Free Statistics

of Irreproducible Research!

Author's title

Author*The author of this computation has been verified*
R Software Modulerwasp_exponentialsmoothing.wasp
Title produced by softwareExponential Smoothing
Date of computationSat, 24 Nov 2012 17:32:33 -0500
Cite this page as followsStatistical Computations at FreeStatistics.org, Office for Research Development and Education, URL https://freestatistics.org/blog/index.php?v=date/2012/Nov/24/t1353796372nj4slgcqelidvkq.htm/, Retrieved Sun, 28 Apr 2024 18:59:15 +0000
Statistical Computations at FreeStatistics.org, Office for Research Development and Education, URL https://freestatistics.org/blog/index.php?pk=192530, Retrieved Sun, 28 Apr 2024 18:59:15 +0000
QR Codes:

Original text written by user:
IsPrivate?No (this computation is public)
User-defined keywords
Estimated Impact112
Family? (F = Feedback message, R = changed R code, M = changed R Module, P = changed Parameters, D = changed Data)
-     [Exponential Smoothing] [HPC Retail Sales] [2008-03-10 17:43:04] [74be16979710d4c4e7c6647856088456]
- RM D  [Exponential Smoothing] [...] [2012-11-24 22:27:08] [0883bf8f4217d775edf6393676d58a73]
- R PD      [Exponential Smoothing] [...] [2012-11-24 22:32:33] [0ce3a3cc7b36ec2616d0d876d7c7ef2d] [Current]
-   P         [Exponential Smoothing] [...] [2012-11-24 22:35:06] [0883bf8f4217d775edf6393676d58a73]
Feedback Forum

Post a new message
Dataseries X:
1.2999
1.3074
1.3242
1.3516
1.3511
1.3419
1.3716
1.3622
1.3896
1.4227
1.4684
1.457
1.4718
1.4748
1.5527
1.5751
1.5557
1.5553
1.577
1.4975
1.437
1.3322
1.2732
1.3449
1.3239
1.2785
1.305
1.319
1.365
1.4016
1.4088
1.4268
1.4562
1.4816
1.4914
1.4614
1.4272
1.3686
1.3569
1.3406
1.2565
1.2209
1.277
1.2894
1.3067
1.3898
1.3661
1.322
1.336
1.3649
1.3999
1.4442
1.4349
1.4388
1.4264
1.4343
1.377
1.3706
1.3556
1.3179


Summary of computational transaction
Raw Inputview raw input (R code)
Raw Outputview raw output of R engine
Computing time3 seconds
R Server'Sir Maurice George Kendall' @ kendall.wessa.net

\begin{tabular}{lllllllll}
\hline
Summary of computational transaction \tabularnewline
Raw Input & view raw input (R code)  \tabularnewline
Raw Output & view raw output of R engine  \tabularnewline
Computing time & 3 seconds \tabularnewline
R Server & 'Sir Maurice George Kendall' @ kendall.wessa.net \tabularnewline
\hline
\end{tabular}
%Source: https://freestatistics.org/blog/index.php?pk=192530&T=0

[TABLE]
[ROW][C]Summary of computational transaction[/C][/ROW]
[ROW][C]Raw Input[/C][C]view raw input (R code) [/C][/ROW]
[ROW][C]Raw Output[/C][C]view raw output of R engine [/C][/ROW]
[ROW][C]Computing time[/C][C]3 seconds[/C][/ROW]
[ROW][C]R Server[/C][C]'Sir Maurice George Kendall' @ kendall.wessa.net[/C][/ROW]
[/TABLE]
Source: https://freestatistics.org/blog/index.php?pk=192530&T=0

Globally Unique Identifier (entire table): ba.freestatistics.org/blog/index.php?pk=192530&T=0

As an alternative you can also use a QR Code:  

The GUIDs for individual cells are displayed in the table below:

Summary of computational transaction
Raw Inputview raw input (R code)
Raw Outputview raw output of R engine
Computing time3 seconds
R Server'Sir Maurice George Kendall' @ kendall.wessa.net


Estimated Parameters of Exponential Smoothing
ParameterValue
alpha1
beta0.0154924408479368
gamma0

\begin{tabular}{lllllllll}
\hline
Estimated Parameters of Exponential Smoothing \tabularnewline
Parameter & Value \tabularnewline
alpha & 1 \tabularnewline
beta & 0.0154924408479368 \tabularnewline
gamma & 0 \tabularnewline
\hline
\end{tabular}
%Source: https://freestatistics.org/blog/index.php?pk=192530&T=1

[TABLE]
[ROW][C]Estimated Parameters of Exponential Smoothing[/C][/ROW]
[ROW][C]Parameter[/C][C]Value[/C][/ROW]
[ROW][C]alpha[/C][C]1[/C][/ROW]
[ROW][C]beta[/C][C]0.0154924408479368[/C][/ROW]
[ROW][C]gamma[/C][C]0[/C][/ROW]
[/TABLE]
Source: https://freestatistics.org/blog/index.php?pk=192530&T=1

Globally Unique Identifier (entire table): ba.freestatistics.org/blog/index.php?pk=192530&T=1

As an alternative you can also use a QR Code:  

The GUIDs for individual cells are displayed in the table below:

Estimated Parameters of Exponential Smoothing
ParameterValue
alpha1
beta0.0154924408479368
gamma0


Interpolation Forecasts of Exponential Smoothing
tObservedFittedResiduals
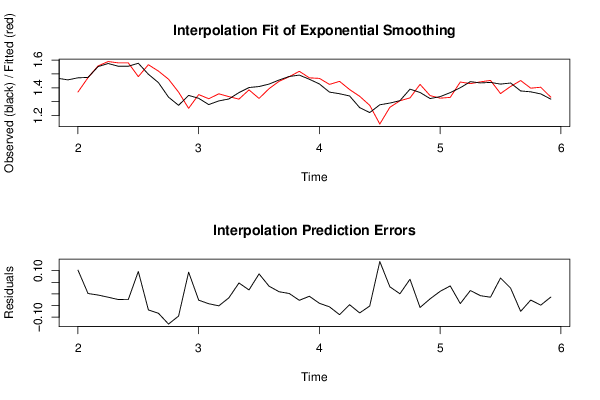
131.47181.369221688034190.102578311965812
141.47481.473086886565610.00171311343439018
151.55271.55759676020749-0.00489676020749075
161.57511.58932923077296-0.0142292307729635
171.55571.57981711859024-0.0241171185902351
181.55531.57994348555705-0.0246434855570534
191.5771.480532531148110.0964674688518932
201.49751.56641454770304-0.0689145477030444
211.4371.52028855981586-0.0832885598158597
221.33221.4618607167296-0.129660716729603
231.27321.3686477890787-0.0954477890787013
241.34491.251489903185670.093410096814333
251.32391.35080372025183-0.0269037202518294
261.27851.32084108262391-0.0423410826239057
271.3051.35626844923925-0.0512684492392497
281.3191.33588250915538-0.016882509155379
291.3651.317929291214260.0470707087857418
301.40161.384558531385790.0170414686142084
311.40881.322793378663590.0860066213364075
321.42681.394013331157180.0327866688428229
331.45621.446962943351490.00923705664850738
341.48161.479868547905230.0017314520947711
351.49141.51889120565772-0.0274912056577208
361.46141.47158613311356-0.010186133113564
371.42721.4675949917155-0.0403949917154993
381.36861.42422334136246-0.0556233413624612
391.35691.44624493336997-0.089344933369971
401.34061.38706909560801-0.0464690956080078
411.25651.33835750922638-0.0818575092263774
421.22091.27288933660673-0.0519893366067279
431.2771.137854728217960.139145271782042
441.28941.258797928110310.0306020718896893
451.30671.306113695565550.000586304434446738
461.38981.326785278852320.0630147211476766
471.36611.42445736402559-0.0583573640255854
481.3221.34317409934871-0.0211740993487115
491.3361.324912727533710.0110872724662903
501.36491.330538663113230.0343613368867743
511.39991.44145433742573-0.0415543374257326
521.44421.429718892644520.0144811073554769
531.43491.44255157367697-0.00765157367697378
541.43881.45303303212439-0.0142330321243895
551.42641.358083361049450.0683166389505505
561.43431.409429252537320.0248707474626801
571.3771.4521562277879-0.0751562277878961
581.37061.39705437437454-0.0264543743745389
591.35561.4038403648777-0.0482403648777048
601.31791.33141383721169-0.0135138372116876

\begin{tabular}{lllllllll}
\hline
Interpolation Forecasts of Exponential Smoothing \tabularnewline
t & Observed & Fitted & Residuals \tabularnewline
13 & 1.4718 & 1.36922168803419 & 0.102578311965812 \tabularnewline
14 & 1.4748 & 1.47308688656561 & 0.00171311343439018 \tabularnewline
15 & 1.5527 & 1.55759676020749 & -0.00489676020749075 \tabularnewline
16 & 1.5751 & 1.58932923077296 & -0.0142292307729635 \tabularnewline
17 & 1.5557 & 1.57981711859024 & -0.0241171185902351 \tabularnewline
18 & 1.5553 & 1.57994348555705 & -0.0246434855570534 \tabularnewline
19 & 1.577 & 1.48053253114811 & 0.0964674688518932 \tabularnewline
20 & 1.4975 & 1.56641454770304 & -0.0689145477030444 \tabularnewline
21 & 1.437 & 1.52028855981586 & -0.0832885598158597 \tabularnewline
22 & 1.3322 & 1.4618607167296 & -0.129660716729603 \tabularnewline
23 & 1.2732 & 1.3686477890787 & -0.0954477890787013 \tabularnewline
24 & 1.3449 & 1.25148990318567 & 0.093410096814333 \tabularnewline
25 & 1.3239 & 1.35080372025183 & -0.0269037202518294 \tabularnewline
26 & 1.2785 & 1.32084108262391 & -0.0423410826239057 \tabularnewline
27 & 1.305 & 1.35626844923925 & -0.0512684492392497 \tabularnewline
28 & 1.319 & 1.33588250915538 & -0.016882509155379 \tabularnewline
29 & 1.365 & 1.31792929121426 & 0.0470707087857418 \tabularnewline
30 & 1.4016 & 1.38455853138579 & 0.0170414686142084 \tabularnewline
31 & 1.4088 & 1.32279337866359 & 0.0860066213364075 \tabularnewline
32 & 1.4268 & 1.39401333115718 & 0.0327866688428229 \tabularnewline
33 & 1.4562 & 1.44696294335149 & 0.00923705664850738 \tabularnewline
34 & 1.4816 & 1.47986854790523 & 0.0017314520947711 \tabularnewline
35 & 1.4914 & 1.51889120565772 & -0.0274912056577208 \tabularnewline
36 & 1.4614 & 1.47158613311356 & -0.010186133113564 \tabularnewline
37 & 1.4272 & 1.4675949917155 & -0.0403949917154993 \tabularnewline
38 & 1.3686 & 1.42422334136246 & -0.0556233413624612 \tabularnewline
39 & 1.3569 & 1.44624493336997 & -0.089344933369971 \tabularnewline
40 & 1.3406 & 1.38706909560801 & -0.0464690956080078 \tabularnewline
41 & 1.2565 & 1.33835750922638 & -0.0818575092263774 \tabularnewline
42 & 1.2209 & 1.27288933660673 & -0.0519893366067279 \tabularnewline
43 & 1.277 & 1.13785472821796 & 0.139145271782042 \tabularnewline
44 & 1.2894 & 1.25879792811031 & 0.0306020718896893 \tabularnewline
45 & 1.3067 & 1.30611369556555 & 0.000586304434446738 \tabularnewline
46 & 1.3898 & 1.32678527885232 & 0.0630147211476766 \tabularnewline
47 & 1.3661 & 1.42445736402559 & -0.0583573640255854 \tabularnewline
48 & 1.322 & 1.34317409934871 & -0.0211740993487115 \tabularnewline
49 & 1.336 & 1.32491272753371 & 0.0110872724662903 \tabularnewline
50 & 1.3649 & 1.33053866311323 & 0.0343613368867743 \tabularnewline
51 & 1.3999 & 1.44145433742573 & -0.0415543374257326 \tabularnewline
52 & 1.4442 & 1.42971889264452 & 0.0144811073554769 \tabularnewline
53 & 1.4349 & 1.44255157367697 & -0.00765157367697378 \tabularnewline
54 & 1.4388 & 1.45303303212439 & -0.0142330321243895 \tabularnewline
55 & 1.4264 & 1.35808336104945 & 0.0683166389505505 \tabularnewline
56 & 1.4343 & 1.40942925253732 & 0.0248707474626801 \tabularnewline
57 & 1.377 & 1.4521562277879 & -0.0751562277878961 \tabularnewline
58 & 1.3706 & 1.39705437437454 & -0.0264543743745389 \tabularnewline
59 & 1.3556 & 1.4038403648777 & -0.0482403648777048 \tabularnewline
60 & 1.3179 & 1.33141383721169 & -0.0135138372116876 \tabularnewline
\hline
\end{tabular}
%Source: https://freestatistics.org/blog/index.php?pk=192530&T=2

[TABLE]
[ROW][C]Interpolation Forecasts of Exponential Smoothing[/C][/ROW]
[ROW][C]t[/C][C]Observed[/C][C]Fitted[/C][C]Residuals[/C][/ROW]
[ROW][C]13[/C][C]1.4718[/C][C]1.36922168803419[/C][C]0.102578311965812[/C][/ROW]
[ROW][C]14[/C][C]1.4748[/C][C]1.47308688656561[/C][C]0.00171311343439018[/C][/ROW]
[ROW][C]15[/C][C]1.5527[/C][C]1.55759676020749[/C][C]-0.00489676020749075[/C][/ROW]
[ROW][C]16[/C][C]1.5751[/C][C]1.58932923077296[/C][C]-0.0142292307729635[/C][/ROW]
[ROW][C]17[/C][C]1.5557[/C][C]1.57981711859024[/C][C]-0.0241171185902351[/C][/ROW]
[ROW][C]18[/C][C]1.5553[/C][C]1.57994348555705[/C][C]-0.0246434855570534[/C][/ROW]
[ROW][C]19[/C][C]1.577[/C][C]1.48053253114811[/C][C]0.0964674688518932[/C][/ROW]
[ROW][C]20[/C][C]1.4975[/C][C]1.56641454770304[/C][C]-0.0689145477030444[/C][/ROW]
[ROW][C]21[/C][C]1.437[/C][C]1.52028855981586[/C][C]-0.0832885598158597[/C][/ROW]
[ROW][C]22[/C][C]1.3322[/C][C]1.4618607167296[/C][C]-0.129660716729603[/C][/ROW]
[ROW][C]23[/C][C]1.2732[/C][C]1.3686477890787[/C][C]-0.0954477890787013[/C][/ROW]
[ROW][C]24[/C][C]1.3449[/C][C]1.25148990318567[/C][C]0.093410096814333[/C][/ROW]
[ROW][C]25[/C][C]1.3239[/C][C]1.35080372025183[/C][C]-0.0269037202518294[/C][/ROW]
[ROW][C]26[/C][C]1.2785[/C][C]1.32084108262391[/C][C]-0.0423410826239057[/C][/ROW]
[ROW][C]27[/C][C]1.305[/C][C]1.35626844923925[/C][C]-0.0512684492392497[/C][/ROW]
[ROW][C]28[/C][C]1.319[/C][C]1.33588250915538[/C][C]-0.016882509155379[/C][/ROW]
[ROW][C]29[/C][C]1.365[/C][C]1.31792929121426[/C][C]0.0470707087857418[/C][/ROW]
[ROW][C]30[/C][C]1.4016[/C][C]1.38455853138579[/C][C]0.0170414686142084[/C][/ROW]
[ROW][C]31[/C][C]1.4088[/C][C]1.32279337866359[/C][C]0.0860066213364075[/C][/ROW]
[ROW][C]32[/C][C]1.4268[/C][C]1.39401333115718[/C][C]0.0327866688428229[/C][/ROW]
[ROW][C]33[/C][C]1.4562[/C][C]1.44696294335149[/C][C]0.00923705664850738[/C][/ROW]
[ROW][C]34[/C][C]1.4816[/C][C]1.47986854790523[/C][C]0.0017314520947711[/C][/ROW]
[ROW][C]35[/C][C]1.4914[/C][C]1.51889120565772[/C][C]-0.0274912056577208[/C][/ROW]
[ROW][C]36[/C][C]1.4614[/C][C]1.47158613311356[/C][C]-0.010186133113564[/C][/ROW]
[ROW][C]37[/C][C]1.4272[/C][C]1.4675949917155[/C][C]-0.0403949917154993[/C][/ROW]
[ROW][C]38[/C][C]1.3686[/C][C]1.42422334136246[/C][C]-0.0556233413624612[/C][/ROW]
[ROW][C]39[/C][C]1.3569[/C][C]1.44624493336997[/C][C]-0.089344933369971[/C][/ROW]
[ROW][C]40[/C][C]1.3406[/C][C]1.38706909560801[/C][C]-0.0464690956080078[/C][/ROW]
[ROW][C]41[/C][C]1.2565[/C][C]1.33835750922638[/C][C]-0.0818575092263774[/C][/ROW]
[ROW][C]42[/C][C]1.2209[/C][C]1.27288933660673[/C][C]-0.0519893366067279[/C][/ROW]
[ROW][C]43[/C][C]1.277[/C][C]1.13785472821796[/C][C]0.139145271782042[/C][/ROW]
[ROW][C]44[/C][C]1.2894[/C][C]1.25879792811031[/C][C]0.0306020718896893[/C][/ROW]
[ROW][C]45[/C][C]1.3067[/C][C]1.30611369556555[/C][C]0.000586304434446738[/C][/ROW]
[ROW][C]46[/C][C]1.3898[/C][C]1.32678527885232[/C][C]0.0630147211476766[/C][/ROW]
[ROW][C]47[/C][C]1.3661[/C][C]1.42445736402559[/C][C]-0.0583573640255854[/C][/ROW]
[ROW][C]48[/C][C]1.322[/C][C]1.34317409934871[/C][C]-0.0211740993487115[/C][/ROW]
[ROW][C]49[/C][C]1.336[/C][C]1.32491272753371[/C][C]0.0110872724662903[/C][/ROW]
[ROW][C]50[/C][C]1.3649[/C][C]1.33053866311323[/C][C]0.0343613368867743[/C][/ROW]
[ROW][C]51[/C][C]1.3999[/C][C]1.44145433742573[/C][C]-0.0415543374257326[/C][/ROW]
[ROW][C]52[/C][C]1.4442[/C][C]1.42971889264452[/C][C]0.0144811073554769[/C][/ROW]
[ROW][C]53[/C][C]1.4349[/C][C]1.44255157367697[/C][C]-0.00765157367697378[/C][/ROW]
[ROW][C]54[/C][C]1.4388[/C][C]1.45303303212439[/C][C]-0.0142330321243895[/C][/ROW]
[ROW][C]55[/C][C]1.4264[/C][C]1.35808336104945[/C][C]0.0683166389505505[/C][/ROW]
[ROW][C]56[/C][C]1.4343[/C][C]1.40942925253732[/C][C]0.0248707474626801[/C][/ROW]
[ROW][C]57[/C][C]1.377[/C][C]1.4521562277879[/C][C]-0.0751562277878961[/C][/ROW]
[ROW][C]58[/C][C]1.3706[/C][C]1.39705437437454[/C][C]-0.0264543743745389[/C][/ROW]
[ROW][C]59[/C][C]1.3556[/C][C]1.4038403648777[/C][C]-0.0482403648777048[/C][/ROW]
[ROW][C]60[/C][C]1.3179[/C][C]1.33141383721169[/C][C]-0.0135138372116876[/C][/ROW]
[/TABLE]
Source: https://freestatistics.org/blog/index.php?pk=192530&T=2

Globally Unique Identifier (entire table): ba.freestatistics.org/blog/index.php?pk=192530&T=2

As an alternative you can also use a QR Code:  

The GUIDs for individual cells are displayed in the table below:

Interpolation Forecasts of Exponential Smoothing
tObservedFittedResiduals
131.47181.369221688034190.102578311965812
141.47481.473086886565610.00171311343439018
151.55271.55759676020749-0.00489676020749075
161.57511.58932923077296-0.0142292307729635
171.55571.57981711859024-0.0241171185902351
181.55531.57994348555705-0.0246434855570534
191.5771.480532531148110.0964674688518932
201.49751.56641454770304-0.0689145477030444
211.4371.52028855981586-0.0832885598158597
221.33221.4618607167296-0.129660716729603
231.27321.3686477890787-0.0954477890787013
241.34491.251489903185670.093410096814333
251.32391.35080372025183-0.0269037202518294
261.27851.32084108262391-0.0423410826239057
271.3051.35626844923925-0.0512684492392497
281.3191.33588250915538-0.016882509155379
291.3651.317929291214260.0470707087857418
301.40161.384558531385790.0170414686142084
311.40881.322793378663590.0860066213364075
321.42681.394013331157180.0327866688428229
331.45621.446962943351490.00923705664850738
341.48161.479868547905230.0017314520947711
351.49141.51889120565772-0.0274912056577208
361.46141.47158613311356-0.010186133113564
371.42721.4675949917155-0.0403949917154993
381.36861.42422334136246-0.0556233413624612
391.35691.44624493336997-0.089344933369971
401.34061.38706909560801-0.0464690956080078
411.25651.33835750922638-0.0818575092263774
421.22091.27288933660673-0.0519893366067279
431.2771.137854728217960.139145271782042
441.28941.258797928110310.0306020718896893
451.30671.306113695565550.000586304434446738
461.38981.326785278852320.0630147211476766
471.36611.42445736402559-0.0583573640255854
481.3221.34317409934871-0.0211740993487115
491.3361.324912727533710.0110872724662903
501.36491.330538663113230.0343613368867743
511.39991.44145433742573-0.0415543374257326
521.44421.429718892644520.0144811073554769
531.43491.44255157367697-0.00765157367697378
541.43881.45303303212439-0.0142330321243895
551.42641.358083361049450.0683166389505505
561.43431.409429252537320.0248707474626801
571.3771.4521562277879-0.0751562277878961
581.37061.39705437437454-0.0264543743745389
591.35561.4038403648777-0.0482403648777048
601.31791.33141383721169-0.0135138372116876


Extrapolation Forecasts of Exponential Smoothing
tForecast95% Lower Bound95% Upper Bound
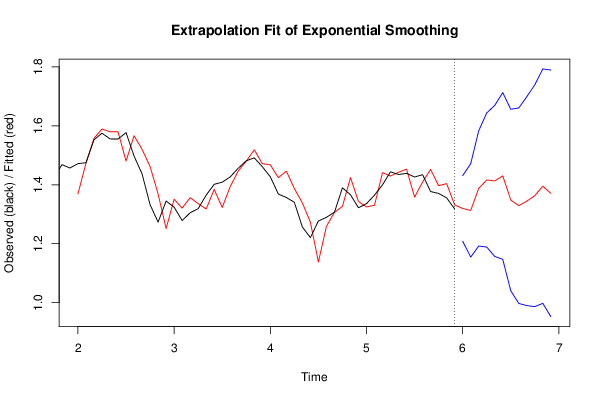
611.319671141554721.208453105103021.43088917800643
621.312896449776111.154387339240821.47140556031141
631.387605091330841.19197023452531.58323994813637
641.416222066218891.188584269309351.64385986312843
651.413147374440281.156692731273171.6696020176074
661.429972682661671.146902042743791.71304332257956
671.34816882421641.040102412784971.65623523564782
681.329052465771120.9972351941683921.66086973737385
691.344377773992510.9897959237037271.6989596242813
701.36306558221390.9865186236031411.73961254082466
711.395349223768630.9974967260838281.79320172145342
721.370953698656680.9523474159696751.78955998134369

\begin{tabular}{lllllllll}
\hline
Extrapolation Forecasts of Exponential Smoothing \tabularnewline
t & Forecast & 95% Lower Bound & 95% Upper Bound \tabularnewline
61 & 1.31967114155472 & 1.20845310510302 & 1.43088917800643 \tabularnewline
62 & 1.31289644977611 & 1.15438733924082 & 1.47140556031141 \tabularnewline
63 & 1.38760509133084 & 1.1919702345253 & 1.58323994813637 \tabularnewline
64 & 1.41622206621889 & 1.18858426930935 & 1.64385986312843 \tabularnewline
65 & 1.41314737444028 & 1.15669273127317 & 1.6696020176074 \tabularnewline
66 & 1.42997268266167 & 1.14690204274379 & 1.71304332257956 \tabularnewline
67 & 1.3481688242164 & 1.04010241278497 & 1.65623523564782 \tabularnewline
68 & 1.32905246577112 & 0.997235194168392 & 1.66086973737385 \tabularnewline
69 & 1.34437777399251 & 0.989795923703727 & 1.6989596242813 \tabularnewline
70 & 1.3630655822139 & 0.986518623603141 & 1.73961254082466 \tabularnewline
71 & 1.39534922376863 & 0.997496726083828 & 1.79320172145342 \tabularnewline
72 & 1.37095369865668 & 0.952347415969675 & 1.78955998134369 \tabularnewline
\hline
\end{tabular}
%Source: https://freestatistics.org/blog/index.php?pk=192530&T=3

[TABLE]
[ROW][C]Extrapolation Forecasts of Exponential Smoothing[/C][/ROW]
[ROW][C]t[/C][C]Forecast[/C][C]95% Lower Bound[/C][C]95% Upper Bound[/C][/ROW]
[ROW][C]61[/C][C]1.31967114155472[/C][C]1.20845310510302[/C][C]1.43088917800643[/C][/ROW]
[ROW][C]62[/C][C]1.31289644977611[/C][C]1.15438733924082[/C][C]1.47140556031141[/C][/ROW]
[ROW][C]63[/C][C]1.38760509133084[/C][C]1.1919702345253[/C][C]1.58323994813637[/C][/ROW]
[ROW][C]64[/C][C]1.41622206621889[/C][C]1.18858426930935[/C][C]1.64385986312843[/C][/ROW]
[ROW][C]65[/C][C]1.41314737444028[/C][C]1.15669273127317[/C][C]1.6696020176074[/C][/ROW]
[ROW][C]66[/C][C]1.42997268266167[/C][C]1.14690204274379[/C][C]1.71304332257956[/C][/ROW]
[ROW][C]67[/C][C]1.3481688242164[/C][C]1.04010241278497[/C][C]1.65623523564782[/C][/ROW]
[ROW][C]68[/C][C]1.32905246577112[/C][C]0.997235194168392[/C][C]1.66086973737385[/C][/ROW]
[ROW][C]69[/C][C]1.34437777399251[/C][C]0.989795923703727[/C][C]1.6989596242813[/C][/ROW]
[ROW][C]70[/C][C]1.3630655822139[/C][C]0.986518623603141[/C][C]1.73961254082466[/C][/ROW]
[ROW][C]71[/C][C]1.39534922376863[/C][C]0.997496726083828[/C][C]1.79320172145342[/C][/ROW]
[ROW][C]72[/C][C]1.37095369865668[/C][C]0.952347415969675[/C][C]1.78955998134369[/C][/ROW]
[/TABLE]
Source: https://freestatistics.org/blog/index.php?pk=192530&T=3

Globally Unique Identifier (entire table): ba.freestatistics.org/blog/index.php?pk=192530&T=3

As an alternative you can also use a QR Code:  

The GUIDs for individual cells are displayed in the table below:

Extrapolation Forecasts of Exponential Smoothing
tForecast95% Lower Bound95% Upper Bound
611.319671141554721.208453105103021.43088917800643
621.312896449776111.154387339240821.47140556031141
631.387605091330841.19197023452531.58323994813637
641.416222066218891.188584269309351.64385986312843
651.413147374440281.156692731273171.6696020176074
661.429972682661671.146902042743791.71304332257956
671.34816882421641.040102412784971.65623523564782
681.329052465771120.9972351941683921.66086973737385
691.344377773992510.9897959237037271.6989596242813
701.36306558221390.9865186236031411.73961254082466
711.395349223768630.9974967260838281.79320172145342
721.370953698656680.9523474159696751.78955998134369


Parameters (Session):
par1 = 12 ; par2 = Triple ; par3 = additive ;
Parameters (R input):
par1 = 12 ; par2 = Triple ; par3 = additive ;
R code (references can be found in the software module):
par1 <- as.numeric(par1)
if (par2 == 'Single') K <- 1
if (par2 == 'Double') K <- 2
if (par2 == 'Triple') K <- par1
nx <- length(x)
nxmK <- nx - K
x <- ts(x, frequency = par1)
if (par2 == 'Single') fit <- HoltWinters(x, gamma=F, beta=F)
if (par2 == 'Double') fit <- HoltWinters(x, gamma=F)
if (par2 == 'Triple') fit <- HoltWinters(x, seasonal=par3)
fit
myresid <- x - fit$fitted[,'xhat']
bitmap(file='test1.png')
op <- par(mfrow=c(2,1))
plot(fit,ylab='Observed (black) / Fitted (red)',main='Interpolation Fit of Exponential Smoothing')
plot(myresid,ylab='Residuals',main='Interpolation Prediction Errors')
par(op)
dev.off()
bitmap(file='test2.png')
p <- predict(fit, par1, prediction.interval=TRUE)
np <- length(p[,1])
plot(fit,p,ylab='Observed (black) / Fitted (red)',main='Extrapolation Fit of Exponential Smoothing')
dev.off()
bitmap(file='test3.png')
op <- par(mfrow = c(2,2))
acf(as.numeric(myresid),lag.max = nx/2,main='Residual ACF')
spectrum(myresid,main='Residals Periodogram')
cpgram(myresid,main='Residal Cumulative Periodogram')
qqnorm(myresid,main='Residual Normal QQ Plot')
qqline(myresid)
par(op)
dev.off()
load(file='createtable')
a<-table.start()
a<-table.row.start(a)
a<-table.element(a,'Estimated Parameters of Exponential Smoothing',2,TRUE)
a<-table.row.end(a)
a<-table.row.start(a)
a<-table.element(a,'Parameter',header=TRUE)
a<-table.element(a,'Value',header=TRUE)
a<-table.row.end(a)
a<-table.row.start(a)
a<-table.element(a,'alpha',header=TRUE)
a<-table.element(a,fit$alpha)
a<-table.row.end(a)
a<-table.row.start(a)
a<-table.element(a,'beta',header=TRUE)
a<-table.element(a,fit$beta)
a<-table.row.end(a)
a<-table.row.start(a)
a<-table.element(a,'gamma',header=TRUE)
a<-table.element(a,fit$gamma)
a<-table.row.end(a)
a<-table.end(a)
table.save(a,file='mytable.tab')
a<-table.start()
a<-table.row.start(a)
a<-table.element(a,'Interpolation Forecasts of Exponential Smoothing',4,TRUE)
a<-table.row.end(a)
a<-table.row.start(a)
a<-table.element(a,'t',header=TRUE)
a<-table.element(a,'Observed',header=TRUE)
a<-table.element(a,'Fitted',header=TRUE)
a<-table.element(a,'Residuals',header=TRUE)
a<-table.row.end(a)
for (i in 1:nxmK) {
a<-table.row.start(a)
a<-table.element(a,i+K,header=TRUE)
a<-table.element(a,x[i+K])
a<-table.element(a,fit$fitted[i,'xhat'])
a<-table.element(a,myresid[i])
a<-table.row.end(a)
}
a<-table.end(a)
table.save(a,file='mytable1.tab')
a<-table.start()
a<-table.row.start(a)
a<-table.element(a,'Extrapolation Forecasts of Exponential Smoothing',4,TRUE)
a<-table.row.end(a)
a<-table.row.start(a)
a<-table.element(a,'t',header=TRUE)
a<-table.element(a,'Forecast',header=TRUE)
a<-table.element(a,'95% Lower Bound',header=TRUE)
a<-table.element(a,'95% Upper Bound',header=TRUE)
a<-table.row.end(a)
for (i in 1:np) {
a<-table.row.start(a)
a<-table.element(a,nx+i,header=TRUE)
a<-table.element(a,p[i,'fit'])
a<-table.element(a,p[i,'lwr'])
a<-table.element(a,p[i,'upr'])
a<-table.row.end(a)
}
a<-table.end(a)
table.save(a,file='mytable2.tab')