Free Statistics

of Irreproducible Research!

Author's title

Author*The author of this computation has been verified*
R Software Modulerwasp_exponentialsmoothing.wasp
Title produced by softwareExponential Smoothing
Date of computationSat, 24 Nov 2012 17:35:06 -0500
Cite this page as followsStatistical Computations at FreeStatistics.org, Office for Research Development and Education, URL https://freestatistics.org/blog/index.php?v=date/2012/Nov/24/t1353796526yp71bepf7uivdgk.htm/, Retrieved Mon, 29 Apr 2024 01:10:58 +0000
Statistical Computations at FreeStatistics.org, Office for Research Development and Education, URL https://freestatistics.org/blog/index.php?pk=192531, Retrieved Mon, 29 Apr 2024 01:10:58 +0000
QR Codes:

Original text written by user:
IsPrivate?No (this computation is public)
User-defined keywords
Estimated Impact122
Family? (F = Feedback message, R = changed R code, M = changed R Module, P = changed Parameters, D = changed Data)
-     [Exponential Smoothing] [HPC Retail Sales] [2008-03-10 17:43:04] [74be16979710d4c4e7c6647856088456]
- RM D  [Exponential Smoothing] [...] [2012-11-24 22:27:08] [0883bf8f4217d775edf6393676d58a73]
- R PD    [Exponential Smoothing] [...] [2012-11-24 22:32:33] [0883bf8f4217d775edf6393676d58a73]
-   P         [Exponential Smoothing] [...] [2012-11-24 22:35:06] [0ce3a3cc7b36ec2616d0d876d7c7ef2d] [Current]
Feedback Forum

Post a new message
Dataseries X:
1.2999
1.3074
1.3242
1.3516
1.3511
1.3419
1.3716
1.3622
1.3896
1.4227
1.4684
1.457
1.4718
1.4748
1.5527
1.5751
1.5557
1.5553
1.577
1.4975
1.437
1.3322
1.2732
1.3449
1.3239
1.2785
1.305
1.319
1.365
1.4016
1.4088
1.4268
1.4562
1.4816
1.4914
1.4614
1.4272
1.3686
1.3569
1.3406
1.2565
1.2209
1.277
1.2894
1.3067
1.3898
1.3661
1.322
1.336
1.3649
1.3999
1.4442
1.4349
1.4388
1.4264
1.4343
1.377
1.3706
1.3556
1.3179


Summary of computational transaction
Raw Inputview raw input (R code)
Raw Outputview raw output of R engine
Computing time3 seconds
R Server'Sir Ronald Aylmer Fisher' @ fisher.wessa.net

\begin{tabular}{lllllllll}
\hline
Summary of computational transaction \tabularnewline
Raw Input & view raw input (R code)  \tabularnewline
Raw Output & view raw output of R engine  \tabularnewline
Computing time & 3 seconds \tabularnewline
R Server & 'Sir Ronald Aylmer Fisher' @ fisher.wessa.net \tabularnewline
\hline
\end{tabular}
%Source: https://freestatistics.org/blog/index.php?pk=192531&T=0

[TABLE]
[ROW][C]Summary of computational transaction[/C][/ROW]
[ROW][C]Raw Input[/C][C]view raw input (R code) [/C][/ROW]
[ROW][C]Raw Output[/C][C]view raw output of R engine [/C][/ROW]
[ROW][C]Computing time[/C][C]3 seconds[/C][/ROW]
[ROW][C]R Server[/C][C]'Sir Ronald Aylmer Fisher' @ fisher.wessa.net[/C][/ROW]
[/TABLE]
Source: https://freestatistics.org/blog/index.php?pk=192531&T=0

Globally Unique Identifier (entire table): ba.freestatistics.org/blog/index.php?pk=192531&T=0

As an alternative you can also use a QR Code:  

The GUIDs for individual cells are displayed in the table below:

Summary of computational transaction
Raw Inputview raw input (R code)
Raw Outputview raw output of R engine
Computing time3 seconds
R Server'Sir Ronald Aylmer Fisher' @ fisher.wessa.net


Estimated Parameters of Exponential Smoothing
ParameterValue
alpha1
beta0.0186732471122546
gammaFALSE

\begin{tabular}{lllllllll}
\hline
Estimated Parameters of Exponential Smoothing \tabularnewline
Parameter & Value \tabularnewline
alpha & 1 \tabularnewline
beta & 0.0186732471122546 \tabularnewline
gamma & FALSE \tabularnewline
\hline
\end{tabular}
%Source: https://freestatistics.org/blog/index.php?pk=192531&T=1

[TABLE]
[ROW][C]Estimated Parameters of Exponential Smoothing[/C][/ROW]
[ROW][C]Parameter[/C][C]Value[/C][/ROW]
[ROW][C]alpha[/C][C]1[/C][/ROW]
[ROW][C]beta[/C][C]0.0186732471122546[/C][/ROW]
[ROW][C]gamma[/C][C]FALSE[/C][/ROW]
[/TABLE]
Source: https://freestatistics.org/blog/index.php?pk=192531&T=1

Globally Unique Identifier (entire table): ba.freestatistics.org/blog/index.php?pk=192531&T=1

As an alternative you can also use a QR Code:  

The GUIDs for individual cells are displayed in the table below:

Estimated Parameters of Exponential Smoothing
ParameterValue
alpha1
beta0.0186732471122546
gammaFALSE


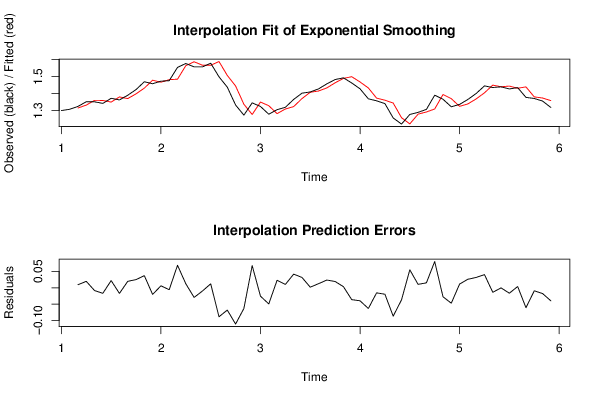
Interpolation Forecasts of Exponential Smoothing
tObservedFittedResiduals
31.32421.31490.00930000000000031
41.35161.331873661198140.019726338801856
51.35111.35964201599721-0.00854201599721094
61.34191.35898250882166-0.017082508821658
71.37161.349463522913130.0221364770868657
81.36221.37957688281997-0.0173768828199719
91.38961.369852399993030.0197476000069661
101.42271.397621151807840.0250788481921622
111.46841.431189455337420.037210544662579
121.4571.47758429703309-0.0205842970330867
131.47181.465799921367960.00600007863204399
141.47481.48071196231895-0.00591196231894497
151.55271.483601566785650.0690984332143547
161.57511.562791858904130.0123081410958736
171.55571.5854216918643-0.029721691864302
181.55531.56546669136753-0.0101666913675258
191.5771.564876846227310.0121231537726942
201.49751.58680322487348-0.0893032248734831
211.4371.5056356436875-0.0686356436874993
221.33221.44385399335221-0.111653993352214
231.27321.33696905074328-0.063769050743278
241.34491.276778275500640.0681217244993648
251.32391.34975032929592-0.0258503292959245
261.27851.32826761970905-0.0497676197090486
271.3051.281938296648030.0230617033519671
281.3191.308868933533550.0101310664664465
291.3651.323058113441190.0419418865588077
301.40161.369841304653260.031758695346741
311.40881.407034342619430.00176565738056844
321.42681.414267313176010.0125326868239855
331.45621.432501339134060.0236986608659406
341.48161.462343870084640.0192561299153615
351.49141.488103444556970.00329655544302643
361.46141.49796500195138-0.0365650019513806
371.42721.46728221463428-0.0400822146342823
381.36861.43233374953561-0.0637337495356101
391.35691.37254363348114-0.0156436334811412
401.34061.36055151604741-0.0199515160474142
411.25651.343878956458-0.0873789564579968
421.22091.25814730761165-0.0372473076116453
431.2771.221851779432350.0551482205676528
441.28941.278981575782810.0104184242171921
451.30671.291576121592740.0151238784072638
461.38981.309158533511530.0806414664884694
471.36611.39376437154276-0.027664371542764
481.3221.36954778789674-0.047547787896741
491.3361.32455991630370.011440083696296
501.36491.338773539813550.0261264601864499
511.39991.368161405660780.0317385943392199
521.44421.403754068275870.0404459317241281
531.43491.44880932515364-0.0139093251536417
541.43881.43924959288788-0.000449592887883155
551.42641.44314119752879-0.0167411975287881
561.43431.430428585010380.0038714149896224
571.3771.43840087689915-0.061400876899153
581.37061.37995432315191-0.00935432315190599
591.35561.37337964756412-0.0177796475641228
601.31791.35804764381159-0.0401476438115889

\begin{tabular}{lllllllll}
\hline
Interpolation Forecasts of Exponential Smoothing \tabularnewline
t & Observed & Fitted & Residuals \tabularnewline
3 & 1.3242 & 1.3149 & 0.00930000000000031 \tabularnewline
4 & 1.3516 & 1.33187366119814 & 0.019726338801856 \tabularnewline
5 & 1.3511 & 1.35964201599721 & -0.00854201599721094 \tabularnewline
6 & 1.3419 & 1.35898250882166 & -0.017082508821658 \tabularnewline
7 & 1.3716 & 1.34946352291313 & 0.0221364770868657 \tabularnewline
8 & 1.3622 & 1.37957688281997 & -0.0173768828199719 \tabularnewline
9 & 1.3896 & 1.36985239999303 & 0.0197476000069661 \tabularnewline
10 & 1.4227 & 1.39762115180784 & 0.0250788481921622 \tabularnewline
11 & 1.4684 & 1.43118945533742 & 0.037210544662579 \tabularnewline
12 & 1.457 & 1.47758429703309 & -0.0205842970330867 \tabularnewline
13 & 1.4718 & 1.46579992136796 & 0.00600007863204399 \tabularnewline
14 & 1.4748 & 1.48071196231895 & -0.00591196231894497 \tabularnewline
15 & 1.5527 & 1.48360156678565 & 0.0690984332143547 \tabularnewline
16 & 1.5751 & 1.56279185890413 & 0.0123081410958736 \tabularnewline
17 & 1.5557 & 1.5854216918643 & -0.029721691864302 \tabularnewline
18 & 1.5553 & 1.56546669136753 & -0.0101666913675258 \tabularnewline
19 & 1.577 & 1.56487684622731 & 0.0121231537726942 \tabularnewline
20 & 1.4975 & 1.58680322487348 & -0.0893032248734831 \tabularnewline
21 & 1.437 & 1.5056356436875 & -0.0686356436874993 \tabularnewline
22 & 1.3322 & 1.44385399335221 & -0.111653993352214 \tabularnewline
23 & 1.2732 & 1.33696905074328 & -0.063769050743278 \tabularnewline
24 & 1.3449 & 1.27677827550064 & 0.0681217244993648 \tabularnewline
25 & 1.3239 & 1.34975032929592 & -0.0258503292959245 \tabularnewline
26 & 1.2785 & 1.32826761970905 & -0.0497676197090486 \tabularnewline
27 & 1.305 & 1.28193829664803 & 0.0230617033519671 \tabularnewline
28 & 1.319 & 1.30886893353355 & 0.0101310664664465 \tabularnewline
29 & 1.365 & 1.32305811344119 & 0.0419418865588077 \tabularnewline
30 & 1.4016 & 1.36984130465326 & 0.031758695346741 \tabularnewline
31 & 1.4088 & 1.40703434261943 & 0.00176565738056844 \tabularnewline
32 & 1.4268 & 1.41426731317601 & 0.0125326868239855 \tabularnewline
33 & 1.4562 & 1.43250133913406 & 0.0236986608659406 \tabularnewline
34 & 1.4816 & 1.46234387008464 & 0.0192561299153615 \tabularnewline
35 & 1.4914 & 1.48810344455697 & 0.00329655544302643 \tabularnewline
36 & 1.4614 & 1.49796500195138 & -0.0365650019513806 \tabularnewline
37 & 1.4272 & 1.46728221463428 & -0.0400822146342823 \tabularnewline
38 & 1.3686 & 1.43233374953561 & -0.0637337495356101 \tabularnewline
39 & 1.3569 & 1.37254363348114 & -0.0156436334811412 \tabularnewline
40 & 1.3406 & 1.36055151604741 & -0.0199515160474142 \tabularnewline
41 & 1.2565 & 1.343878956458 & -0.0873789564579968 \tabularnewline
42 & 1.2209 & 1.25814730761165 & -0.0372473076116453 \tabularnewline
43 & 1.277 & 1.22185177943235 & 0.0551482205676528 \tabularnewline
44 & 1.2894 & 1.27898157578281 & 0.0104184242171921 \tabularnewline
45 & 1.3067 & 1.29157612159274 & 0.0151238784072638 \tabularnewline
46 & 1.3898 & 1.30915853351153 & 0.0806414664884694 \tabularnewline
47 & 1.3661 & 1.39376437154276 & -0.027664371542764 \tabularnewline
48 & 1.322 & 1.36954778789674 & -0.047547787896741 \tabularnewline
49 & 1.336 & 1.3245599163037 & 0.011440083696296 \tabularnewline
50 & 1.3649 & 1.33877353981355 & 0.0261264601864499 \tabularnewline
51 & 1.3999 & 1.36816140566078 & 0.0317385943392199 \tabularnewline
52 & 1.4442 & 1.40375406827587 & 0.0404459317241281 \tabularnewline
53 & 1.4349 & 1.44880932515364 & -0.0139093251536417 \tabularnewline
54 & 1.4388 & 1.43924959288788 & -0.000449592887883155 \tabularnewline
55 & 1.4264 & 1.44314119752879 & -0.0167411975287881 \tabularnewline
56 & 1.4343 & 1.43042858501038 & 0.0038714149896224 \tabularnewline
57 & 1.377 & 1.43840087689915 & -0.061400876899153 \tabularnewline
58 & 1.3706 & 1.37995432315191 & -0.00935432315190599 \tabularnewline
59 & 1.3556 & 1.37337964756412 & -0.0177796475641228 \tabularnewline
60 & 1.3179 & 1.35804764381159 & -0.0401476438115889 \tabularnewline
\hline
\end{tabular}
%Source: https://freestatistics.org/blog/index.php?pk=192531&T=2

[TABLE]
[ROW][C]Interpolation Forecasts of Exponential Smoothing[/C][/ROW]
[ROW][C]t[/C][C]Observed[/C][C]Fitted[/C][C]Residuals[/C][/ROW]
[ROW][C]3[/C][C]1.3242[/C][C]1.3149[/C][C]0.00930000000000031[/C][/ROW]
[ROW][C]4[/C][C]1.3516[/C][C]1.33187366119814[/C][C]0.019726338801856[/C][/ROW]
[ROW][C]5[/C][C]1.3511[/C][C]1.35964201599721[/C][C]-0.00854201599721094[/C][/ROW]
[ROW][C]6[/C][C]1.3419[/C][C]1.35898250882166[/C][C]-0.017082508821658[/C][/ROW]
[ROW][C]7[/C][C]1.3716[/C][C]1.34946352291313[/C][C]0.0221364770868657[/C][/ROW]
[ROW][C]8[/C][C]1.3622[/C][C]1.37957688281997[/C][C]-0.0173768828199719[/C][/ROW]
[ROW][C]9[/C][C]1.3896[/C][C]1.36985239999303[/C][C]0.0197476000069661[/C][/ROW]
[ROW][C]10[/C][C]1.4227[/C][C]1.39762115180784[/C][C]0.0250788481921622[/C][/ROW]
[ROW][C]11[/C][C]1.4684[/C][C]1.43118945533742[/C][C]0.037210544662579[/C][/ROW]
[ROW][C]12[/C][C]1.457[/C][C]1.47758429703309[/C][C]-0.0205842970330867[/C][/ROW]
[ROW][C]13[/C][C]1.4718[/C][C]1.46579992136796[/C][C]0.00600007863204399[/C][/ROW]
[ROW][C]14[/C][C]1.4748[/C][C]1.48071196231895[/C][C]-0.00591196231894497[/C][/ROW]
[ROW][C]15[/C][C]1.5527[/C][C]1.48360156678565[/C][C]0.0690984332143547[/C][/ROW]
[ROW][C]16[/C][C]1.5751[/C][C]1.56279185890413[/C][C]0.0123081410958736[/C][/ROW]
[ROW][C]17[/C][C]1.5557[/C][C]1.5854216918643[/C][C]-0.029721691864302[/C][/ROW]
[ROW][C]18[/C][C]1.5553[/C][C]1.56546669136753[/C][C]-0.0101666913675258[/C][/ROW]
[ROW][C]19[/C][C]1.577[/C][C]1.56487684622731[/C][C]0.0121231537726942[/C][/ROW]
[ROW][C]20[/C][C]1.4975[/C][C]1.58680322487348[/C][C]-0.0893032248734831[/C][/ROW]
[ROW][C]21[/C][C]1.437[/C][C]1.5056356436875[/C][C]-0.0686356436874993[/C][/ROW]
[ROW][C]22[/C][C]1.3322[/C][C]1.44385399335221[/C][C]-0.111653993352214[/C][/ROW]
[ROW][C]23[/C][C]1.2732[/C][C]1.33696905074328[/C][C]-0.063769050743278[/C][/ROW]
[ROW][C]24[/C][C]1.3449[/C][C]1.27677827550064[/C][C]0.0681217244993648[/C][/ROW]
[ROW][C]25[/C][C]1.3239[/C][C]1.34975032929592[/C][C]-0.0258503292959245[/C][/ROW]
[ROW][C]26[/C][C]1.2785[/C][C]1.32826761970905[/C][C]-0.0497676197090486[/C][/ROW]
[ROW][C]27[/C][C]1.305[/C][C]1.28193829664803[/C][C]0.0230617033519671[/C][/ROW]
[ROW][C]28[/C][C]1.319[/C][C]1.30886893353355[/C][C]0.0101310664664465[/C][/ROW]
[ROW][C]29[/C][C]1.365[/C][C]1.32305811344119[/C][C]0.0419418865588077[/C][/ROW]
[ROW][C]30[/C][C]1.4016[/C][C]1.36984130465326[/C][C]0.031758695346741[/C][/ROW]
[ROW][C]31[/C][C]1.4088[/C][C]1.40703434261943[/C][C]0.00176565738056844[/C][/ROW]
[ROW][C]32[/C][C]1.4268[/C][C]1.41426731317601[/C][C]0.0125326868239855[/C][/ROW]
[ROW][C]33[/C][C]1.4562[/C][C]1.43250133913406[/C][C]0.0236986608659406[/C][/ROW]
[ROW][C]34[/C][C]1.4816[/C][C]1.46234387008464[/C][C]0.0192561299153615[/C][/ROW]
[ROW][C]35[/C][C]1.4914[/C][C]1.48810344455697[/C][C]0.00329655544302643[/C][/ROW]
[ROW][C]36[/C][C]1.4614[/C][C]1.49796500195138[/C][C]-0.0365650019513806[/C][/ROW]
[ROW][C]37[/C][C]1.4272[/C][C]1.46728221463428[/C][C]-0.0400822146342823[/C][/ROW]
[ROW][C]38[/C][C]1.3686[/C][C]1.43233374953561[/C][C]-0.0637337495356101[/C][/ROW]
[ROW][C]39[/C][C]1.3569[/C][C]1.37254363348114[/C][C]-0.0156436334811412[/C][/ROW]
[ROW][C]40[/C][C]1.3406[/C][C]1.36055151604741[/C][C]-0.0199515160474142[/C][/ROW]
[ROW][C]41[/C][C]1.2565[/C][C]1.343878956458[/C][C]-0.0873789564579968[/C][/ROW]
[ROW][C]42[/C][C]1.2209[/C][C]1.25814730761165[/C][C]-0.0372473076116453[/C][/ROW]
[ROW][C]43[/C][C]1.277[/C][C]1.22185177943235[/C][C]0.0551482205676528[/C][/ROW]
[ROW][C]44[/C][C]1.2894[/C][C]1.27898157578281[/C][C]0.0104184242171921[/C][/ROW]
[ROW][C]45[/C][C]1.3067[/C][C]1.29157612159274[/C][C]0.0151238784072638[/C][/ROW]
[ROW][C]46[/C][C]1.3898[/C][C]1.30915853351153[/C][C]0.0806414664884694[/C][/ROW]
[ROW][C]47[/C][C]1.3661[/C][C]1.39376437154276[/C][C]-0.027664371542764[/C][/ROW]
[ROW][C]48[/C][C]1.322[/C][C]1.36954778789674[/C][C]-0.047547787896741[/C][/ROW]
[ROW][C]49[/C][C]1.336[/C][C]1.3245599163037[/C][C]0.011440083696296[/C][/ROW]
[ROW][C]50[/C][C]1.3649[/C][C]1.33877353981355[/C][C]0.0261264601864499[/C][/ROW]
[ROW][C]51[/C][C]1.3999[/C][C]1.36816140566078[/C][C]0.0317385943392199[/C][/ROW]
[ROW][C]52[/C][C]1.4442[/C][C]1.40375406827587[/C][C]0.0404459317241281[/C][/ROW]
[ROW][C]53[/C][C]1.4349[/C][C]1.44880932515364[/C][C]-0.0139093251536417[/C][/ROW]
[ROW][C]54[/C][C]1.4388[/C][C]1.43924959288788[/C][C]-0.000449592887883155[/C][/ROW]
[ROW][C]55[/C][C]1.4264[/C][C]1.44314119752879[/C][C]-0.0167411975287881[/C][/ROW]
[ROW][C]56[/C][C]1.4343[/C][C]1.43042858501038[/C][C]0.0038714149896224[/C][/ROW]
[ROW][C]57[/C][C]1.377[/C][C]1.43840087689915[/C][C]-0.061400876899153[/C][/ROW]
[ROW][C]58[/C][C]1.3706[/C][C]1.37995432315191[/C][C]-0.00935432315190599[/C][/ROW]
[ROW][C]59[/C][C]1.3556[/C][C]1.37337964756412[/C][C]-0.0177796475641228[/C][/ROW]
[ROW][C]60[/C][C]1.3179[/C][C]1.35804764381159[/C][C]-0.0401476438115889[/C][/ROW]
[/TABLE]
Source: https://freestatistics.org/blog/index.php?pk=192531&T=2

Globally Unique Identifier (entire table): ba.freestatistics.org/blog/index.php?pk=192531&T=2

As an alternative you can also use a QR Code:  

The GUIDs for individual cells are displayed in the table below:

Interpolation Forecasts of Exponential Smoothing
tObservedFittedResiduals
31.32421.31490.00930000000000031
41.35161.331873661198140.019726338801856
51.35111.35964201599721-0.00854201599721094
61.34191.35898250882166-0.017082508821658
71.37161.349463522913130.0221364770868657
81.36221.37957688281997-0.0173768828199719
91.38961.369852399993030.0197476000069661
101.42271.397621151807840.0250788481921622
111.46841.431189455337420.037210544662579
121.4571.47758429703309-0.0205842970330867
131.47181.465799921367960.00600007863204399
141.47481.48071196231895-0.00591196231894497
151.55271.483601566785650.0690984332143547
161.57511.562791858904130.0123081410958736
171.55571.5854216918643-0.029721691864302
181.55531.56546669136753-0.0101666913675258
191.5771.564876846227310.0121231537726942
201.49751.58680322487348-0.0893032248734831
211.4371.5056356436875-0.0686356436874993
221.33221.44385399335221-0.111653993352214
231.27321.33696905074328-0.063769050743278
241.34491.276778275500640.0681217244993648
251.32391.34975032929592-0.0258503292959245
261.27851.32826761970905-0.0497676197090486
271.3051.281938296648030.0230617033519671
281.3191.308868933533550.0101310664664465
291.3651.323058113441190.0419418865588077
301.40161.369841304653260.031758695346741
311.40881.407034342619430.00176565738056844
321.42681.414267313176010.0125326868239855
331.45621.432501339134060.0236986608659406
341.48161.462343870084640.0192561299153615
351.49141.488103444556970.00329655544302643
361.46141.49796500195138-0.0365650019513806
371.42721.46728221463428-0.0400822146342823
381.36861.43233374953561-0.0637337495356101
391.35691.37254363348114-0.0156436334811412
401.34061.36055151604741-0.0199515160474142
411.25651.343878956458-0.0873789564579968
421.22091.25814730761165-0.0372473076116453
431.2771.221851779432350.0551482205676528
441.28941.278981575782810.0104184242171921
451.30671.291576121592740.0151238784072638
461.38981.309158533511530.0806414664884694
471.36611.39376437154276-0.027664371542764
481.3221.36954778789674-0.047547787896741
491.3361.32455991630370.011440083696296
501.36491.338773539813550.0261264601864499
511.39991.368161405660780.0317385943392199
521.44421.403754068275870.0404459317241281
531.43491.44880932515364-0.0139093251536417
541.43881.43924959288788-0.000449592887883155
551.42641.44314119752879-0.0167411975287881
561.43431.430428585010380.0038714149896224
571.3771.43840087689915-0.061400876899153
581.37061.37995432315191-0.00935432315190599
591.35561.37337964756412-0.0177796475641228
601.31791.35804764381159-0.0401476438115889


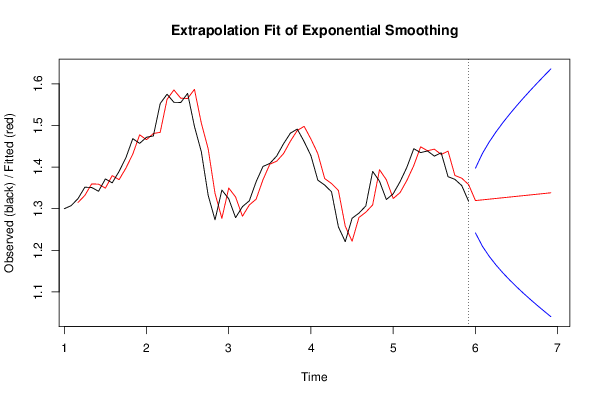
Extrapolation Forecasts of Exponential Smoothing
tForecast95% Lower Bound95% Upper Bound
611.319597956937721.241826918315871.39736899555957
621.321295913875441.210279419700581.4323124080503
631.322993870813161.185759762148251.46022797947807
641.324691827750881.164760066539311.48462358896245
651.32638978468861.14593540552921.50684416384801
661.328087741626321.128602747927161.52757273532549
671.329785698564041.112360250436031.54721114669205
681.331483655501761.096948606319931.5660187046836
691.333181612439481.082189437056041.58417378782293
701.33487956937721.067954126771931.60180501198248
711.336577526314921.054146531728571.61900852090128
721.338275483252641.040692697338981.63585826916631

\begin{tabular}{lllllllll}
\hline
Extrapolation Forecasts of Exponential Smoothing \tabularnewline
t & Forecast & 95% Lower Bound & 95% Upper Bound \tabularnewline
61 & 1.31959795693772 & 1.24182691831587 & 1.39736899555957 \tabularnewline
62 & 1.32129591387544 & 1.21027941970058 & 1.4323124080503 \tabularnewline
63 & 1.32299387081316 & 1.18575976214825 & 1.46022797947807 \tabularnewline
64 & 1.32469182775088 & 1.16476006653931 & 1.48462358896245 \tabularnewline
65 & 1.3263897846886 & 1.1459354055292 & 1.50684416384801 \tabularnewline
66 & 1.32808774162632 & 1.12860274792716 & 1.52757273532549 \tabularnewline
67 & 1.32978569856404 & 1.11236025043603 & 1.54721114669205 \tabularnewline
68 & 1.33148365550176 & 1.09694860631993 & 1.5660187046836 \tabularnewline
69 & 1.33318161243948 & 1.08218943705604 & 1.58417378782293 \tabularnewline
70 & 1.3348795693772 & 1.06795412677193 & 1.60180501198248 \tabularnewline
71 & 1.33657752631492 & 1.05414653172857 & 1.61900852090128 \tabularnewline
72 & 1.33827548325264 & 1.04069269733898 & 1.63585826916631 \tabularnewline
\hline
\end{tabular}
%Source: https://freestatistics.org/blog/index.php?pk=192531&T=3

[TABLE]
[ROW][C]Extrapolation Forecasts of Exponential Smoothing[/C][/ROW]
[ROW][C]t[/C][C]Forecast[/C][C]95% Lower Bound[/C][C]95% Upper Bound[/C][/ROW]
[ROW][C]61[/C][C]1.31959795693772[/C][C]1.24182691831587[/C][C]1.39736899555957[/C][/ROW]
[ROW][C]62[/C][C]1.32129591387544[/C][C]1.21027941970058[/C][C]1.4323124080503[/C][/ROW]
[ROW][C]63[/C][C]1.32299387081316[/C][C]1.18575976214825[/C][C]1.46022797947807[/C][/ROW]
[ROW][C]64[/C][C]1.32469182775088[/C][C]1.16476006653931[/C][C]1.48462358896245[/C][/ROW]
[ROW][C]65[/C][C]1.3263897846886[/C][C]1.1459354055292[/C][C]1.50684416384801[/C][/ROW]
[ROW][C]66[/C][C]1.32808774162632[/C][C]1.12860274792716[/C][C]1.52757273532549[/C][/ROW]
[ROW][C]67[/C][C]1.32978569856404[/C][C]1.11236025043603[/C][C]1.54721114669205[/C][/ROW]
[ROW][C]68[/C][C]1.33148365550176[/C][C]1.09694860631993[/C][C]1.5660187046836[/C][/ROW]
[ROW][C]69[/C][C]1.33318161243948[/C][C]1.08218943705604[/C][C]1.58417378782293[/C][/ROW]
[ROW][C]70[/C][C]1.3348795693772[/C][C]1.06795412677193[/C][C]1.60180501198248[/C][/ROW]
[ROW][C]71[/C][C]1.33657752631492[/C][C]1.05414653172857[/C][C]1.61900852090128[/C][/ROW]
[ROW][C]72[/C][C]1.33827548325264[/C][C]1.04069269733898[/C][C]1.63585826916631[/C][/ROW]
[/TABLE]
Source: https://freestatistics.org/blog/index.php?pk=192531&T=3

Globally Unique Identifier (entire table): ba.freestatistics.org/blog/index.php?pk=192531&T=3

As an alternative you can also use a QR Code:  

The GUIDs for individual cells are displayed in the table below:

Extrapolation Forecasts of Exponential Smoothing
tForecast95% Lower Bound95% Upper Bound
611.319597956937721.241826918315871.39736899555957
621.321295913875441.210279419700581.4323124080503
631.322993870813161.185759762148251.46022797947807
641.324691827750881.164760066539311.48462358896245
651.32638978468861.14593540552921.50684416384801
661.328087741626321.128602747927161.52757273532549
671.329785698564041.112360250436031.54721114669205
681.331483655501761.096948606319931.5660187046836
691.333181612439481.082189437056041.58417378782293
701.33487956937721.067954126771931.60180501198248
711.336577526314921.054146531728571.61900852090128
721.338275483252641.040692697338981.63585826916631


Parameters (Session):
par1 = 12 ; par2 = Double ; par3 = additive ;
Parameters (R input):
par1 = 12 ; par2 = Double ; par3 = additive ;
R code (references can be found in the software module):
par1 <- as.numeric(par1)
if (par2 == 'Single') K <- 1
if (par2 == 'Double') K <- 2
if (par2 == 'Triple') K <- par1
nx <- length(x)
nxmK <- nx - K
x <- ts(x, frequency = par1)
if (par2 == 'Single') fit <- HoltWinters(x, gamma=F, beta=F)
if (par2 == 'Double') fit <- HoltWinters(x, gamma=F)
if (par2 == 'Triple') fit <- HoltWinters(x, seasonal=par3)
fit
myresid <- x - fit$fitted[,'xhat']
bitmap(file='test1.png')
op <- par(mfrow=c(2,1))
plot(fit,ylab='Observed (black) / Fitted (red)',main='Interpolation Fit of Exponential Smoothing')
plot(myresid,ylab='Residuals',main='Interpolation Prediction Errors')
par(op)
dev.off()
bitmap(file='test2.png')
p <- predict(fit, par1, prediction.interval=TRUE)
np <- length(p[,1])
plot(fit,p,ylab='Observed (black) / Fitted (red)',main='Extrapolation Fit of Exponential Smoothing')
dev.off()
bitmap(file='test3.png')
op <- par(mfrow = c(2,2))
acf(as.numeric(myresid),lag.max = nx/2,main='Residual ACF')
spectrum(myresid,main='Residals Periodogram')
cpgram(myresid,main='Residal Cumulative Periodogram')
qqnorm(myresid,main='Residual Normal QQ Plot')
qqline(myresid)
par(op)
dev.off()
load(file='createtable')
a<-table.start()
a<-table.row.start(a)
a<-table.element(a,'Estimated Parameters of Exponential Smoothing',2,TRUE)
a<-table.row.end(a)
a<-table.row.start(a)
a<-table.element(a,'Parameter',header=TRUE)
a<-table.element(a,'Value',header=TRUE)
a<-table.row.end(a)
a<-table.row.start(a)
a<-table.element(a,'alpha',header=TRUE)
a<-table.element(a,fit$alpha)
a<-table.row.end(a)
a<-table.row.start(a)
a<-table.element(a,'beta',header=TRUE)
a<-table.element(a,fit$beta)
a<-table.row.end(a)
a<-table.row.start(a)
a<-table.element(a,'gamma',header=TRUE)
a<-table.element(a,fit$gamma)
a<-table.row.end(a)
a<-table.end(a)
table.save(a,file='mytable.tab')
a<-table.start()
a<-table.row.start(a)
a<-table.element(a,'Interpolation Forecasts of Exponential Smoothing',4,TRUE)
a<-table.row.end(a)
a<-table.row.start(a)
a<-table.element(a,'t',header=TRUE)
a<-table.element(a,'Observed',header=TRUE)
a<-table.element(a,'Fitted',header=TRUE)
a<-table.element(a,'Residuals',header=TRUE)
a<-table.row.end(a)
for (i in 1:nxmK) {
a<-table.row.start(a)
a<-table.element(a,i+K,header=TRUE)
a<-table.element(a,x[i+K])
a<-table.element(a,fit$fitted[i,'xhat'])
a<-table.element(a,myresid[i])
a<-table.row.end(a)
}
a<-table.end(a)
table.save(a,file='mytable1.tab')
a<-table.start()
a<-table.row.start(a)
a<-table.element(a,'Extrapolation Forecasts of Exponential Smoothing',4,TRUE)
a<-table.row.end(a)
a<-table.row.start(a)
a<-table.element(a,'t',header=TRUE)
a<-table.element(a,'Forecast',header=TRUE)
a<-table.element(a,'95% Lower Bound',header=TRUE)
a<-table.element(a,'95% Upper Bound',header=TRUE)
a<-table.row.end(a)
for (i in 1:np) {
a<-table.row.start(a)
a<-table.element(a,nx+i,header=TRUE)
a<-table.element(a,p[i,'fit'])
a<-table.element(a,p[i,'lwr'])
a<-table.element(a,p[i,'upr'])
a<-table.row.end(a)
}
a<-table.end(a)
table.save(a,file='mytable2.tab')