Free Statistics

of Irreproducible Research!

Author's title

Author*Unverified author*
R Software Modulerwasp_centraltendency.wasp
Title produced by softwareCentral Tendency
Date of computationMon, 08 Oct 2012 03:56:25 -0400
Cite this page as followsStatistical Computations at FreeStatistics.org, Office for Research Development and Education, URL https://freestatistics.org/blog/index.php?v=date/2012/Oct/08/t1349683002kdwx14l4abwjliz.htm/, Retrieved Wed, 01 May 2024 23:12:20 +0000
Statistical Computations at FreeStatistics.org, Office for Research Development and Education, URL https://freestatistics.org/blog/index.php?pk=173270, Retrieved Wed, 01 May 2024 23:12:20 +0000
QR Codes:

Original text written by user:
IsPrivate?No (this computation is public)
User-defined keywords
Estimated Impact59
Family? (F = Feedback message, R = changed R code, M = changed R Module, P = changed Parameters, D = changed Data)
-       [Central Tendency] [] [2012-10-08 07:56:25] [bde5439f82329924767810eaa006eb77] [Current]
Feedback Forum

Post a new message
Dataseries X:
31956
29506
34506
27165
26736
23691
18157
17328
18205
20995
17382
9367
31124
26551
30651
25859
25100
25778
20418
18688
20424
24776
19814
12738
31566
30111
30019
31934
25826
26835
20205
17789
20520
22518
15572
11509
25447
24090
27786
26195
20516
22759
19028
16971
20036
22485
18730
14538
27561
25985
34670
32066
27186
29586
21359
21553
19573
24256
22380
16167
27297
28287
33474
28229
28785
25597
18130
20198
22849
23118
21925
20801


Summary of computational transaction
Raw Inputview raw input (R code)
Raw Outputview raw output of R engine
Computing time2 seconds
R Server'Gwilym Jenkins' @ jenkins.wessa.net

\begin{tabular}{lllllllll}
\hline
Summary of computational transaction \tabularnewline
Raw Input & view raw input (R code)  \tabularnewline
Raw Output & view raw output of R engine  \tabularnewline
Computing time & 2 seconds \tabularnewline
R Server & 'Gwilym Jenkins' @ jenkins.wessa.net \tabularnewline
\hline
\end{tabular}
%Source: https://freestatistics.org/blog/index.php?pk=173270&T=0

[TABLE]
[ROW][C]Summary of computational transaction[/C][/ROW]
[ROW][C]Raw Input[/C][C]view raw input (R code) [/C][/ROW]
[ROW][C]Raw Output[/C][C]view raw output of R engine [/C][/ROW]
[ROW][C]Computing time[/C][C]2 seconds[/C][/ROW]
[ROW][C]R Server[/C][C]'Gwilym Jenkins' @ jenkins.wessa.net[/C][/ROW]
[/TABLE]
Source: https://freestatistics.org/blog/index.php?pk=173270&T=0

Globally Unique Identifier (entire table): ba.freestatistics.org/blog/index.php?pk=173270&T=0

As an alternative you can also use a QR Code:  

The GUIDs for individual cells are displayed in the table below:

Summary of computational transaction
Raw Inputview raw input (R code)
Raw Outputview raw output of R engine
Computing time2 seconds
R Server'Gwilym Jenkins' @ jenkins.wessa.net


Central Tendency - Ungrouped Data
MeasureValueS.E.Value/S.E.
Arithmetic Mean23624.0555555556656.60673533410235.9790027793957
Geometric Mean22913.0703512368
Harmonic Mean22114.3987345495
Quadratic Mean24263.2726901976
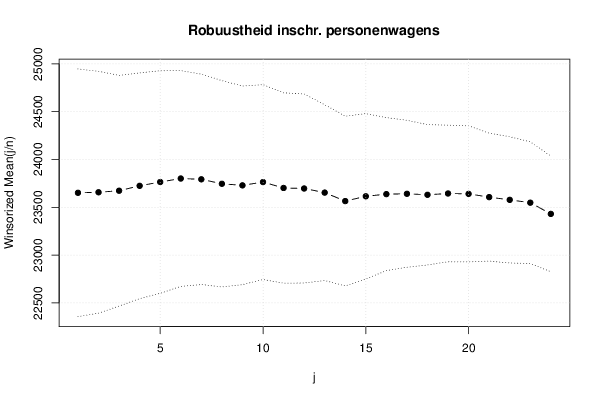
Winsorized Mean ( 1 / 24 )23651.5277777778647.58629704268636.5225883959969
Winsorized Mean ( 2 / 24 )23657632.40265879279837.4081286203938
Winsorized Mean ( 3 / 24 )23673.3333333333603.07750976603539.2542135131476
Winsorized Mean ( 4 / 24 )23724.6666666667590.15616948554140.200658560171
Winsorized Mean ( 5 / 24 )23764.4583333333582.0355526605240.829908456115
Winsorized Mean ( 6 / 24 )23800.7916666667564.1527473603842.1885593538779
Winsorized Mean ( 7 / 24 )23792.5277777778550.12020843571243.2496887279105
Winsorized Mean ( 8 / 24 )23745.9722222222539.45344194825644.0185757949059
Winsorized Mean ( 9 / 24 )23729.3472222222519.19327928224245.7042649993984
Winsorized Mean ( 10 / 24 )23763.9305555556509.47692126781846.6437822078766
Winsorized Mean ( 11 / 24 )23701.9027777778497.60108722049847.6323372004108
Winsorized Mean ( 12 / 24 )23696.5694444444494.13290538005947.9558620493375
Winsorized Mean ( 13 / 24 )23653.5972222222459.63311245729951.4619085987189
Winsorized Mean ( 14 / 24 )23564.9305555556443.50496224523353.1334090068771
Winsorized Mean ( 15 / 24 )23614.9305555556432.28365160911354.6283220928027
Winsorized Mean ( 16 / 24 )23637.5972222222399.95241239801359.1010242456027
Winsorized Mean ( 17 / 24 )23641.375384.18760212908361.5360174794415
Winsorized Mean ( 18 / 24 )23630.875367.07856342789464.3755243545892
Winsorized Mean ( 19 / 24 )23644.3333333333357.11823515617966.2086978644283
Winsorized Mean ( 20 / 24 )23640.4444444444356.0398961138566.3983017141568
Winsorized Mean ( 21 / 24 )23606.3194444444334.38555451956570.5961101649898
Winsorized Mean ( 22 / 24 )23577.9027777778330.04364199003271.4387425723833
Winsorized Mean ( 23 / 24 )23548.1944444444318.18256860420874.0084365644065
Winsorized Mean ( 24 / 24 )23430.8611111111302.47295971020577.4643165906794
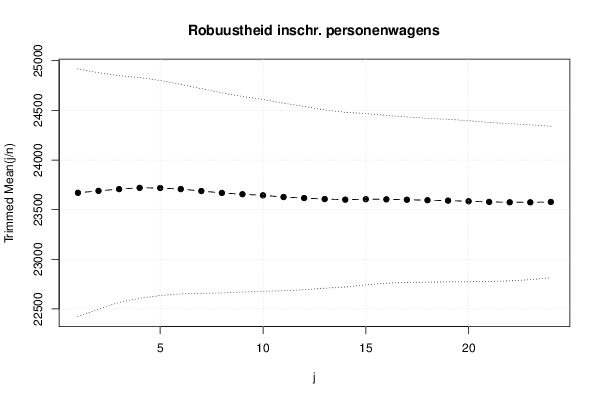
Trimmed Mean ( 1 / 24 )23669.9285714286623.64138521971937.9543903474098
Trimmed Mean ( 2 / 24 )23689.4117647059595.04660556115839.8110190753304
Trimmed Mean ( 3 / 24 )23707.0909090909570.75143154393541.5366297811309
Trimmed Mean ( 4 / 24 )23719.75555.35464502066842.7109959602791
Trimmed Mean ( 5 / 24 )23718.3225806452541.58695986891143.79411680515
Trimmed Mean ( 6 / 24 )23707.25527.43799626224344.9479373272393
Trimmed Mean ( 7 / 24 )23687.8965517241515.23575835204545.9748691113533
Trimmed Mean ( 8 / 24 )23668.6785714286503.83987619956646.9765885740525
Trimmed Mean ( 9 / 24 )23655.7962962963492.28432963247848.053116608357
Trimmed Mean ( 10 / 24 )23644.4807692308482.53530063380549.0005202483093
Trimmed Mean ( 11 / 24 )23627.28472.26494297076950.0297139384797
Trimmed Mean ( 12 / 24 )23617.1041666667461.74509719851451.1474930864576
Trimmed Mean ( 13 / 24 )23606.7391304348448.84368176640952.5945670829792
Trimmed Mean ( 14 / 24 )23600.8409090909439.83325922788653.6586090613553
Trimmed Mean ( 15 / 24 )23605.2380952381431.30117102461654.730289832417
Trimmed Mean ( 16 / 24 )23604.075422.14144911498355.9150849779993
Trimmed Mean ( 17 / 24 )23600.1052631579416.8044180270656.6215333677815
Trimmed Mean ( 18 / 24 )23595.25412.34378355121857.2222765110977
Trimmed Mean ( 19 / 24 )23591.0588235294409.18891544443957.6532206350362
Trimmed Mean ( 20 / 24 )23584.75405.8853624108158.1069242308105
Trimmed Mean ( 21 / 24 )23578.0666666667399.97520593654958.9488206186636
Trimmed Mean ( 22 / 24 )23574.6071428571396.05991456348759.5228304506394
Trimmed Mean ( 23 / 24 )23574.1923076923389.6113211877160.5069489146968
Trimmed Mean ( 24 / 24 )23577.5833333333381.77179861771761.7583158805883
Median23404.5
Midrange22018.5
Midmean - Weighted Average at Xnp23493.0540540541
Midmean - Weighted Average at X(n+1)p23595.25
Midmean - Empirical Distribution Function23493.0540540541
Midmean - Empirical Distribution Function - Averaging23595.25
Midmean - Empirical Distribution Function - Interpolation23595.25
Midmean - Closest Observation23493.0540540541
Midmean - True Basic - Statistics Graphics Toolkit23595.25
Midmean - MS Excel (old versions)23600.1052631579
Number of observations72

\begin{tabular}{lllllllll}
\hline
Central Tendency - Ungrouped Data \tabularnewline
Measure & Value & S.E. & Value/S.E. \tabularnewline
Arithmetic Mean & 23624.0555555556 & 656.606735334102 & 35.9790027793957 \tabularnewline
Geometric Mean & 22913.0703512368 &  &  \tabularnewline
Harmonic Mean & 22114.3987345495 &  &  \tabularnewline
Quadratic Mean & 24263.2726901976 &  &  \tabularnewline
Winsorized Mean ( 1 / 24 ) & 23651.5277777778 & 647.586297042686 & 36.5225883959969 \tabularnewline
Winsorized Mean ( 2 / 24 ) & 23657 & 632.402658792798 & 37.4081286203938 \tabularnewline
Winsorized Mean ( 3 / 24 ) & 23673.3333333333 & 603.077509766035 & 39.2542135131476 \tabularnewline
Winsorized Mean ( 4 / 24 ) & 23724.6666666667 & 590.156169485541 & 40.200658560171 \tabularnewline
Winsorized Mean ( 5 / 24 ) & 23764.4583333333 & 582.03555266052 & 40.829908456115 \tabularnewline
Winsorized Mean ( 6 / 24 ) & 23800.7916666667 & 564.15274736038 & 42.1885593538779 \tabularnewline
Winsorized Mean ( 7 / 24 ) & 23792.5277777778 & 550.120208435712 & 43.2496887279105 \tabularnewline
Winsorized Mean ( 8 / 24 ) & 23745.9722222222 & 539.453441948256 & 44.0185757949059 \tabularnewline
Winsorized Mean ( 9 / 24 ) & 23729.3472222222 & 519.193279282242 & 45.7042649993984 \tabularnewline
Winsorized Mean ( 10 / 24 ) & 23763.9305555556 & 509.476921267818 & 46.6437822078766 \tabularnewline
Winsorized Mean ( 11 / 24 ) & 23701.9027777778 & 497.601087220498 & 47.6323372004108 \tabularnewline
Winsorized Mean ( 12 / 24 ) & 23696.5694444444 & 494.132905380059 & 47.9558620493375 \tabularnewline
Winsorized Mean ( 13 / 24 ) & 23653.5972222222 & 459.633112457299 & 51.4619085987189 \tabularnewline
Winsorized Mean ( 14 / 24 ) & 23564.9305555556 & 443.504962245233 & 53.1334090068771 \tabularnewline
Winsorized Mean ( 15 / 24 ) & 23614.9305555556 & 432.283651609113 & 54.6283220928027 \tabularnewline
Winsorized Mean ( 16 / 24 ) & 23637.5972222222 & 399.952412398013 & 59.1010242456027 \tabularnewline
Winsorized Mean ( 17 / 24 ) & 23641.375 & 384.187602129083 & 61.5360174794415 \tabularnewline
Winsorized Mean ( 18 / 24 ) & 23630.875 & 367.078563427894 & 64.3755243545892 \tabularnewline
Winsorized Mean ( 19 / 24 ) & 23644.3333333333 & 357.118235156179 & 66.2086978644283 \tabularnewline
Winsorized Mean ( 20 / 24 ) & 23640.4444444444 & 356.03989611385 & 66.3983017141568 \tabularnewline
Winsorized Mean ( 21 / 24 ) & 23606.3194444444 & 334.385554519565 & 70.5961101649898 \tabularnewline
Winsorized Mean ( 22 / 24 ) & 23577.9027777778 & 330.043641990032 & 71.4387425723833 \tabularnewline
Winsorized Mean ( 23 / 24 ) & 23548.1944444444 & 318.182568604208 & 74.0084365644065 \tabularnewline
Winsorized Mean ( 24 / 24 ) & 23430.8611111111 & 302.472959710205 & 77.4643165906794 \tabularnewline
Trimmed Mean ( 1 / 24 ) & 23669.9285714286 & 623.641385219719 & 37.9543903474098 \tabularnewline
Trimmed Mean ( 2 / 24 ) & 23689.4117647059 & 595.046605561158 & 39.8110190753304 \tabularnewline
Trimmed Mean ( 3 / 24 ) & 23707.0909090909 & 570.751431543935 & 41.5366297811309 \tabularnewline
Trimmed Mean ( 4 / 24 ) & 23719.75 & 555.354645020668 & 42.7109959602791 \tabularnewline
Trimmed Mean ( 5 / 24 ) & 23718.3225806452 & 541.586959868911 & 43.79411680515 \tabularnewline
Trimmed Mean ( 6 / 24 ) & 23707.25 & 527.437996262243 & 44.9479373272393 \tabularnewline
Trimmed Mean ( 7 / 24 ) & 23687.8965517241 & 515.235758352045 & 45.9748691113533 \tabularnewline
Trimmed Mean ( 8 / 24 ) & 23668.6785714286 & 503.839876199566 & 46.9765885740525 \tabularnewline
Trimmed Mean ( 9 / 24 ) & 23655.7962962963 & 492.284329632478 & 48.053116608357 \tabularnewline
Trimmed Mean ( 10 / 24 ) & 23644.4807692308 & 482.535300633805 & 49.0005202483093 \tabularnewline
Trimmed Mean ( 11 / 24 ) & 23627.28 & 472.264942970769 & 50.0297139384797 \tabularnewline
Trimmed Mean ( 12 / 24 ) & 23617.1041666667 & 461.745097198514 & 51.1474930864576 \tabularnewline
Trimmed Mean ( 13 / 24 ) & 23606.7391304348 & 448.843681766409 & 52.5945670829792 \tabularnewline
Trimmed Mean ( 14 / 24 ) & 23600.8409090909 & 439.833259227886 & 53.6586090613553 \tabularnewline
Trimmed Mean ( 15 / 24 ) & 23605.2380952381 & 431.301171024616 & 54.730289832417 \tabularnewline
Trimmed Mean ( 16 / 24 ) & 23604.075 & 422.141449114983 & 55.9150849779993 \tabularnewline
Trimmed Mean ( 17 / 24 ) & 23600.1052631579 & 416.80441802706 & 56.6215333677815 \tabularnewline
Trimmed Mean ( 18 / 24 ) & 23595.25 & 412.343783551218 & 57.2222765110977 \tabularnewline
Trimmed Mean ( 19 / 24 ) & 23591.0588235294 & 409.188915444439 & 57.6532206350362 \tabularnewline
Trimmed Mean ( 20 / 24 ) & 23584.75 & 405.88536241081 & 58.1069242308105 \tabularnewline
Trimmed Mean ( 21 / 24 ) & 23578.0666666667 & 399.975205936549 & 58.9488206186636 \tabularnewline
Trimmed Mean ( 22 / 24 ) & 23574.6071428571 & 396.059914563487 & 59.5228304506394 \tabularnewline
Trimmed Mean ( 23 / 24 ) & 23574.1923076923 & 389.61132118771 & 60.5069489146968 \tabularnewline
Trimmed Mean ( 24 / 24 ) & 23577.5833333333 & 381.771798617717 & 61.7583158805883 \tabularnewline
Median & 23404.5 &  &  \tabularnewline
Midrange & 22018.5 &  &  \tabularnewline
Midmean - Weighted Average at Xnp & 23493.0540540541 &  &  \tabularnewline
Midmean - Weighted Average at X(n+1)p & 23595.25 &  &  \tabularnewline
Midmean - Empirical Distribution Function & 23493.0540540541 &  &  \tabularnewline
Midmean - Empirical Distribution Function - Averaging & 23595.25 &  &  \tabularnewline
Midmean - Empirical Distribution Function - Interpolation & 23595.25 &  &  \tabularnewline
Midmean - Closest Observation & 23493.0540540541 &  &  \tabularnewline
Midmean - True Basic - Statistics Graphics Toolkit & 23595.25 &  &  \tabularnewline
Midmean - MS Excel (old versions) & 23600.1052631579 &  &  \tabularnewline
Number of observations & 72 &  &  \tabularnewline
\hline
\end{tabular}
%Source: https://freestatistics.org/blog/index.php?pk=173270&T=1

[TABLE]
[ROW][C]Central Tendency - Ungrouped Data[/C][/ROW]
[ROW][C]Measure[/C][C]Value[/C][C]S.E.[/C][C]Value/S.E.[/C][/ROW]
[ROW][C]Arithmetic Mean[/C][C]23624.0555555556[/C][C]656.606735334102[/C][C]35.9790027793957[/C][/ROW]
[ROW][C]Geometric Mean[/C][C]22913.0703512368[/C][C][/C][C][/C][/ROW]
[ROW][C]Harmonic Mean[/C][C]22114.3987345495[/C][C][/C][C][/C][/ROW]
[ROW][C]Quadratic Mean[/C][C]24263.2726901976[/C][C][/C][C][/C][/ROW]
[ROW][C]Winsorized Mean ( 1 / 24 )[/C][C]23651.5277777778[/C][C]647.586297042686[/C][C]36.5225883959969[/C][/ROW]
[ROW][C]Winsorized Mean ( 2 / 24 )[/C][C]23657[/C][C]632.402658792798[/C][C]37.4081286203938[/C][/ROW]
[ROW][C]Winsorized Mean ( 3 / 24 )[/C][C]23673.3333333333[/C][C]603.077509766035[/C][C]39.2542135131476[/C][/ROW]
[ROW][C]Winsorized Mean ( 4 / 24 )[/C][C]23724.6666666667[/C][C]590.156169485541[/C][C]40.200658560171[/C][/ROW]
[ROW][C]Winsorized Mean ( 5 / 24 )[/C][C]23764.4583333333[/C][C]582.03555266052[/C][C]40.829908456115[/C][/ROW]
[ROW][C]Winsorized Mean ( 6 / 24 )[/C][C]23800.7916666667[/C][C]564.15274736038[/C][C]42.1885593538779[/C][/ROW]
[ROW][C]Winsorized Mean ( 7 / 24 )[/C][C]23792.5277777778[/C][C]550.120208435712[/C][C]43.2496887279105[/C][/ROW]
[ROW][C]Winsorized Mean ( 8 / 24 )[/C][C]23745.9722222222[/C][C]539.453441948256[/C][C]44.0185757949059[/C][/ROW]
[ROW][C]Winsorized Mean ( 9 / 24 )[/C][C]23729.3472222222[/C][C]519.193279282242[/C][C]45.7042649993984[/C][/ROW]
[ROW][C]Winsorized Mean ( 10 / 24 )[/C][C]23763.9305555556[/C][C]509.476921267818[/C][C]46.6437822078766[/C][/ROW]
[ROW][C]Winsorized Mean ( 11 / 24 )[/C][C]23701.9027777778[/C][C]497.601087220498[/C][C]47.6323372004108[/C][/ROW]
[ROW][C]Winsorized Mean ( 12 / 24 )[/C][C]23696.5694444444[/C][C]494.132905380059[/C][C]47.9558620493375[/C][/ROW]
[ROW][C]Winsorized Mean ( 13 / 24 )[/C][C]23653.5972222222[/C][C]459.633112457299[/C][C]51.4619085987189[/C][/ROW]
[ROW][C]Winsorized Mean ( 14 / 24 )[/C][C]23564.9305555556[/C][C]443.504962245233[/C][C]53.1334090068771[/C][/ROW]
[ROW][C]Winsorized Mean ( 15 / 24 )[/C][C]23614.9305555556[/C][C]432.283651609113[/C][C]54.6283220928027[/C][/ROW]
[ROW][C]Winsorized Mean ( 16 / 24 )[/C][C]23637.5972222222[/C][C]399.952412398013[/C][C]59.1010242456027[/C][/ROW]
[ROW][C]Winsorized Mean ( 17 / 24 )[/C][C]23641.375[/C][C]384.187602129083[/C][C]61.5360174794415[/C][/ROW]
[ROW][C]Winsorized Mean ( 18 / 24 )[/C][C]23630.875[/C][C]367.078563427894[/C][C]64.3755243545892[/C][/ROW]
[ROW][C]Winsorized Mean ( 19 / 24 )[/C][C]23644.3333333333[/C][C]357.118235156179[/C][C]66.2086978644283[/C][/ROW]
[ROW][C]Winsorized Mean ( 20 / 24 )[/C][C]23640.4444444444[/C][C]356.03989611385[/C][C]66.3983017141568[/C][/ROW]
[ROW][C]Winsorized Mean ( 21 / 24 )[/C][C]23606.3194444444[/C][C]334.385554519565[/C][C]70.5961101649898[/C][/ROW]
[ROW][C]Winsorized Mean ( 22 / 24 )[/C][C]23577.9027777778[/C][C]330.043641990032[/C][C]71.4387425723833[/C][/ROW]
[ROW][C]Winsorized Mean ( 23 / 24 )[/C][C]23548.1944444444[/C][C]318.182568604208[/C][C]74.0084365644065[/C][/ROW]
[ROW][C]Winsorized Mean ( 24 / 24 )[/C][C]23430.8611111111[/C][C]302.472959710205[/C][C]77.4643165906794[/C][/ROW]
[ROW][C]Trimmed Mean ( 1 / 24 )[/C][C]23669.9285714286[/C][C]623.641385219719[/C][C]37.9543903474098[/C][/ROW]
[ROW][C]Trimmed Mean ( 2 / 24 )[/C][C]23689.4117647059[/C][C]595.046605561158[/C][C]39.8110190753304[/C][/ROW]
[ROW][C]Trimmed Mean ( 3 / 24 )[/C][C]23707.0909090909[/C][C]570.751431543935[/C][C]41.5366297811309[/C][/ROW]
[ROW][C]Trimmed Mean ( 4 / 24 )[/C][C]23719.75[/C][C]555.354645020668[/C][C]42.7109959602791[/C][/ROW]
[ROW][C]Trimmed Mean ( 5 / 24 )[/C][C]23718.3225806452[/C][C]541.586959868911[/C][C]43.79411680515[/C][/ROW]
[ROW][C]Trimmed Mean ( 6 / 24 )[/C][C]23707.25[/C][C]527.437996262243[/C][C]44.9479373272393[/C][/ROW]
[ROW][C]Trimmed Mean ( 7 / 24 )[/C][C]23687.8965517241[/C][C]515.235758352045[/C][C]45.9748691113533[/C][/ROW]
[ROW][C]Trimmed Mean ( 8 / 24 )[/C][C]23668.6785714286[/C][C]503.839876199566[/C][C]46.9765885740525[/C][/ROW]
[ROW][C]Trimmed Mean ( 9 / 24 )[/C][C]23655.7962962963[/C][C]492.284329632478[/C][C]48.053116608357[/C][/ROW]
[ROW][C]Trimmed Mean ( 10 / 24 )[/C][C]23644.4807692308[/C][C]482.535300633805[/C][C]49.0005202483093[/C][/ROW]
[ROW][C]Trimmed Mean ( 11 / 24 )[/C][C]23627.28[/C][C]472.264942970769[/C][C]50.0297139384797[/C][/ROW]
[ROW][C]Trimmed Mean ( 12 / 24 )[/C][C]23617.1041666667[/C][C]461.745097198514[/C][C]51.1474930864576[/C][/ROW]
[ROW][C]Trimmed Mean ( 13 / 24 )[/C][C]23606.7391304348[/C][C]448.843681766409[/C][C]52.5945670829792[/C][/ROW]
[ROW][C]Trimmed Mean ( 14 / 24 )[/C][C]23600.8409090909[/C][C]439.833259227886[/C][C]53.6586090613553[/C][/ROW]
[ROW][C]Trimmed Mean ( 15 / 24 )[/C][C]23605.2380952381[/C][C]431.301171024616[/C][C]54.730289832417[/C][/ROW]
[ROW][C]Trimmed Mean ( 16 / 24 )[/C][C]23604.075[/C][C]422.141449114983[/C][C]55.9150849779993[/C][/ROW]
[ROW][C]Trimmed Mean ( 17 / 24 )[/C][C]23600.1052631579[/C][C]416.80441802706[/C][C]56.6215333677815[/C][/ROW]
[ROW][C]Trimmed Mean ( 18 / 24 )[/C][C]23595.25[/C][C]412.343783551218[/C][C]57.2222765110977[/C][/ROW]
[ROW][C]Trimmed Mean ( 19 / 24 )[/C][C]23591.0588235294[/C][C]409.188915444439[/C][C]57.6532206350362[/C][/ROW]
[ROW][C]Trimmed Mean ( 20 / 24 )[/C][C]23584.75[/C][C]405.88536241081[/C][C]58.1069242308105[/C][/ROW]
[ROW][C]Trimmed Mean ( 21 / 24 )[/C][C]23578.0666666667[/C][C]399.975205936549[/C][C]58.9488206186636[/C][/ROW]
[ROW][C]Trimmed Mean ( 22 / 24 )[/C][C]23574.6071428571[/C][C]396.059914563487[/C][C]59.5228304506394[/C][/ROW]
[ROW][C]Trimmed Mean ( 23 / 24 )[/C][C]23574.1923076923[/C][C]389.61132118771[/C][C]60.5069489146968[/C][/ROW]
[ROW][C]Trimmed Mean ( 24 / 24 )[/C][C]23577.5833333333[/C][C]381.771798617717[/C][C]61.7583158805883[/C][/ROW]
[ROW][C]Median[/C][C]23404.5[/C][C][/C][C][/C][/ROW]
[ROW][C]Midrange[/C][C]22018.5[/C][C][/C][C][/C][/ROW]
[ROW][C]Midmean - Weighted Average at Xnp[/C][C]23493.0540540541[/C][C][/C][C][/C][/ROW]
[ROW][C]Midmean - Weighted Average at X(n+1)p[/C][C]23595.25[/C][C][/C][C][/C][/ROW]
[ROW][C]Midmean - Empirical Distribution Function[/C][C]23493.0540540541[/C][C][/C][C][/C][/ROW]
[ROW][C]Midmean - Empirical Distribution Function - Averaging[/C][C]23595.25[/C][C][/C][C][/C][/ROW]
[ROW][C]Midmean - Empirical Distribution Function - Interpolation[/C][C]23595.25[/C][C][/C][C][/C][/ROW]
[ROW][C]Midmean - Closest Observation[/C][C]23493.0540540541[/C][C][/C][C][/C][/ROW]
[ROW][C]Midmean - True Basic - Statistics Graphics Toolkit[/C][C]23595.25[/C][C][/C][C][/C][/ROW]
[ROW][C]Midmean - MS Excel (old versions)[/C][C]23600.1052631579[/C][C][/C][C][/C][/ROW]
[ROW][C]Number of observations[/C][C]72[/C][C][/C][C][/C][/ROW]
[/TABLE]
Source: https://freestatistics.org/blog/index.php?pk=173270&T=1

Globally Unique Identifier (entire table): ba.freestatistics.org/blog/index.php?pk=173270&T=1

As an alternative you can also use a QR Code:  

The GUIDs for individual cells are displayed in the table below:

Central Tendency - Ungrouped Data
MeasureValueS.E.Value/S.E.
Arithmetic Mean23624.0555555556656.60673533410235.9790027793957
Geometric Mean22913.0703512368
Harmonic Mean22114.3987345495
Quadratic Mean24263.2726901976
Winsorized Mean ( 1 / 24 )23651.5277777778647.58629704268636.5225883959969
Winsorized Mean ( 2 / 24 )23657632.40265879279837.4081286203938
Winsorized Mean ( 3 / 24 )23673.3333333333603.07750976603539.2542135131476
Winsorized Mean ( 4 / 24 )23724.6666666667590.15616948554140.200658560171
Winsorized Mean ( 5 / 24 )23764.4583333333582.0355526605240.829908456115
Winsorized Mean ( 6 / 24 )23800.7916666667564.1527473603842.1885593538779
Winsorized Mean ( 7 / 24 )23792.5277777778550.12020843571243.2496887279105
Winsorized Mean ( 8 / 24 )23745.9722222222539.45344194825644.0185757949059
Winsorized Mean ( 9 / 24 )23729.3472222222519.19327928224245.7042649993984
Winsorized Mean ( 10 / 24 )23763.9305555556509.47692126781846.6437822078766
Winsorized Mean ( 11 / 24 )23701.9027777778497.60108722049847.6323372004108
Winsorized Mean ( 12 / 24 )23696.5694444444494.13290538005947.9558620493375
Winsorized Mean ( 13 / 24 )23653.5972222222459.63311245729951.4619085987189
Winsorized Mean ( 14 / 24 )23564.9305555556443.50496224523353.1334090068771
Winsorized Mean ( 15 / 24 )23614.9305555556432.28365160911354.6283220928027
Winsorized Mean ( 16 / 24 )23637.5972222222399.95241239801359.1010242456027
Winsorized Mean ( 17 / 24 )23641.375384.18760212908361.5360174794415
Winsorized Mean ( 18 / 24 )23630.875367.07856342789464.3755243545892
Winsorized Mean ( 19 / 24 )23644.3333333333357.11823515617966.2086978644283
Winsorized Mean ( 20 / 24 )23640.4444444444356.0398961138566.3983017141568
Winsorized Mean ( 21 / 24 )23606.3194444444334.38555451956570.5961101649898
Winsorized Mean ( 22 / 24 )23577.9027777778330.04364199003271.4387425723833
Winsorized Mean ( 23 / 24 )23548.1944444444318.18256860420874.0084365644065
Winsorized Mean ( 24 / 24 )23430.8611111111302.47295971020577.4643165906794
Trimmed Mean ( 1 / 24 )23669.9285714286623.64138521971937.9543903474098
Trimmed Mean ( 2 / 24 )23689.4117647059595.04660556115839.8110190753304
Trimmed Mean ( 3 / 24 )23707.0909090909570.75143154393541.5366297811309
Trimmed Mean ( 4 / 24 )23719.75555.35464502066842.7109959602791
Trimmed Mean ( 5 / 24 )23718.3225806452541.58695986891143.79411680515
Trimmed Mean ( 6 / 24 )23707.25527.43799626224344.9479373272393
Trimmed Mean ( 7 / 24 )23687.8965517241515.23575835204545.9748691113533
Trimmed Mean ( 8 / 24 )23668.6785714286503.83987619956646.9765885740525
Trimmed Mean ( 9 / 24 )23655.7962962963492.28432963247848.053116608357
Trimmed Mean ( 10 / 24 )23644.4807692308482.53530063380549.0005202483093
Trimmed Mean ( 11 / 24 )23627.28472.26494297076950.0297139384797
Trimmed Mean ( 12 / 24 )23617.1041666667461.74509719851451.1474930864576
Trimmed Mean ( 13 / 24 )23606.7391304348448.84368176640952.5945670829792
Trimmed Mean ( 14 / 24 )23600.8409090909439.83325922788653.6586090613553
Trimmed Mean ( 15 / 24 )23605.2380952381431.30117102461654.730289832417
Trimmed Mean ( 16 / 24 )23604.075422.14144911498355.9150849779993
Trimmed Mean ( 17 / 24 )23600.1052631579416.8044180270656.6215333677815
Trimmed Mean ( 18 / 24 )23595.25412.34378355121857.2222765110977
Trimmed Mean ( 19 / 24 )23591.0588235294409.18891544443957.6532206350362
Trimmed Mean ( 20 / 24 )23584.75405.8853624108158.1069242308105
Trimmed Mean ( 21 / 24 )23578.0666666667399.97520593654958.9488206186636
Trimmed Mean ( 22 / 24 )23574.6071428571396.05991456348759.5228304506394
Trimmed Mean ( 23 / 24 )23574.1923076923389.6113211877160.5069489146968
Trimmed Mean ( 24 / 24 )23577.5833333333381.77179861771761.7583158805883
Median23404.5
Midrange22018.5
Midmean - Weighted Average at Xnp23493.0540540541
Midmean - Weighted Average at X(n+1)p23595.25
Midmean - Empirical Distribution Function23493.0540540541
Midmean - Empirical Distribution Function - Averaging23595.25
Midmean - Empirical Distribution Function - Interpolation23595.25
Midmean - Closest Observation23493.0540540541
Midmean - True Basic - Statistics Graphics Toolkit23595.25
Midmean - MS Excel (old versions)23600.1052631579
Number of observations72


Parameters (Session):
Parameters (R input):
R code (references can be found in the software module):
geomean <- function(x) {
return(exp(mean(log(x))))
}
harmean <- function(x) {
return(1/mean(1/x))
}
quamean <- function(x) {
return(sqrt(mean(x*x)))
}
winmean <- function(x) {
x <-sort(x[!is.na(x)])
n<-length(x)
denom <- 3
nodenom <- n/denom
if (nodenom>40) denom <- n/40
sqrtn = sqrt(n)
roundnodenom = floor(nodenom)
win <- array(NA,dim=c(roundnodenom,2))
for (j in 1:roundnodenom) {
win[j,1] <- (j*x[j+1]+sum(x[(j+1):(n-j)])+j*x[n-j])/n
win[j,2] <- sd(c(rep(x[j+1],j),x[(j+1):(n-j)],rep(x[n-j],j)))/sqrtn
}
return(win)
}
trimean <- function(x) {
x <-sort(x[!is.na(x)])
n<-length(x)
denom <- 3
nodenom <- n/denom
if (nodenom>40) denom <- n/40
sqrtn = sqrt(n)
roundnodenom = floor(nodenom)
tri <- array(NA,dim=c(roundnodenom,2))
for (j in 1:roundnodenom) {
tri[j,1] <- mean(x,trim=j/n)
tri[j,2] <- sd(x[(j+1):(n-j)]) / sqrt(n-j*2)
}
return(tri)
}
midrange <- function(x) {
return((max(x)+min(x))/2)
}
q1 <- function(data,n,p,i,f) {
np <- n*p;
i <<- floor(np)
f <<- np - i
qvalue <- (1-f)*data[i] + f*data[i+1]
}
q2 <- function(data,n,p,i,f) {
np <- (n+1)*p
i <<- floor(np)
f <<- np - i
qvalue <- (1-f)*data[i] + f*data[i+1]
}
q3 <- function(data,n,p,i,f) {
np <- n*p
i <<- floor(np)
f <<- np - i
if (f==0) {
qvalue <- data[i]
} else {
qvalue <- data[i+1]
}
}
q4 <- function(data,n,p,i,f) {
np <- n*p
i <<- floor(np)
f <<- np - i
if (f==0) {
qvalue <- (data[i]+data[i+1])/2
} else {
qvalue <- data[i+1]
}
}
q5 <- function(data,n,p,i,f) {
np <- (n-1)*p
i <<- floor(np)
f <<- np - i
if (f==0) {
qvalue <- data[i+1]
} else {
qvalue <- data[i+1] + f*(data[i+2]-data[i+1])
}
}
q6 <- function(data,n,p,i,f) {
np <- n*p+0.5
i <<- floor(np)
f <<- np - i
qvalue <- data[i]
}
q7 <- function(data,n,p,i,f) {
np <- (n+1)*p
i <<- floor(np)
f <<- np - i
if (f==0) {
qvalue <- data[i]
} else {
qvalue <- f*data[i] + (1-f)*data[i+1]
}
}
q8 <- function(data,n,p,i,f) {
np <- (n+1)*p
i <<- floor(np)
f <<- np - i
if (f==0) {
qvalue <- data[i]
} else {
if (f == 0.5) {
qvalue <- (data[i]+data[i+1])/2
} else {
if (f < 0.5) {
qvalue <- data[i]
} else {
qvalue <- data[i+1]
}
}
}
}
midmean <- function(x,def) {
x <-sort(x[!is.na(x)])
n<-length(x)
if (def==1) {
qvalue1 <- q1(x,n,0.25,i,f)
qvalue3 <- q1(x,n,0.75,i,f)
}
if (def==2) {
qvalue1 <- q2(x,n,0.25,i,f)
qvalue3 <- q2(x,n,0.75,i,f)
}
if (def==3) {
qvalue1 <- q3(x,n,0.25,i,f)
qvalue3 <- q3(x,n,0.75,i,f)
}
if (def==4) {
qvalue1 <- q4(x,n,0.25,i,f)
qvalue3 <- q4(x,n,0.75,i,f)
}
if (def==5) {
qvalue1 <- q5(x,n,0.25,i,f)
qvalue3 <- q5(x,n,0.75,i,f)
}
if (def==6) {
qvalue1 <- q6(x,n,0.25,i,f)
qvalue3 <- q6(x,n,0.75,i,f)
}
if (def==7) {
qvalue1 <- q7(x,n,0.25,i,f)
qvalue3 <- q7(x,n,0.75,i,f)
}
if (def==8) {
qvalue1 <- q8(x,n,0.25,i,f)
qvalue3 <- q8(x,n,0.75,i,f)
}
midm <- 0
myn <- 0
roundno4 <- round(n/4)
round3no4 <- round(3*n/4)
for (i in 1:n) {
if ((x[i]>=qvalue1) & (x[i]<=qvalue3)){
midm = midm + x[i]
myn = myn + 1
}
}
midm = midm / myn
return(midm)
}
(arm <- mean(x))
sqrtn <- sqrt(length(x))
(armse <- sd(x) / sqrtn)
(armose <- arm / armse)
(geo <- geomean(x))
(har <- harmean(x))
(qua <- quamean(x))
(win <- winmean(x))
(tri <- trimean(x))
(midr <- midrange(x))
midm <- array(NA,dim=8)
for (j in 1:8) midm[j] <- midmean(x,j)
midm
bitmap(file='test1.png')
lb <- win[,1] - 2*win[,2]
ub <- win[,1] + 2*win[,2]
if ((ylimmin == '') | (ylimmax == '')) plot(win[,1],type='b',main=main, xlab='j', pch=19, ylab='Winsorized Mean(j/n)', ylim=c(min(lb),max(ub))) else plot(win[,1],type='l',main=main, xlab='j', pch=19, ylab='Winsorized Mean(j/n)', ylim=c(ylimmin,ylimmax))
lines(ub,lty=3)
lines(lb,lty=3)
grid()
dev.off()
bitmap(file='test2.png')
lb <- tri[,1] - 2*tri[,2]
ub <- tri[,1] + 2*tri[,2]
if ((ylimmin == '') | (ylimmax == '')) plot(tri[,1],type='b',main=main, xlab='j', pch=19, ylab='Trimmed Mean(j/n)', ylim=c(min(lb),max(ub))) else plot(tri[,1],type='l',main=main, xlab='j', pch=19, ylab='Trimmed Mean(j/n)', ylim=c(ylimmin,ylimmax))
lines(ub,lty=3)
lines(lb,lty=3)
grid()
dev.off()
load(file='createtable')
a<-table.start()
a<-table.row.start(a)
a<-table.element(a,'Central Tendency - Ungrouped Data',4,TRUE)
a<-table.row.end(a)
a<-table.row.start(a)
a<-table.element(a,'Measure',header=TRUE)
a<-table.element(a,'Value',header=TRUE)
a<-table.element(a,'S.E.',header=TRUE)
a<-table.element(a,'Value/S.E.',header=TRUE)
a<-table.row.end(a)
a<-table.row.start(a)
a<-table.element(a,hyperlink('arithmetic_mean.htm', 'Arithmetic Mean', 'click to view the definition of the Arithmetic Mean'),header=TRUE)
a<-table.element(a,arm)
a<-table.element(a,hyperlink('arithmetic_mean_standard_error.htm', armse, 'click to view the definition of the Standard Error of the Arithmetic Mean'))
a<-table.element(a,armose)
a<-table.row.end(a)
a<-table.row.start(a)
a<-table.element(a,hyperlink('geometric_mean.htm', 'Geometric Mean', 'click to view the definition of the Geometric Mean'),header=TRUE)
a<-table.element(a,geo)
a<-table.element(a,'')
a<-table.row.end(a)
a<-table.row.start(a)
a<-table.element(a,hyperlink('harmonic_mean.htm', 'Harmonic Mean', 'click to view the definition of the Harmonic Mean'),header=TRUE)
a<-table.element(a,har)
a<-table.element(a,'')
a<-table.row.end(a)
a<-table.row.start(a)
a<-table.element(a,hyperlink('quadratic_mean.htm', 'Quadratic Mean', 'click to view the definition of the Quadratic Mean'),header=TRUE)
a<-table.element(a,qua)
a<-table.element(a,'')
a<-table.row.end(a)
for (j in 1:length(win[,1])) {
a<-table.row.start(a)
mylabel <- paste('Winsorized Mean (',j)
mylabel <- paste(mylabel,'/')
mylabel <- paste(mylabel,length(win[,1]))
mylabel <- paste(mylabel,')')
a<-table.element(a,hyperlink('winsorized_mean.htm', mylabel, 'click to view the definition of the Winsorized Mean'),header=TRUE)
a<-table.element(a,win[j,1])
a<-table.element(a,win[j,2])
a<-table.element(a,win[j,1]/win[j,2])
a<-table.row.end(a)
}
for (j in 1:length(tri[,1])) {
a<-table.row.start(a)
mylabel <- paste('Trimmed Mean (',j)
mylabel <- paste(mylabel,'/')
mylabel <- paste(mylabel,length(tri[,1]))
mylabel <- paste(mylabel,')')
a<-table.element(a,hyperlink('arithmetic_mean.htm', mylabel, 'click to view the definition of the Trimmed Mean'),header=TRUE)
a<-table.element(a,tri[j,1])
a<-table.element(a,tri[j,2])
a<-table.element(a,tri[j,1]/tri[j,2])
a<-table.row.end(a)
}
a<-table.row.start(a)
a<-table.element(a,hyperlink('median_1.htm', 'Median', 'click to view the definition of the Median'),header=TRUE)
a<-table.element(a,median(x))
a<-table.element(a,'')
a<-table.row.end(a)
a<-table.row.start(a)
a<-table.element(a,hyperlink('midrange.htm', 'Midrange', 'click to view the definition of the Midrange'),header=TRUE)
a<-table.element(a,midr)
a<-table.element(a,'')
a<-table.row.end(a)
a<-table.row.start(a)
mymid <- hyperlink('midmean.htm', 'Midmean', 'click to view the definition of the Midmean')
mylabel <- paste(mymid,hyperlink('method_1.htm','Weighted Average at Xnp',''),sep=' - ')
a<-table.element(a,mylabel,header=TRUE)
a<-table.element(a,midm[1])
a<-table.element(a,'')
a<-table.row.end(a)
a<-table.row.start(a)
mymid <- hyperlink('midmean.htm', 'Midmean', 'click to view the definition of the Midmean')
mylabel <- paste(mymid,hyperlink('method_2.htm','Weighted Average at X(n+1)p',''),sep=' - ')
a<-table.element(a,mylabel,header=TRUE)
a<-table.element(a,midm[2])
a<-table.element(a,'')
a<-table.row.end(a)
a<-table.row.start(a)
mymid <- hyperlink('midmean.htm', 'Midmean', 'click to view the definition of the Midmean')
mylabel <- paste(mymid,hyperlink('method_3.htm','Empirical Distribution Function',''),sep=' - ')
a<-table.element(a,mylabel,header=TRUE)
a<-table.element(a,midm[3])
a<-table.element(a,'')
a<-table.row.end(a)
a<-table.row.start(a)
mymid <- hyperlink('midmean.htm', 'Midmean', 'click to view the definition of the Midmean')
mylabel <- paste(mymid,hyperlink('method_4.htm','Empirical Distribution Function - Averaging',''),sep=' - ')
a<-table.element(a,mylabel,header=TRUE)
a<-table.element(a,midm[4])
a<-table.element(a,'')
a<-table.row.end(a)
a<-table.row.start(a)
mymid <- hyperlink('midmean.htm', 'Midmean', 'click to view the definition of the Midmean')
mylabel <- paste(mymid,hyperlink('method_5.htm','Empirical Distribution Function - Interpolation',''),sep=' - ')
a<-table.element(a,mylabel,header=TRUE)
a<-table.element(a,midm[5])
a<-table.element(a,'')
a<-table.row.end(a)
a<-table.row.start(a)
mymid <- hyperlink('midmean.htm', 'Midmean', 'click to view the definition of the Midmean')
mylabel <- paste(mymid,hyperlink('method_6.htm','Closest Observation',''),sep=' - ')
a<-table.element(a,mylabel,header=TRUE)
a<-table.element(a,midm[6])
a<-table.element(a,'')
a<-table.row.end(a)
a<-table.row.start(a)
mymid <- hyperlink('midmean.htm', 'Midmean', 'click to view the definition of the Midmean')
mylabel <- paste(mymid,hyperlink('method_7.htm','True Basic - Statistics Graphics Toolkit',''),sep=' - ')
a<-table.element(a,mylabel,header=TRUE)
a<-table.element(a,midm[7])
a<-table.element(a,'')
a<-table.row.end(a)
a<-table.row.start(a)
mymid <- hyperlink('midmean.htm', 'Midmean', 'click to view the definition of the Midmean')
mylabel <- paste(mymid,hyperlink('method_8.htm','MS Excel (old versions)',''),sep=' - ')
a<-table.element(a,mylabel,header=TRUE)
a<-table.element(a,midm[8])
a<-table.element(a,'')
a<-table.row.end(a)
a<-table.row.start(a)
a<-table.element(a,'Number of observations',header=TRUE)
a<-table.element(a,length(x))
a<-table.element(a,'')
a<-table.row.end(a)
a<-table.end(a)
table.save(a,file='mytable.tab')