Free Statistics

of Irreproducible Research!

Author's title

Author*Unverified author*
R Software Modulerwasp_centraltendency.wasp
Title produced by softwareCentral Tendency
Date of computationTue, 09 Oct 2012 13:30:12 -0400
Cite this page as followsStatistical Computations at FreeStatistics.org, Office for Research Development and Education, URL https://freestatistics.org/blog/index.php?v=date/2012/Oct/09/t1349803839xvyzdk8ibl8gsk6.htm/, Retrieved Wed, 01 May 2024 16:28:19 +0000
Statistical Computations at FreeStatistics.org, Office for Research Development and Education, URL https://freestatistics.org/blog/index.php?pk=174695, Retrieved Wed, 01 May 2024 16:28:19 +0000
QR Codes:

Original text written by user:
IsPrivate?No (this computation is public)
User-defined keywords
Estimated Impact103
Family? (F = Feedback message, R = changed R code, M = changed R Module, P = changed Parameters, D = changed Data)
-       [Central Tendency] [Centrummaten prij...] [2012-10-09 17:30:12] [759d976b0145c646d806dbc713cd6623] [Current]
Feedback Forum

Post a new message
Dataseries X:
113,4
114,9
120,4
124,9
123,6
123,3
123
123,1
126,4
128,4
128,5
131,5
121,9
109
98,9
95
91,7
97,1
99,7
101
101,1
94,2
93,1
97,8
81,9
78,5
72,3
68,1
72,6
73,7
71
64,7
64,2
62,4
75,5
84
80,2
93,5
109,3
148,8
164,6
182,5
163
138,3
126
125,3
131,3
96,1
93
89,6
77,3
68,3
69,1
66,4
64,2
54,9
54,9
54,7
54,8
52,3
52,5
45,7
45,5
48,2
52
53,8
53,5
52,9
55,1
53,8
49,9
45,3


Summary of computational transaction
Raw Inputview raw input (R code)
Raw Outputview raw output of R engine
Computing time2 seconds
R Server'Sir Maurice George Kendall' @ kendall.wessa.net

\begin{tabular}{lllllllll}
\hline
Summary of computational transaction \tabularnewline
Raw Input & view raw input (R code)  \tabularnewline
Raw Output & view raw output of R engine  \tabularnewline
Computing time & 2 seconds \tabularnewline
R Server & 'Sir Maurice George Kendall' @ kendall.wessa.net \tabularnewline
\hline
\end{tabular}
%Source: https://freestatistics.org/blog/index.php?pk=174695&T=0

[TABLE]
[ROW][C]Summary of computational transaction[/C][/ROW]
[ROW][C]Raw Input[/C][C]view raw input (R code) [/C][/ROW]
[ROW][C]Raw Output[/C][C]view raw output of R engine [/C][/ROW]
[ROW][C]Computing time[/C][C]2 seconds[/C][/ROW]
[ROW][C]R Server[/C][C]'Sir Maurice George Kendall' @ kendall.wessa.net[/C][/ROW]
[/TABLE]
Source: https://freestatistics.org/blog/index.php?pk=174695&T=0

Globally Unique Identifier (entire table): ba.freestatistics.org/blog/index.php?pk=174695&T=0

As an alternative you can also use a QR Code:  

The GUIDs for individual cells are displayed in the table below:

Summary of computational transaction
Raw Inputview raw input (R code)
Raw Outputview raw output of R engine
Computing time2 seconds
R Server'Sir Maurice George Kendall' @ kendall.wessa.net


Central Tendency - Ungrouped Data
MeasureValueS.E.Value/S.E.
Arithmetic Mean90.51944444444443.8882279088401323.2803854523658
Geometric Mean84.748416231518
Harmonic Mean79.3310872709752
Quadratic Mean96.2661429464055
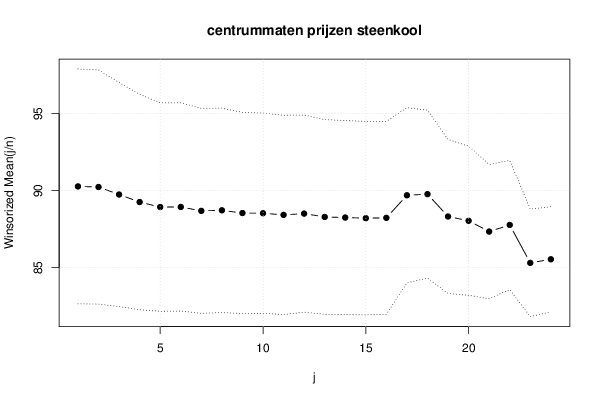
Winsorized Mean ( 1 / 24 )90.27361111111113.8121464884235723.6805199866393
Winsorized Mean ( 2 / 24 )90.23472222222223.7991310264366723.7514109395843
Winsorized Mean ( 3 / 24 )89.74722222222223.6343663584124924.6940493531929
Winsorized Mean ( 4 / 24 )89.25833333333333.4946957067736425.5410887878814
Winsorized Mean ( 5 / 24 )88.93194444444453.3833268729493226.2853539678596
Winsorized Mean ( 6 / 24 )88.94027777777783.376545411970826.3406135343122
Winsorized Mean ( 7 / 24 )88.68753.3265682156699426.6603581379254
Winsorized Mean ( 8 / 24 )88.72083333333333.3179120609282626.7399592587489
Winsorized Mean ( 9 / 24 )88.54583333333333.265069156126427.1191295189539
Winsorized Mean ( 10 / 24 )88.53194444444443.2497368536713727.2428040887145
Winsorized Mean ( 11 / 24 )88.4253.2324618580173227.3553111789034
Winsorized Mean ( 12 / 24 )88.50833333333333.1992869840907927.6650184161227
Winsorized Mean ( 13 / 24 )88.29166666666673.1593173612915827.9464379705658
Winsorized Mean ( 14 / 24 )88.25277777777783.1472489491079828.041244656795
Winsorized Mean ( 15 / 24 )88.21111111111113.1407218324668828.0862539939826
Winsorized Mean ( 16 / 24 )88.23333333333333.1306132684539228.1840411980711
Winsorized Mean ( 17 / 24 )89.69722222222222.8440703574371231.5383274494837
Winsorized Mean ( 18 / 24 )89.77222222222222.7242974588069332.9524303346584
Winsorized Mean ( 19 / 24 )88.32083333333332.5004733022236135.3216462078567
Winsorized Mean ( 20 / 24 )88.04305555555562.4196548034210736.3866182197041
Winsorized Mean ( 21 / 24 )87.34305555555562.1791189896748540.0818202078025
Winsorized Mean ( 22 / 24 )87.77083333333332.0965845590818141.8637220965569
Winsorized Mean ( 23 / 24 )85.31111111111111.7455359512939348.8738779902366
Winsorized Mean ( 24 / 24 )85.54444444444441.7048672485698250.176601442843
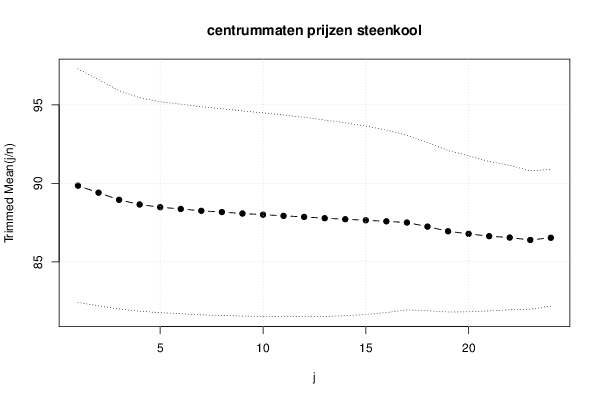
Trimmed Mean ( 1 / 24 )89.85142857142863.7174640963830524.1700864465243
Trimmed Mean ( 2 / 24 )89.40441176470593.6041017956483524.8062948368035
Trimmed Mean ( 3 / 24 )88.95151515151523.4762083424625525.5886605140881
Trimmed Mean ( 4 / 24 )88.6531253.3993550747686226.0793953706158
Trimmed Mean ( 5 / 24 )88.47741935483873.357104449885326.3552774945271
Trimmed Mean ( 6 / 24 )88.36833333333333.3379113971601926.4741399093202
Trimmed Mean ( 7 / 24 )88.253.3134579108966726.6338074522631
Trimmed Mean ( 8 / 24 )88.16964285714293.2929528449765826.775252184873
Trimmed Mean ( 9 / 24 )88.07777777777783.2663721540393926.9650161169956
Trimmed Mean ( 10 / 24 )88.00576923076923.2418088137765727.1471188728882
Trimmed Mean ( 11 / 24 )87.933.2107501189800827.3861237223692
Trimmed Mean ( 12 / 24 )87.86253.1717427936846927.7016472378985
Trimmed Mean ( 13 / 24 )87.77826086956523.1256611482927328.0831020078778
Trimmed Mean ( 14 / 24 )87.71363636363643.0717676954707328.554775314868
Trimmed Mean ( 15 / 24 )87.6476190476193.0010784706783129.2053739693813
Trimmed Mean ( 16 / 24 )87.582.9066329979230930.1310829618254
Trimmed Mean ( 17 / 24 )87.50263157894742.7804859703008631.4702654548835
Trimmed Mean ( 18 / 24 )87.24444444444442.6806491882651732.546013415842
Trimmed Mean ( 19 / 24 )86.94705882352942.5717623166697233.8083571175897
Trimmed Mean ( 20 / 24 )86.7843752.4840666018769534.9364123065083
Trimmed Mean ( 21 / 24 )86.63333333333332.3791302058522336.4138680263195
Trimmed Mean ( 22 / 24 )86.54642857142862.3005203123387137.6203714034785
Trimmed Mean ( 23 / 24 )86.39230769230772.2034931923018839.2069773549235
Trimmed Mean ( 24 / 24 )86.53333333333332.17523667433539.7811118000701
Median90.65
Midrange113.9
Midmean - Weighted Average at Xnp86.572972972973
Midmean - Weighted Average at X(n+1)p87.2444444444445
Midmean - Empirical Distribution Function86.572972972973
Midmean - Empirical Distribution Function - Averaging87.2444444444445
Midmean - Empirical Distribution Function - Interpolation87.2444444444445
Midmean - Closest Observation86.572972972973
Midmean - True Basic - Statistics Graphics Toolkit87.2444444444445
Midmean - MS Excel (old versions)87.5026315789474
Number of observations72

\begin{tabular}{lllllllll}
\hline
Central Tendency - Ungrouped Data \tabularnewline
Measure & Value & S.E. & Value/S.E. \tabularnewline
Arithmetic Mean & 90.5194444444444 & 3.88822790884013 & 23.2803854523658 \tabularnewline
Geometric Mean & 84.748416231518 &  &  \tabularnewline
Harmonic Mean & 79.3310872709752 &  &  \tabularnewline
Quadratic Mean & 96.2661429464055 &  &  \tabularnewline
Winsorized Mean ( 1 / 24 ) & 90.2736111111111 & 3.81214648842357 & 23.6805199866393 \tabularnewline
Winsorized Mean ( 2 / 24 ) & 90.2347222222222 & 3.79913102643667 & 23.7514109395843 \tabularnewline
Winsorized Mean ( 3 / 24 ) & 89.7472222222222 & 3.63436635841249 & 24.6940493531929 \tabularnewline
Winsorized Mean ( 4 / 24 ) & 89.2583333333333 & 3.49469570677364 & 25.5410887878814 \tabularnewline
Winsorized Mean ( 5 / 24 ) & 88.9319444444445 & 3.38332687294932 & 26.2853539678596 \tabularnewline
Winsorized Mean ( 6 / 24 ) & 88.9402777777778 & 3.3765454119708 & 26.3406135343122 \tabularnewline
Winsorized Mean ( 7 / 24 ) & 88.6875 & 3.32656821566994 & 26.6603581379254 \tabularnewline
Winsorized Mean ( 8 / 24 ) & 88.7208333333333 & 3.31791206092826 & 26.7399592587489 \tabularnewline
Winsorized Mean ( 9 / 24 ) & 88.5458333333333 & 3.2650691561264 & 27.1191295189539 \tabularnewline
Winsorized Mean ( 10 / 24 ) & 88.5319444444444 & 3.24973685367137 & 27.2428040887145 \tabularnewline
Winsorized Mean ( 11 / 24 ) & 88.425 & 3.23246185801732 & 27.3553111789034 \tabularnewline
Winsorized Mean ( 12 / 24 ) & 88.5083333333333 & 3.19928698409079 & 27.6650184161227 \tabularnewline
Winsorized Mean ( 13 / 24 ) & 88.2916666666667 & 3.15931736129158 & 27.9464379705658 \tabularnewline
Winsorized Mean ( 14 / 24 ) & 88.2527777777778 & 3.14724894910798 & 28.041244656795 \tabularnewline
Winsorized Mean ( 15 / 24 ) & 88.2111111111111 & 3.14072183246688 & 28.0862539939826 \tabularnewline
Winsorized Mean ( 16 / 24 ) & 88.2333333333333 & 3.13061326845392 & 28.1840411980711 \tabularnewline
Winsorized Mean ( 17 / 24 ) & 89.6972222222222 & 2.84407035743712 & 31.5383274494837 \tabularnewline
Winsorized Mean ( 18 / 24 ) & 89.7722222222222 & 2.72429745880693 & 32.9524303346584 \tabularnewline
Winsorized Mean ( 19 / 24 ) & 88.3208333333333 & 2.50047330222361 & 35.3216462078567 \tabularnewline
Winsorized Mean ( 20 / 24 ) & 88.0430555555556 & 2.41965480342107 & 36.3866182197041 \tabularnewline
Winsorized Mean ( 21 / 24 ) & 87.3430555555556 & 2.17911898967485 & 40.0818202078025 \tabularnewline
Winsorized Mean ( 22 / 24 ) & 87.7708333333333 & 2.09658455908181 & 41.8637220965569 \tabularnewline
Winsorized Mean ( 23 / 24 ) & 85.3111111111111 & 1.74553595129393 & 48.8738779902366 \tabularnewline
Winsorized Mean ( 24 / 24 ) & 85.5444444444444 & 1.70486724856982 & 50.176601442843 \tabularnewline
Trimmed Mean ( 1 / 24 ) & 89.8514285714286 & 3.71746409638305 & 24.1700864465243 \tabularnewline
Trimmed Mean ( 2 / 24 ) & 89.4044117647059 & 3.60410179564835 & 24.8062948368035 \tabularnewline
Trimmed Mean ( 3 / 24 ) & 88.9515151515152 & 3.47620834246255 & 25.5886605140881 \tabularnewline
Trimmed Mean ( 4 / 24 ) & 88.653125 & 3.39935507476862 & 26.0793953706158 \tabularnewline
Trimmed Mean ( 5 / 24 ) & 88.4774193548387 & 3.3571044498853 & 26.3552774945271 \tabularnewline
Trimmed Mean ( 6 / 24 ) & 88.3683333333333 & 3.33791139716019 & 26.4741399093202 \tabularnewline
Trimmed Mean ( 7 / 24 ) & 88.25 & 3.31345791089667 & 26.6338074522631 \tabularnewline
Trimmed Mean ( 8 / 24 ) & 88.1696428571429 & 3.29295284497658 & 26.775252184873 \tabularnewline
Trimmed Mean ( 9 / 24 ) & 88.0777777777778 & 3.26637215403939 & 26.9650161169956 \tabularnewline
Trimmed Mean ( 10 / 24 ) & 88.0057692307692 & 3.24180881377657 & 27.1471188728882 \tabularnewline
Trimmed Mean ( 11 / 24 ) & 87.93 & 3.21075011898008 & 27.3861237223692 \tabularnewline
Trimmed Mean ( 12 / 24 ) & 87.8625 & 3.17174279368469 & 27.7016472378985 \tabularnewline
Trimmed Mean ( 13 / 24 ) & 87.7782608695652 & 3.12566114829273 & 28.0831020078778 \tabularnewline
Trimmed Mean ( 14 / 24 ) & 87.7136363636364 & 3.07176769547073 & 28.554775314868 \tabularnewline
Trimmed Mean ( 15 / 24 ) & 87.647619047619 & 3.00107847067831 & 29.2053739693813 \tabularnewline
Trimmed Mean ( 16 / 24 ) & 87.58 & 2.90663299792309 & 30.1310829618254 \tabularnewline
Trimmed Mean ( 17 / 24 ) & 87.5026315789474 & 2.78048597030086 & 31.4702654548835 \tabularnewline
Trimmed Mean ( 18 / 24 ) & 87.2444444444444 & 2.68064918826517 & 32.546013415842 \tabularnewline
Trimmed Mean ( 19 / 24 ) & 86.9470588235294 & 2.57176231666972 & 33.8083571175897 \tabularnewline
Trimmed Mean ( 20 / 24 ) & 86.784375 & 2.48406660187695 & 34.9364123065083 \tabularnewline
Trimmed Mean ( 21 / 24 ) & 86.6333333333333 & 2.37913020585223 & 36.4138680263195 \tabularnewline
Trimmed Mean ( 22 / 24 ) & 86.5464285714286 & 2.30052031233871 & 37.6203714034785 \tabularnewline
Trimmed Mean ( 23 / 24 ) & 86.3923076923077 & 2.20349319230188 & 39.2069773549235 \tabularnewline
Trimmed Mean ( 24 / 24 ) & 86.5333333333333 & 2.175236674335 & 39.7811118000701 \tabularnewline
Median & 90.65 &  &  \tabularnewline
Midrange & 113.9 &  &  \tabularnewline
Midmean - Weighted Average at Xnp & 86.572972972973 &  &  \tabularnewline
Midmean - Weighted Average at X(n+1)p & 87.2444444444445 &  &  \tabularnewline
Midmean - Empirical Distribution Function & 86.572972972973 &  &  \tabularnewline
Midmean - Empirical Distribution Function - Averaging & 87.2444444444445 &  &  \tabularnewline
Midmean - Empirical Distribution Function - Interpolation & 87.2444444444445 &  &  \tabularnewline
Midmean - Closest Observation & 86.572972972973 &  &  \tabularnewline
Midmean - True Basic - Statistics Graphics Toolkit & 87.2444444444445 &  &  \tabularnewline
Midmean - MS Excel (old versions) & 87.5026315789474 &  &  \tabularnewline
Number of observations & 72 &  &  \tabularnewline
\hline
\end{tabular}
%Source: https://freestatistics.org/blog/index.php?pk=174695&T=1

[TABLE]
[ROW][C]Central Tendency - Ungrouped Data[/C][/ROW]
[ROW][C]Measure[/C][C]Value[/C][C]S.E.[/C][C]Value/S.E.[/C][/ROW]
[ROW][C]Arithmetic Mean[/C][C]90.5194444444444[/C][C]3.88822790884013[/C][C]23.2803854523658[/C][/ROW]
[ROW][C]Geometric Mean[/C][C]84.748416231518[/C][C][/C][C][/C][/ROW]
[ROW][C]Harmonic Mean[/C][C]79.3310872709752[/C][C][/C][C][/C][/ROW]
[ROW][C]Quadratic Mean[/C][C]96.2661429464055[/C][C][/C][C][/C][/ROW]
[ROW][C]Winsorized Mean ( 1 / 24 )[/C][C]90.2736111111111[/C][C]3.81214648842357[/C][C]23.6805199866393[/C][/ROW]
[ROW][C]Winsorized Mean ( 2 / 24 )[/C][C]90.2347222222222[/C][C]3.79913102643667[/C][C]23.7514109395843[/C][/ROW]
[ROW][C]Winsorized Mean ( 3 / 24 )[/C][C]89.7472222222222[/C][C]3.63436635841249[/C][C]24.6940493531929[/C][/ROW]
[ROW][C]Winsorized Mean ( 4 / 24 )[/C][C]89.2583333333333[/C][C]3.49469570677364[/C][C]25.5410887878814[/C][/ROW]
[ROW][C]Winsorized Mean ( 5 / 24 )[/C][C]88.9319444444445[/C][C]3.38332687294932[/C][C]26.2853539678596[/C][/ROW]
[ROW][C]Winsorized Mean ( 6 / 24 )[/C][C]88.9402777777778[/C][C]3.3765454119708[/C][C]26.3406135343122[/C][/ROW]
[ROW][C]Winsorized Mean ( 7 / 24 )[/C][C]88.6875[/C][C]3.32656821566994[/C][C]26.6603581379254[/C][/ROW]
[ROW][C]Winsorized Mean ( 8 / 24 )[/C][C]88.7208333333333[/C][C]3.31791206092826[/C][C]26.7399592587489[/C][/ROW]
[ROW][C]Winsorized Mean ( 9 / 24 )[/C][C]88.5458333333333[/C][C]3.2650691561264[/C][C]27.1191295189539[/C][/ROW]
[ROW][C]Winsorized Mean ( 10 / 24 )[/C][C]88.5319444444444[/C][C]3.24973685367137[/C][C]27.2428040887145[/C][/ROW]
[ROW][C]Winsorized Mean ( 11 / 24 )[/C][C]88.425[/C][C]3.23246185801732[/C][C]27.3553111789034[/C][/ROW]
[ROW][C]Winsorized Mean ( 12 / 24 )[/C][C]88.5083333333333[/C][C]3.19928698409079[/C][C]27.6650184161227[/C][/ROW]
[ROW][C]Winsorized Mean ( 13 / 24 )[/C][C]88.2916666666667[/C][C]3.15931736129158[/C][C]27.9464379705658[/C][/ROW]
[ROW][C]Winsorized Mean ( 14 / 24 )[/C][C]88.2527777777778[/C][C]3.14724894910798[/C][C]28.041244656795[/C][/ROW]
[ROW][C]Winsorized Mean ( 15 / 24 )[/C][C]88.2111111111111[/C][C]3.14072183246688[/C][C]28.0862539939826[/C][/ROW]
[ROW][C]Winsorized Mean ( 16 / 24 )[/C][C]88.2333333333333[/C][C]3.13061326845392[/C][C]28.1840411980711[/C][/ROW]
[ROW][C]Winsorized Mean ( 17 / 24 )[/C][C]89.6972222222222[/C][C]2.84407035743712[/C][C]31.5383274494837[/C][/ROW]
[ROW][C]Winsorized Mean ( 18 / 24 )[/C][C]89.7722222222222[/C][C]2.72429745880693[/C][C]32.9524303346584[/C][/ROW]
[ROW][C]Winsorized Mean ( 19 / 24 )[/C][C]88.3208333333333[/C][C]2.50047330222361[/C][C]35.3216462078567[/C][/ROW]
[ROW][C]Winsorized Mean ( 20 / 24 )[/C][C]88.0430555555556[/C][C]2.41965480342107[/C][C]36.3866182197041[/C][/ROW]
[ROW][C]Winsorized Mean ( 21 / 24 )[/C][C]87.3430555555556[/C][C]2.17911898967485[/C][C]40.0818202078025[/C][/ROW]
[ROW][C]Winsorized Mean ( 22 / 24 )[/C][C]87.7708333333333[/C][C]2.09658455908181[/C][C]41.8637220965569[/C][/ROW]
[ROW][C]Winsorized Mean ( 23 / 24 )[/C][C]85.3111111111111[/C][C]1.74553595129393[/C][C]48.8738779902366[/C][/ROW]
[ROW][C]Winsorized Mean ( 24 / 24 )[/C][C]85.5444444444444[/C][C]1.70486724856982[/C][C]50.176601442843[/C][/ROW]
[ROW][C]Trimmed Mean ( 1 / 24 )[/C][C]89.8514285714286[/C][C]3.71746409638305[/C][C]24.1700864465243[/C][/ROW]
[ROW][C]Trimmed Mean ( 2 / 24 )[/C][C]89.4044117647059[/C][C]3.60410179564835[/C][C]24.8062948368035[/C][/ROW]
[ROW][C]Trimmed Mean ( 3 / 24 )[/C][C]88.9515151515152[/C][C]3.47620834246255[/C][C]25.5886605140881[/C][/ROW]
[ROW][C]Trimmed Mean ( 4 / 24 )[/C][C]88.653125[/C][C]3.39935507476862[/C][C]26.0793953706158[/C][/ROW]
[ROW][C]Trimmed Mean ( 5 / 24 )[/C][C]88.4774193548387[/C][C]3.3571044498853[/C][C]26.3552774945271[/C][/ROW]
[ROW][C]Trimmed Mean ( 6 / 24 )[/C][C]88.3683333333333[/C][C]3.33791139716019[/C][C]26.4741399093202[/C][/ROW]
[ROW][C]Trimmed Mean ( 7 / 24 )[/C][C]88.25[/C][C]3.31345791089667[/C][C]26.6338074522631[/C][/ROW]
[ROW][C]Trimmed Mean ( 8 / 24 )[/C][C]88.1696428571429[/C][C]3.29295284497658[/C][C]26.775252184873[/C][/ROW]
[ROW][C]Trimmed Mean ( 9 / 24 )[/C][C]88.0777777777778[/C][C]3.26637215403939[/C][C]26.9650161169956[/C][/ROW]
[ROW][C]Trimmed Mean ( 10 / 24 )[/C][C]88.0057692307692[/C][C]3.24180881377657[/C][C]27.1471188728882[/C][/ROW]
[ROW][C]Trimmed Mean ( 11 / 24 )[/C][C]87.93[/C][C]3.21075011898008[/C][C]27.3861237223692[/C][/ROW]
[ROW][C]Trimmed Mean ( 12 / 24 )[/C][C]87.8625[/C][C]3.17174279368469[/C][C]27.7016472378985[/C][/ROW]
[ROW][C]Trimmed Mean ( 13 / 24 )[/C][C]87.7782608695652[/C][C]3.12566114829273[/C][C]28.0831020078778[/C][/ROW]
[ROW][C]Trimmed Mean ( 14 / 24 )[/C][C]87.7136363636364[/C][C]3.07176769547073[/C][C]28.554775314868[/C][/ROW]
[ROW][C]Trimmed Mean ( 15 / 24 )[/C][C]87.647619047619[/C][C]3.00107847067831[/C][C]29.2053739693813[/C][/ROW]
[ROW][C]Trimmed Mean ( 16 / 24 )[/C][C]87.58[/C][C]2.90663299792309[/C][C]30.1310829618254[/C][/ROW]
[ROW][C]Trimmed Mean ( 17 / 24 )[/C][C]87.5026315789474[/C][C]2.78048597030086[/C][C]31.4702654548835[/C][/ROW]
[ROW][C]Trimmed Mean ( 18 / 24 )[/C][C]87.2444444444444[/C][C]2.68064918826517[/C][C]32.546013415842[/C][/ROW]
[ROW][C]Trimmed Mean ( 19 / 24 )[/C][C]86.9470588235294[/C][C]2.57176231666972[/C][C]33.8083571175897[/C][/ROW]
[ROW][C]Trimmed Mean ( 20 / 24 )[/C][C]86.784375[/C][C]2.48406660187695[/C][C]34.9364123065083[/C][/ROW]
[ROW][C]Trimmed Mean ( 21 / 24 )[/C][C]86.6333333333333[/C][C]2.37913020585223[/C][C]36.4138680263195[/C][/ROW]
[ROW][C]Trimmed Mean ( 22 / 24 )[/C][C]86.5464285714286[/C][C]2.30052031233871[/C][C]37.6203714034785[/C][/ROW]
[ROW][C]Trimmed Mean ( 23 / 24 )[/C][C]86.3923076923077[/C][C]2.20349319230188[/C][C]39.2069773549235[/C][/ROW]
[ROW][C]Trimmed Mean ( 24 / 24 )[/C][C]86.5333333333333[/C][C]2.175236674335[/C][C]39.7811118000701[/C][/ROW]
[ROW][C]Median[/C][C]90.65[/C][C][/C][C][/C][/ROW]
[ROW][C]Midrange[/C][C]113.9[/C][C][/C][C][/C][/ROW]
[ROW][C]Midmean - Weighted Average at Xnp[/C][C]86.572972972973[/C][C][/C][C][/C][/ROW]
[ROW][C]Midmean - Weighted Average at X(n+1)p[/C][C]87.2444444444445[/C][C][/C][C][/C][/ROW]
[ROW][C]Midmean - Empirical Distribution Function[/C][C]86.572972972973[/C][C][/C][C][/C][/ROW]
[ROW][C]Midmean - Empirical Distribution Function - Averaging[/C][C]87.2444444444445[/C][C][/C][C][/C][/ROW]
[ROW][C]Midmean - Empirical Distribution Function - Interpolation[/C][C]87.2444444444445[/C][C][/C][C][/C][/ROW]
[ROW][C]Midmean - Closest Observation[/C][C]86.572972972973[/C][C][/C][C][/C][/ROW]
[ROW][C]Midmean - True Basic - Statistics Graphics Toolkit[/C][C]87.2444444444445[/C][C][/C][C][/C][/ROW]
[ROW][C]Midmean - MS Excel (old versions)[/C][C]87.5026315789474[/C][C][/C][C][/C][/ROW]
[ROW][C]Number of observations[/C][C]72[/C][C][/C][C][/C][/ROW]
[/TABLE]
Source: https://freestatistics.org/blog/index.php?pk=174695&T=1

Globally Unique Identifier (entire table): ba.freestatistics.org/blog/index.php?pk=174695&T=1

As an alternative you can also use a QR Code:  

The GUIDs for individual cells are displayed in the table below:

Central Tendency - Ungrouped Data
MeasureValueS.E.Value/S.E.
Arithmetic Mean90.51944444444443.8882279088401323.2803854523658
Geometric Mean84.748416231518
Harmonic Mean79.3310872709752
Quadratic Mean96.2661429464055
Winsorized Mean ( 1 / 24 )90.27361111111113.8121464884235723.6805199866393
Winsorized Mean ( 2 / 24 )90.23472222222223.7991310264366723.7514109395843
Winsorized Mean ( 3 / 24 )89.74722222222223.6343663584124924.6940493531929
Winsorized Mean ( 4 / 24 )89.25833333333333.4946957067736425.5410887878814
Winsorized Mean ( 5 / 24 )88.93194444444453.3833268729493226.2853539678596
Winsorized Mean ( 6 / 24 )88.94027777777783.376545411970826.3406135343122
Winsorized Mean ( 7 / 24 )88.68753.3265682156699426.6603581379254
Winsorized Mean ( 8 / 24 )88.72083333333333.3179120609282626.7399592587489
Winsorized Mean ( 9 / 24 )88.54583333333333.265069156126427.1191295189539
Winsorized Mean ( 10 / 24 )88.53194444444443.2497368536713727.2428040887145
Winsorized Mean ( 11 / 24 )88.4253.2324618580173227.3553111789034
Winsorized Mean ( 12 / 24 )88.50833333333333.1992869840907927.6650184161227
Winsorized Mean ( 13 / 24 )88.29166666666673.1593173612915827.9464379705658
Winsorized Mean ( 14 / 24 )88.25277777777783.1472489491079828.041244656795
Winsorized Mean ( 15 / 24 )88.21111111111113.1407218324668828.0862539939826
Winsorized Mean ( 16 / 24 )88.23333333333333.1306132684539228.1840411980711
Winsorized Mean ( 17 / 24 )89.69722222222222.8440703574371231.5383274494837
Winsorized Mean ( 18 / 24 )89.77222222222222.7242974588069332.9524303346584
Winsorized Mean ( 19 / 24 )88.32083333333332.5004733022236135.3216462078567
Winsorized Mean ( 20 / 24 )88.04305555555562.4196548034210736.3866182197041
Winsorized Mean ( 21 / 24 )87.34305555555562.1791189896748540.0818202078025
Winsorized Mean ( 22 / 24 )87.77083333333332.0965845590818141.8637220965569
Winsorized Mean ( 23 / 24 )85.31111111111111.7455359512939348.8738779902366
Winsorized Mean ( 24 / 24 )85.54444444444441.7048672485698250.176601442843
Trimmed Mean ( 1 / 24 )89.85142857142863.7174640963830524.1700864465243
Trimmed Mean ( 2 / 24 )89.40441176470593.6041017956483524.8062948368035
Trimmed Mean ( 3 / 24 )88.95151515151523.4762083424625525.5886605140881
Trimmed Mean ( 4 / 24 )88.6531253.3993550747686226.0793953706158
Trimmed Mean ( 5 / 24 )88.47741935483873.357104449885326.3552774945271
Trimmed Mean ( 6 / 24 )88.36833333333333.3379113971601926.4741399093202
Trimmed Mean ( 7 / 24 )88.253.3134579108966726.6338074522631
Trimmed Mean ( 8 / 24 )88.16964285714293.2929528449765826.775252184873
Trimmed Mean ( 9 / 24 )88.07777777777783.2663721540393926.9650161169956
Trimmed Mean ( 10 / 24 )88.00576923076923.2418088137765727.1471188728882
Trimmed Mean ( 11 / 24 )87.933.2107501189800827.3861237223692
Trimmed Mean ( 12 / 24 )87.86253.1717427936846927.7016472378985
Trimmed Mean ( 13 / 24 )87.77826086956523.1256611482927328.0831020078778
Trimmed Mean ( 14 / 24 )87.71363636363643.0717676954707328.554775314868
Trimmed Mean ( 15 / 24 )87.6476190476193.0010784706783129.2053739693813
Trimmed Mean ( 16 / 24 )87.582.9066329979230930.1310829618254
Trimmed Mean ( 17 / 24 )87.50263157894742.7804859703008631.4702654548835
Trimmed Mean ( 18 / 24 )87.24444444444442.6806491882651732.546013415842
Trimmed Mean ( 19 / 24 )86.94705882352942.5717623166697233.8083571175897
Trimmed Mean ( 20 / 24 )86.7843752.4840666018769534.9364123065083
Trimmed Mean ( 21 / 24 )86.63333333333332.3791302058522336.4138680263195
Trimmed Mean ( 22 / 24 )86.54642857142862.3005203123387137.6203714034785
Trimmed Mean ( 23 / 24 )86.39230769230772.2034931923018839.2069773549235
Trimmed Mean ( 24 / 24 )86.53333333333332.17523667433539.7811118000701
Median90.65
Midrange113.9
Midmean - Weighted Average at Xnp86.572972972973
Midmean - Weighted Average at X(n+1)p87.2444444444445
Midmean - Empirical Distribution Function86.572972972973
Midmean - Empirical Distribution Function - Averaging87.2444444444445
Midmean - Empirical Distribution Function - Interpolation87.2444444444445
Midmean - Closest Observation86.572972972973
Midmean - True Basic - Statistics Graphics Toolkit87.2444444444445
Midmean - MS Excel (old versions)87.5026315789474
Number of observations72


Parameters (Session):
Parameters (R input):
R code (references can be found in the software module):
geomean <- function(x) {
return(exp(mean(log(x))))
}
harmean <- function(x) {
return(1/mean(1/x))
}
quamean <- function(x) {
return(sqrt(mean(x*x)))
}
winmean <- function(x) {
x <-sort(x[!is.na(x)])
n<-length(x)
denom <- 3
nodenom <- n/denom
if (nodenom>40) denom <- n/40
sqrtn = sqrt(n)
roundnodenom = floor(nodenom)
win <- array(NA,dim=c(roundnodenom,2))
for (j in 1:roundnodenom) {
win[j,1] <- (j*x[j+1]+sum(x[(j+1):(n-j)])+j*x[n-j])/n
win[j,2] <- sd(c(rep(x[j+1],j),x[(j+1):(n-j)],rep(x[n-j],j)))/sqrtn
}
return(win)
}
trimean <- function(x) {
x <-sort(x[!is.na(x)])
n<-length(x)
denom <- 3
nodenom <- n/denom
if (nodenom>40) denom <- n/40
sqrtn = sqrt(n)
roundnodenom = floor(nodenom)
tri <- array(NA,dim=c(roundnodenom,2))
for (j in 1:roundnodenom) {
tri[j,1] <- mean(x,trim=j/n)
tri[j,2] <- sd(x[(j+1):(n-j)]) / sqrt(n-j*2)
}
return(tri)
}
midrange <- function(x) {
return((max(x)+min(x))/2)
}
q1 <- function(data,n,p,i,f) {
np <- n*p;
i <<- floor(np)
f <<- np - i
qvalue <- (1-f)*data[i] + f*data[i+1]
}
q2 <- function(data,n,p,i,f) {
np <- (n+1)*p
i <<- floor(np)
f <<- np - i
qvalue <- (1-f)*data[i] + f*data[i+1]
}
q3 <- function(data,n,p,i,f) {
np <- n*p
i <<- floor(np)
f <<- np - i
if (f==0) {
qvalue <- data[i]
} else {
qvalue <- data[i+1]
}
}
q4 <- function(data,n,p,i,f) {
np <- n*p
i <<- floor(np)
f <<- np - i
if (f==0) {
qvalue <- (data[i]+data[i+1])/2
} else {
qvalue <- data[i+1]
}
}
q5 <- function(data,n,p,i,f) {
np <- (n-1)*p
i <<- floor(np)
f <<- np - i
if (f==0) {
qvalue <- data[i+1]
} else {
qvalue <- data[i+1] + f*(data[i+2]-data[i+1])
}
}
q6 <- function(data,n,p,i,f) {
np <- n*p+0.5
i <<- floor(np)
f <<- np - i
qvalue <- data[i]
}
q7 <- function(data,n,p,i,f) {
np <- (n+1)*p
i <<- floor(np)
f <<- np - i
if (f==0) {
qvalue <- data[i]
} else {
qvalue <- f*data[i] + (1-f)*data[i+1]
}
}
q8 <- function(data,n,p,i,f) {
np <- (n+1)*p
i <<- floor(np)
f <<- np - i
if (f==0) {
qvalue <- data[i]
} else {
if (f == 0.5) {
qvalue <- (data[i]+data[i+1])/2
} else {
if (f < 0.5) {
qvalue <- data[i]
} else {
qvalue <- data[i+1]
}
}
}
}
midmean <- function(x,def) {
x <-sort(x[!is.na(x)])
n<-length(x)
if (def==1) {
qvalue1 <- q1(x,n,0.25,i,f)
qvalue3 <- q1(x,n,0.75,i,f)
}
if (def==2) {
qvalue1 <- q2(x,n,0.25,i,f)
qvalue3 <- q2(x,n,0.75,i,f)
}
if (def==3) {
qvalue1 <- q3(x,n,0.25,i,f)
qvalue3 <- q3(x,n,0.75,i,f)
}
if (def==4) {
qvalue1 <- q4(x,n,0.25,i,f)
qvalue3 <- q4(x,n,0.75,i,f)
}
if (def==5) {
qvalue1 <- q5(x,n,0.25,i,f)
qvalue3 <- q5(x,n,0.75,i,f)
}
if (def==6) {
qvalue1 <- q6(x,n,0.25,i,f)
qvalue3 <- q6(x,n,0.75,i,f)
}
if (def==7) {
qvalue1 <- q7(x,n,0.25,i,f)
qvalue3 <- q7(x,n,0.75,i,f)
}
if (def==8) {
qvalue1 <- q8(x,n,0.25,i,f)
qvalue3 <- q8(x,n,0.75,i,f)
}
midm <- 0
myn <- 0
roundno4 <- round(n/4)
round3no4 <- round(3*n/4)
for (i in 1:n) {
if ((x[i]>=qvalue1) & (x[i]<=qvalue3)){
midm = midm + x[i]
myn = myn + 1
}
}
midm = midm / myn
return(midm)
}
(arm <- mean(x))
sqrtn <- sqrt(length(x))
(armse <- sd(x) / sqrtn)
(armose <- arm / armse)
(geo <- geomean(x))
(har <- harmean(x))
(qua <- quamean(x))
(win <- winmean(x))
(tri <- trimean(x))
(midr <- midrange(x))
midm <- array(NA,dim=8)
for (j in 1:8) midm[j] <- midmean(x,j)
midm
bitmap(file='test1.png')
lb <- win[,1] - 2*win[,2]
ub <- win[,1] + 2*win[,2]
if ((ylimmin == '') | (ylimmax == '')) plot(win[,1],type='b',main=main, xlab='j', pch=19, ylab='Winsorized Mean(j/n)', ylim=c(min(lb),max(ub))) else plot(win[,1],type='l',main=main, xlab='j', pch=19, ylab='Winsorized Mean(j/n)', ylim=c(ylimmin,ylimmax))
lines(ub,lty=3)
lines(lb,lty=3)
grid()
dev.off()
bitmap(file='test2.png')
lb <- tri[,1] - 2*tri[,2]
ub <- tri[,1] + 2*tri[,2]
if ((ylimmin == '') | (ylimmax == '')) plot(tri[,1],type='b',main=main, xlab='j', pch=19, ylab='Trimmed Mean(j/n)', ylim=c(min(lb),max(ub))) else plot(tri[,1],type='l',main=main, xlab='j', pch=19, ylab='Trimmed Mean(j/n)', ylim=c(ylimmin,ylimmax))
lines(ub,lty=3)
lines(lb,lty=3)
grid()
dev.off()
load(file='createtable')
a<-table.start()
a<-table.row.start(a)
a<-table.element(a,'Central Tendency - Ungrouped Data',4,TRUE)
a<-table.row.end(a)
a<-table.row.start(a)
a<-table.element(a,'Measure',header=TRUE)
a<-table.element(a,'Value',header=TRUE)
a<-table.element(a,'S.E.',header=TRUE)
a<-table.element(a,'Value/S.E.',header=TRUE)
a<-table.row.end(a)
a<-table.row.start(a)
a<-table.element(a,hyperlink('arithmetic_mean.htm', 'Arithmetic Mean', 'click to view the definition of the Arithmetic Mean'),header=TRUE)
a<-table.element(a,arm)
a<-table.element(a,hyperlink('arithmetic_mean_standard_error.htm', armse, 'click to view the definition of the Standard Error of the Arithmetic Mean'))
a<-table.element(a,armose)
a<-table.row.end(a)
a<-table.row.start(a)
a<-table.element(a,hyperlink('geometric_mean.htm', 'Geometric Mean', 'click to view the definition of the Geometric Mean'),header=TRUE)
a<-table.element(a,geo)
a<-table.element(a,'')
a<-table.row.end(a)
a<-table.row.start(a)
a<-table.element(a,hyperlink('harmonic_mean.htm', 'Harmonic Mean', 'click to view the definition of the Harmonic Mean'),header=TRUE)
a<-table.element(a,har)
a<-table.element(a,'')
a<-table.row.end(a)
a<-table.row.start(a)
a<-table.element(a,hyperlink('quadratic_mean.htm', 'Quadratic Mean', 'click to view the definition of the Quadratic Mean'),header=TRUE)
a<-table.element(a,qua)
a<-table.element(a,'')
a<-table.row.end(a)
for (j in 1:length(win[,1])) {
a<-table.row.start(a)
mylabel <- paste('Winsorized Mean (',j)
mylabel <- paste(mylabel,'/')
mylabel <- paste(mylabel,length(win[,1]))
mylabel <- paste(mylabel,')')
a<-table.element(a,hyperlink('winsorized_mean.htm', mylabel, 'click to view the definition of the Winsorized Mean'),header=TRUE)
a<-table.element(a,win[j,1])
a<-table.element(a,win[j,2])
a<-table.element(a,win[j,1]/win[j,2])
a<-table.row.end(a)
}
for (j in 1:length(tri[,1])) {
a<-table.row.start(a)
mylabel <- paste('Trimmed Mean (',j)
mylabel <- paste(mylabel,'/')
mylabel <- paste(mylabel,length(tri[,1]))
mylabel <- paste(mylabel,')')
a<-table.element(a,hyperlink('arithmetic_mean.htm', mylabel, 'click to view the definition of the Trimmed Mean'),header=TRUE)
a<-table.element(a,tri[j,1])
a<-table.element(a,tri[j,2])
a<-table.element(a,tri[j,1]/tri[j,2])
a<-table.row.end(a)
}
a<-table.row.start(a)
a<-table.element(a,hyperlink('median_1.htm', 'Median', 'click to view the definition of the Median'),header=TRUE)
a<-table.element(a,median(x))
a<-table.element(a,'')
a<-table.row.end(a)
a<-table.row.start(a)
a<-table.element(a,hyperlink('midrange.htm', 'Midrange', 'click to view the definition of the Midrange'),header=TRUE)
a<-table.element(a,midr)
a<-table.element(a,'')
a<-table.row.end(a)
a<-table.row.start(a)
mymid <- hyperlink('midmean.htm', 'Midmean', 'click to view the definition of the Midmean')
mylabel <- paste(mymid,hyperlink('method_1.htm','Weighted Average at Xnp',''),sep=' - ')
a<-table.element(a,mylabel,header=TRUE)
a<-table.element(a,midm[1])
a<-table.element(a,'')
a<-table.row.end(a)
a<-table.row.start(a)
mymid <- hyperlink('midmean.htm', 'Midmean', 'click to view the definition of the Midmean')
mylabel <- paste(mymid,hyperlink('method_2.htm','Weighted Average at X(n+1)p',''),sep=' - ')
a<-table.element(a,mylabel,header=TRUE)
a<-table.element(a,midm[2])
a<-table.element(a,'')
a<-table.row.end(a)
a<-table.row.start(a)
mymid <- hyperlink('midmean.htm', 'Midmean', 'click to view the definition of the Midmean')
mylabel <- paste(mymid,hyperlink('method_3.htm','Empirical Distribution Function',''),sep=' - ')
a<-table.element(a,mylabel,header=TRUE)
a<-table.element(a,midm[3])
a<-table.element(a,'')
a<-table.row.end(a)
a<-table.row.start(a)
mymid <- hyperlink('midmean.htm', 'Midmean', 'click to view the definition of the Midmean')
mylabel <- paste(mymid,hyperlink('method_4.htm','Empirical Distribution Function - Averaging',''),sep=' - ')
a<-table.element(a,mylabel,header=TRUE)
a<-table.element(a,midm[4])
a<-table.element(a,'')
a<-table.row.end(a)
a<-table.row.start(a)
mymid <- hyperlink('midmean.htm', 'Midmean', 'click to view the definition of the Midmean')
mylabel <- paste(mymid,hyperlink('method_5.htm','Empirical Distribution Function - Interpolation',''),sep=' - ')
a<-table.element(a,mylabel,header=TRUE)
a<-table.element(a,midm[5])
a<-table.element(a,'')
a<-table.row.end(a)
a<-table.row.start(a)
mymid <- hyperlink('midmean.htm', 'Midmean', 'click to view the definition of the Midmean')
mylabel <- paste(mymid,hyperlink('method_6.htm','Closest Observation',''),sep=' - ')
a<-table.element(a,mylabel,header=TRUE)
a<-table.element(a,midm[6])
a<-table.element(a,'')
a<-table.row.end(a)
a<-table.row.start(a)
mymid <- hyperlink('midmean.htm', 'Midmean', 'click to view the definition of the Midmean')
mylabel <- paste(mymid,hyperlink('method_7.htm','True Basic - Statistics Graphics Toolkit',''),sep=' - ')
a<-table.element(a,mylabel,header=TRUE)
a<-table.element(a,midm[7])
a<-table.element(a,'')
a<-table.row.end(a)
a<-table.row.start(a)
mymid <- hyperlink('midmean.htm', 'Midmean', 'click to view the definition of the Midmean')
mylabel <- paste(mymid,hyperlink('method_8.htm','MS Excel (old versions)',''),sep=' - ')
a<-table.element(a,mylabel,header=TRUE)
a<-table.element(a,midm[8])
a<-table.element(a,'')
a<-table.row.end(a)
a<-table.row.start(a)
a<-table.element(a,'Number of observations',header=TRUE)
a<-table.element(a,length(x))
a<-table.element(a,'')
a<-table.row.end(a)
a<-table.end(a)
table.save(a,file='mytable.tab')