Free Statistics
of Irreproducible Research!
Description of Statistical Computation | |||||||||||||||||||||||||||||||||||||||||||||||||||||||||||||||||||||||||||||||||||||||||||||||||||||||||||||||||||||||||||||||||||||||||||||||||||||||||||||||||||||||||||||||||||||||||||||||||||||||||||||||||||||||||||||||||||||||||||||||||||||||||||||||||||||||||||||||||||||||||||||||||||||||||||||||||||||||||||||||||||||||||||||||||||||||||||||||||||||||||||||||||||||||||||||||||||||
|---|---|---|---|---|---|---|---|---|---|---|---|---|---|---|---|---|---|---|---|---|---|---|---|---|---|---|---|---|---|---|---|---|---|---|---|---|---|---|---|---|---|---|---|---|---|---|---|---|---|---|---|---|---|---|---|---|---|---|---|---|---|---|---|---|---|---|---|---|---|---|---|---|---|---|---|---|---|---|---|---|---|---|---|---|---|---|---|---|---|---|---|---|---|---|---|---|---|---|---|---|---|---|---|---|---|---|---|---|---|---|---|---|---|---|---|---|---|---|---|---|---|---|---|---|---|---|---|---|---|---|---|---|---|---|---|---|---|---|---|---|---|---|---|---|---|---|---|---|---|---|---|---|---|---|---|---|---|---|---|---|---|---|---|---|---|---|---|---|---|---|---|---|---|---|---|---|---|---|---|---|---|---|---|---|---|---|---|---|---|---|---|---|---|---|---|---|---|---|---|---|---|---|---|---|---|---|---|---|---|---|---|---|---|---|---|---|---|---|---|---|---|---|---|---|---|---|---|---|---|---|---|---|---|---|---|---|---|---|---|---|---|---|---|---|---|---|---|---|---|---|---|---|---|---|---|---|---|---|---|---|---|---|---|---|---|---|---|---|---|---|---|---|---|---|---|---|---|---|---|---|---|---|---|---|---|---|---|---|---|---|---|---|---|---|---|---|---|---|---|---|---|---|---|---|---|---|---|---|---|---|---|---|---|---|---|---|---|---|---|---|---|---|---|---|---|---|---|---|---|---|---|---|---|---|---|---|---|---|---|---|---|---|---|---|---|---|---|---|---|---|---|---|---|---|---|---|---|---|---|---|---|---|---|---|---|---|---|---|---|---|---|---|---|---|---|---|---|---|---|---|---|---|---|---|---|---|---|---|---|
| Author's title | |||||||||||||||||||||||||||||||||||||||||||||||||||||||||||||||||||||||||||||||||||||||||||||||||||||||||||||||||||||||||||||||||||||||||||||||||||||||||||||||||||||||||||||||||||||||||||||||||||||||||||||||||||||||||||||||||||||||||||||||||||||||||||||||||||||||||||||||||||||||||||||||||||||||||||||||||||||||||||||||||||||||||||||||||||||||||||||||||||||||||||||||||||||||||||||||||||||
| Author | *The author of this computation has been verified* | ||||||||||||||||||||||||||||||||||||||||||||||||||||||||||||||||||||||||||||||||||||||||||||||||||||||||||||||||||||||||||||||||||||||||||||||||||||||||||||||||||||||||||||||||||||||||||||||||||||||||||||||||||||||||||||||||||||||||||||||||||||||||||||||||||||||||||||||||||||||||||||||||||||||||||||||||||||||||||||||||||||||||||||||||||||||||||||||||||||||||||||||||||||||||||||||||||||
| R Software Module | rwasp_pairs.wasp | ||||||||||||||||||||||||||||||||||||||||||||||||||||||||||||||||||||||||||||||||||||||||||||||||||||||||||||||||||||||||||||||||||||||||||||||||||||||||||||||||||||||||||||||||||||||||||||||||||||||||||||||||||||||||||||||||||||||||||||||||||||||||||||||||||||||||||||||||||||||||||||||||||||||||||||||||||||||||||||||||||||||||||||||||||||||||||||||||||||||||||||||||||||||||||||||||||||
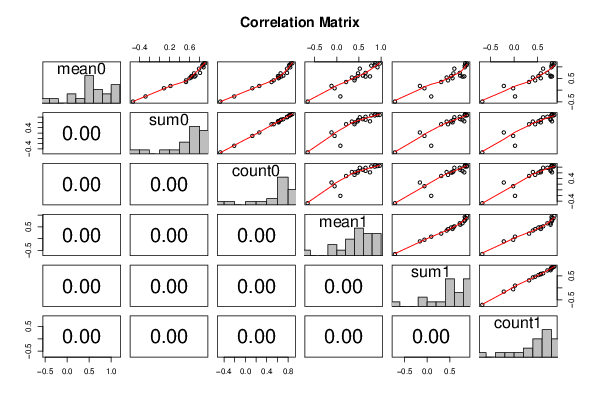
| Title produced by software | Kendall tau Correlation Matrix | ||||||||||||||||||||||||||||||||||||||||||||||||||||||||||||||||||||||||||||||||||||||||||||||||||||||||||||||||||||||||||||||||||||||||||||||||||||||||||||||||||||||||||||||||||||||||||||||||||||||||||||||||||||||||||||||||||||||||||||||||||||||||||||||||||||||||||||||||||||||||||||||||||||||||||||||||||||||||||||||||||||||||||||||||||||||||||||||||||||||||||||||||||||||||||||||||||||
| Date of computation | Wed, 10 Oct 2012 04:21:32 -0400 | ||||||||||||||||||||||||||||||||||||||||||||||||||||||||||||||||||||||||||||||||||||||||||||||||||||||||||||||||||||||||||||||||||||||||||||||||||||||||||||||||||||||||||||||||||||||||||||||||||||||||||||||||||||||||||||||||||||||||||||||||||||||||||||||||||||||||||||||||||||||||||||||||||||||||||||||||||||||||||||||||||||||||||||||||||||||||||||||||||||||||||||||||||||||||||||||||||||
| Cite this page as follows | Statistical Computations at FreeStatistics.org, Office for Research Development and Education, URL https://freestatistics.org/blog/index.php?v=date/2012/Oct/10/t13498573178e0dc4cdtl3989f.htm/, Retrieved Wed, 01 May 2024 12:34:11 +0000 | ||||||||||||||||||||||||||||||||||||||||||||||||||||||||||||||||||||||||||||||||||||||||||||||||||||||||||||||||||||||||||||||||||||||||||||||||||||||||||||||||||||||||||||||||||||||||||||||||||||||||||||||||||||||||||||||||||||||||||||||||||||||||||||||||||||||||||||||||||||||||||||||||||||||||||||||||||||||||||||||||||||||||||||||||||||||||||||||||||||||||||||||||||||||||||||||||||||
| Statistical Computations at FreeStatistics.org, Office for Research Development and Education, URL https://freestatistics.org/blog/index.php?pk=174802, Retrieved Wed, 01 May 2024 12:34:11 +0000 | |||||||||||||||||||||||||||||||||||||||||||||||||||||||||||||||||||||||||||||||||||||||||||||||||||||||||||||||||||||||||||||||||||||||||||||||||||||||||||||||||||||||||||||||||||||||||||||||||||||||||||||||||||||||||||||||||||||||||||||||||||||||||||||||||||||||||||||||||||||||||||||||||||||||||||||||||||||||||||||||||||||||||||||||||||||||||||||||||||||||||||||||||||||||||||||||||||||
| QR Codes: | |||||||||||||||||||||||||||||||||||||||||||||||||||||||||||||||||||||||||||||||||||||||||||||||||||||||||||||||||||||||||||||||||||||||||||||||||||||||||||||||||||||||||||||||||||||||||||||||||||||||||||||||||||||||||||||||||||||||||||||||||||||||||||||||||||||||||||||||||||||||||||||||||||||||||||||||||||||||||||||||||||||||||||||||||||||||||||||||||||||||||||||||||||||||||||||||||||||
|
| |||||||||||||||||||||||||||||||||||||||||||||||||||||||||||||||||||||||||||||||||||||||||||||||||||||||||||||||||||||||||||||||||||||||||||||||||||||||||||||||||||||||||||||||||||||||||||||||||||||||||||||||||||||||||||||||||||||||||||||||||||||||||||||||||||||||||||||||||||||||||||||||||||||||||||||||||||||||||||||||||||||||||||||||||||||||||||||||||||||||||||||||||||||||||||||||||||||
| Original text written by user: | |||||||||||||||||||||||||||||||||||||||||||||||||||||||||||||||||||||||||||||||||||||||||||||||||||||||||||||||||||||||||||||||||||||||||||||||||||||||||||||||||||||||||||||||||||||||||||||||||||||||||||||||||||||||||||||||||||||||||||||||||||||||||||||||||||||||||||||||||||||||||||||||||||||||||||||||||||||||||||||||||||||||||||||||||||||||||||||||||||||||||||||||||||||||||||||||||||||
| IsPrivate? | No (this computation is public) | ||||||||||||||||||||||||||||||||||||||||||||||||||||||||||||||||||||||||||||||||||||||||||||||||||||||||||||||||||||||||||||||||||||||||||||||||||||||||||||||||||||||||||||||||||||||||||||||||||||||||||||||||||||||||||||||||||||||||||||||||||||||||||||||||||||||||||||||||||||||||||||||||||||||||||||||||||||||||||||||||||||||||||||||||||||||||||||||||||||||||||||||||||||||||||||||||||||
| User-defined keywords | |||||||||||||||||||||||||||||||||||||||||||||||||||||||||||||||||||||||||||||||||||||||||||||||||||||||||||||||||||||||||||||||||||||||||||||||||||||||||||||||||||||||||||||||||||||||||||||||||||||||||||||||||||||||||||||||||||||||||||||||||||||||||||||||||||||||||||||||||||||||||||||||||||||||||||||||||||||||||||||||||||||||||||||||||||||||||||||||||||||||||||||||||||||||||||||||||||||
| Estimated Impact | 443 | ||||||||||||||||||||||||||||||||||||||||||||||||||||||||||||||||||||||||||||||||||||||||||||||||||||||||||||||||||||||||||||||||||||||||||||||||||||||||||||||||||||||||||||||||||||||||||||||||||||||||||||||||||||||||||||||||||||||||||||||||||||||||||||||||||||||||||||||||||||||||||||||||||||||||||||||||||||||||||||||||||||||||||||||||||||||||||||||||||||||||||||||||||||||||||||||||||||
Tree of Dependent Computations | |||||||||||||||||||||||||||||||||||||||||||||||||||||||||||||||||||||||||||||||||||||||||||||||||||||||||||||||||||||||||||||||||||||||||||||||||||||||||||||||||||||||||||||||||||||||||||||||||||||||||||||||||||||||||||||||||||||||||||||||||||||||||||||||||||||||||||||||||||||||||||||||||||||||||||||||||||||||||||||||||||||||||||||||||||||||||||||||||||||||||||||||||||||||||||||||||||||
| Family? (F = Feedback message, R = changed R code, M = changed R Module, P = changed Parameters, D = changed Data) | |||||||||||||||||||||||||||||||||||||||||||||||||||||||||||||||||||||||||||||||||||||||||||||||||||||||||||||||||||||||||||||||||||||||||||||||||||||||||||||||||||||||||||||||||||||||||||||||||||||||||||||||||||||||||||||||||||||||||||||||||||||||||||||||||||||||||||||||||||||||||||||||||||||||||||||||||||||||||||||||||||||||||||||||||||||||||||||||||||||||||||||||||||||||||||||||||||||
| - [Kendall tau Correlation Matrix] [] [2012-10-10 08:21:32] [d76b387543b13b5e3afd8ff9e5fdc89f] [Current] - R D [Kendall tau Correlation Matrix] [Correlation] [2012-12-19 23:51:31] [77d02b0cf2cecd023ffa9a06f056f18d] - R [Kendall tau Correlation Matrix] [WS2 - Task 5] [2013-10-16 23:13:19] [d0fa9a1df1102d3fce1a013ac6b36d98] - RM [Kendall tau Correlation Matrix] [Task 5 WS2] [2014-10-08 10:49:09] [fa1b8827d7de91b8b87087311d3d9fa1] - RM [Kendall tau Correlation Matrix] [WS2* Task 5] [2014-10-08 10:53:58] [fa1b8827d7de91b8b87087311d3d9fa1] - RM [Kendall tau Correlation Matrix] [] [2014-10-08 11:52:17] [fa1b8827d7de91b8b87087311d3d9fa1] - RM [Kendall tau Correlation Matrix] [] [2014-10-08 12:27:03] [bca3c6529212edfac3e771806c79a908] - RM [Kendall tau Correlation Matrix] [Task 5 - WS2] [2014-10-08 12:36:12] [40df8d8b5657a9599acc6ccced535535] - RM [Kendall tau Correlation Matrix] [Correlation matrix] [2014-10-08 12:40:52] [bca3c6529212edfac3e771806c79a908] - RM [Kendall tau Correlation Matrix] [Task 5.1] [2014-10-08 13:08:00] [0ec9eb5435be4d22ad2fec0894a217aa] - RM [Kendall tau Correlation Matrix] [Task 5.2] [2014-10-08 13:08:48] [0ec9eb5435be4d22ad2fec0894a217aa] - RM [Kendall tau Correlation Matrix] [WS2 task5d] [2014-10-08 13:48:19] [46c7ebd23dbdec306a09830d8b7528e7] - RM [Kendall tau Correlation Matrix] [Correlation Matrix] [2014-10-08 13:56:39] [b2fe7fef0850359c2a41ad606a8f04c2] - RM [Kendall tau Correlation Matrix] [ws2 task 5,4] [2014-10-08 14:04:56] [99723d3e379f668157309b7b2091b15d] - RM [Kendall tau Correlation Matrix] [Task 5] [2014-10-08 14:21:30] [6656361aa4da5489a6a45e803df0211c] - RM [Kendall tau Correlation Matrix] [Taak5] [2014-10-08 14:23:54] [36781f05c04c55e165b348994b753b95] - RM [Kendall tau Correlation Matrix] [WS2 SHW] [2014-10-08 14:30:11] [cac6c5fb035463be46c296b46e439cb5] - RMP [Kendall tau Correlation Matrix] [WS2 - Task 5.1] [2014-10-08 14:33:42] [4d39cf209776852399955073f9d0ee7a] - RM [Kendall tau Correlation Matrix] [] [2014-10-08 14:45:02] [d253a55552bf9917a397def3be261e30] - RMP [Kendall tau Correlation Matrix] [Task 5 WS2] [2014-10-08 14:56:02] [bcf5edf18529a33bd1494456d2c6cb9a] - RM [Kendall tau Correlation Matrix] [] [2014-10-08 16:58:51] [67894a4ff6098ffac356bc81e6028257] - RM [Kendall tau Correlation Matrix] [WS2 task 2b] [2014-10-08 17:00:53] [5efa6717cfe6505454df834acc87b53b] - M D [Kendall tau Correlation Matrix] [] [2014-12-11 10:06:42] [5efa6717cfe6505454df834acc87b53b] - RM D [Kendall tau Correlation Matrix] [] [2014-12-17 23:01:24] [5efa6717cfe6505454df834acc87b53b] - RM [Kendall tau Correlation Matrix] [] [2014-10-08 18:08:14] [fda96889f4ef6d31c0c28fd64d281011] - RM [Kendall tau Correlation Matrix] [] [2014-10-08 18:38:37] [bcf5edf18529a33bd1494456d2c6cb9a] - RM [Kendall tau Correlation Matrix] [Correlatie] [2014-10-09 10:51:03] [ae96d02647dd9ad9c105f1fa6642e295] - RM [Kendall tau Correlation Matrix] [Task 6 WS 2] [2014-10-09 10:52:08] [ae96d02647dd9ad9c105f1fa6642e295] - RM [Kendall tau Correlation Matrix] [] [2014-10-09 11:54:40] [765bd0d5d4a0c852014c120c6930661d] - RM [Kendall tau Correlation Matrix] [] [2014-10-09 11:56:58] [765bd0d5d4a0c852014c120c6930661d] - RM [Kendall tau Correlation Matrix] [task 5B] [2014-10-09 14:06:19] [dd7a37d66cc3f8699a204e53c0324369] - RM [Kendall tau Correlation Matrix] [WS2 - Task 5] [2014-10-09 14:13:30] [3cc57788b191749bdc089f5fad42e0f8] - RM [Kendall tau Correlation Matrix] [taak 5] [2014-10-09 14:29:34] [46c7ebd23dbdec306a09830d8b7528e7] - RMP [Kendall tau Correlation Matrix] [WS2 Task 5 tabel 2] [2014-10-09 14:58:53] [be945163e51ed825733188af308451be] - RM [Kendall tau Correlation Matrix] [] [2014-10-09 15:00:20] [044144d0728beecdb08e0d94daaff202] - RM [Kendall tau Correlation Matrix] [] [2014-10-09 15:02:18] [044144d0728beecdb08e0d94daaff202] - RM [Kendall tau Correlation Matrix] [] [2014-10-09 15:03:25] [044144d0728beecdb08e0d94daaff202] - RM [Kendall tau Correlation Matrix] [Task 5] [2014-10-09 15:06:25] [1651e47f7f65f3a10bbbb444d4b26be7] - RM [Kendall tau Correlation Matrix] [] [2014-10-09 15:56:20] [78252ca1523d3477f114bddbfa59edb4] - RMP [Kendall tau Correlation Matrix] [] [2014-10-09 16:56:56] [dacad244957cb51472792888970d4390] - RMP [Kendall tau Correlation Matrix] [dfh] [2014-10-09 16:57:27] [eee95947b6243a1febfcd5f41483d733] - RM [Kendall tau Correlation Matrix] [table] [2014-10-09 17:05:15] [3d5212c89039da1a3a24d8e18d23c716] - RM [Kendall tau Correlation Matrix] [] [2014-10-09 17:07:49] [cc401d1001c65f55a3dfc6f2420e9570] - RM [Kendall tau Correlation Matrix] [correlation matrix ] [2014-10-09 17:07:50] [3d5212c89039da1a3a24d8e18d23c716] - R [Kendall tau Correlation Matrix] [WSH2 Task 5 b] [2014-10-09 19:48:18] [4e6b221caf797a012ce5465db674848b] - RM [Kendall tau Correlation Matrix] [task 5 2] [2014-10-09 17:35:22] [673773038936aef3a5778d7e6bda5c1e] - RM [Kendall tau Correlation Matrix] [task 5 3] [2014-10-09 17:36:12] [673773038936aef3a5778d7e6bda5c1e] - RM [Kendall tau Correlation Matrix] [] [2014-10-09 17:37:49] [784816b0c716a476fc48ddde921cf7ea] - RM [Kendall tau Correlation Matrix] [] [2014-10-09 17:38:25] [784816b0c716a476fc48ddde921cf7ea] [Truncated] | |||||||||||||||||||||||||||||||||||||||||||||||||||||||||||||||||||||||||||||||||||||||||||||||||||||||||||||||||||||||||||||||||||||||||||||||||||||||||||||||||||||||||||||||||||||||||||||||||||||||||||||||||||||||||||||||||||||||||||||||||||||||||||||||||||||||||||||||||||||||||||||||||||||||||||||||||||||||||||||||||||||||||||||||||||||||||||||||||||||||||||||||||||||||||||||||||||||
| Feedback Forum | |||||||||||||||||||||||||||||||||||||||||||||||||||||||||||||||||||||||||||||||||||||||||||||||||||||||||||||||||||||||||||||||||||||||||||||||||||||||||||||||||||||||||||||||||||||||||||||||||||||||||||||||||||||||||||||||||||||||||||||||||||||||||||||||||||||||||||||||||||||||||||||||||||||||||||||||||||||||||||||||||||||||||||||||||||||||||||||||||||||||||||||||||||||||||||||||||||||
Post a new message | |||||||||||||||||||||||||||||||||||||||||||||||||||||||||||||||||||||||||||||||||||||||||||||||||||||||||||||||||||||||||||||||||||||||||||||||||||||||||||||||||||||||||||||||||||||||||||||||||||||||||||||||||||||||||||||||||||||||||||||||||||||||||||||||||||||||||||||||||||||||||||||||||||||||||||||||||||||||||||||||||||||||||||||||||||||||||||||||||||||||||||||||||||||||||||||||||||||
Dataset | |||||||||||||||||||||||||||||||||||||||||||||||||||||||||||||||||||||||||||||||||||||||||||||||||||||||||||||||||||||||||||||||||||||||||||||||||||||||||||||||||||||||||||||||||||||||||||||||||||||||||||||||||||||||||||||||||||||||||||||||||||||||||||||||||||||||||||||||||||||||||||||||||||||||||||||||||||||||||||||||||||||||||||||||||||||||||||||||||||||||||||||||||||||||||||||||||||||
| Dataseries X: | |||||||||||||||||||||||||||||||||||||||||||||||||||||||||||||||||||||||||||||||||||||||||||||||||||||||||||||||||||||||||||||||||||||||||||||||||||||||||||||||||||||||||||||||||||||||||||||||||||||||||||||||||||||||||||||||||||||||||||||||||||||||||||||||||||||||||||||||||||||||||||||||||||||||||||||||||||||||||||||||||||||||||||||||||||||||||||||||||||||||||||||||||||||||||||||||||||||
1.14 0.88 0.85 0.97 0.88 0.86 -0.27 -0.28 -0.21 0.08 0.09 0.02 1.07 0.86 0.82 0.86 0.87 0.84 0.18 0.22 0.26 -0.12 -0.16 -0.22 0.92 0.79 0.78 0.52 0.6 0.62 1.15 0.91 0.88 0.87 0.84 0.81 0.59 0.64 0.62 0.75 0.82 0.81 1.05 0.86 0.83 0.78 0.83 0.8 -0.49 -0.53 -0.47 -0.66 -0.71 -0.68 0.98 0.88 0.84 0.92 0.83 0.8 0.74 0.81 0.78 0.65 0.72 0.71 0.51 0.6 0.62 0.41 0.56 0.57 0.6 0.64 0.61 0.47 0.53 0.52 0.42 0.53 0.53 0.4 0.46 0.45 0.72 0.69 0.66 0.48 0.58 0.57 0.35 0.53 0.49 0.21 0.31 0.32 0.58 0.7 0.67 0.65 0.78 0.78 0.62 0.72 0.71 0.59 0.73 0.78 0.54 0.63 0.63 0.34 0.43 0.4 0.08 0.09 0.13 -0.05 -0.06 -0.02 | |||||||||||||||||||||||||||||||||||||||||||||||||||||||||||||||||||||||||||||||||||||||||||||||||||||||||||||||||||||||||||||||||||||||||||||||||||||||||||||||||||||||||||||||||||||||||||||||||||||||||||||||||||||||||||||||||||||||||||||||||||||||||||||||||||||||||||||||||||||||||||||||||||||||||||||||||||||||||||||||||||||||||||||||||||||||||||||||||||||||||||||||||||||||||||||||||||||
Tables (Output of Computation) | |||||||||||||||||||||||||||||||||||||||||||||||||||||||||||||||||||||||||||||||||||||||||||||||||||||||||||||||||||||||||||||||||||||||||||||||||||||||||||||||||||||||||||||||||||||||||||||||||||||||||||||||||||||||||||||||||||||||||||||||||||||||||||||||||||||||||||||||||||||||||||||||||||||||||||||||||||||||||||||||||||||||||||||||||||||||||||||||||||||||||||||||||||||||||||||||||||||
| |||||||||||||||||||||||||||||||||||||||||||||||||||||||||||||||||||||||||||||||||||||||||||||||||||||||||||||||||||||||||||||||||||||||||||||||||||||||||||||||||||||||||||||||||||||||||||||||||||||||||||||||||||||||||||||||||||||||||||||||||||||||||||||||||||||||||||||||||||||||||||||||||||||||||||||||||||||||||||||||||||||||||||||||||||||||||||||||||||||||||||||||||||||||||||||||||||||
Figures (Output of Computation) | |||||||||||||||||||||||||||||||||||||||||||||||||||||||||||||||||||||||||||||||||||||||||||||||||||||||||||||||||||||||||||||||||||||||||||||||||||||||||||||||||||||||||||||||||||||||||||||||||||||||||||||||||||||||||||||||||||||||||||||||||||||||||||||||||||||||||||||||||||||||||||||||||||||||||||||||||||||||||||||||||||||||||||||||||||||||||||||||||||||||||||||||||||||||||||||||||||||
Input Parameters & R Code | |||||||||||||||||||||||||||||||||||||||||||||||||||||||||||||||||||||||||||||||||||||||||||||||||||||||||||||||||||||||||||||||||||||||||||||||||||||||||||||||||||||||||||||||||||||||||||||||||||||||||||||||||||||||||||||||||||||||||||||||||||||||||||||||||||||||||||||||||||||||||||||||||||||||||||||||||||||||||||||||||||||||||||||||||||||||||||||||||||||||||||||||||||||||||||||||||||||
| Parameters (Session): | |||||||||||||||||||||||||||||||||||||||||||||||||||||||||||||||||||||||||||||||||||||||||||||||||||||||||||||||||||||||||||||||||||||||||||||||||||||||||||||||||||||||||||||||||||||||||||||||||||||||||||||||||||||||||||||||||||||||||||||||||||||||||||||||||||||||||||||||||||||||||||||||||||||||||||||||||||||||||||||||||||||||||||||||||||||||||||||||||||||||||||||||||||||||||||||||||||||
| par1 = pearson ; | |||||||||||||||||||||||||||||||||||||||||||||||||||||||||||||||||||||||||||||||||||||||||||||||||||||||||||||||||||||||||||||||||||||||||||||||||||||||||||||||||||||||||||||||||||||||||||||||||||||||||||||||||||||||||||||||||||||||||||||||||||||||||||||||||||||||||||||||||||||||||||||||||||||||||||||||||||||||||||||||||||||||||||||||||||||||||||||||||||||||||||||||||||||||||||||||||||||
| Parameters (R input): | |||||||||||||||||||||||||||||||||||||||||||||||||||||||||||||||||||||||||||||||||||||||||||||||||||||||||||||||||||||||||||||||||||||||||||||||||||||||||||||||||||||||||||||||||||||||||||||||||||||||||||||||||||||||||||||||||||||||||||||||||||||||||||||||||||||||||||||||||||||||||||||||||||||||||||||||||||||||||||||||||||||||||||||||||||||||||||||||||||||||||||||||||||||||||||||||||||||
| par1 = pearson ; | |||||||||||||||||||||||||||||||||||||||||||||||||||||||||||||||||||||||||||||||||||||||||||||||||||||||||||||||||||||||||||||||||||||||||||||||||||||||||||||||||||||||||||||||||||||||||||||||||||||||||||||||||||||||||||||||||||||||||||||||||||||||||||||||||||||||||||||||||||||||||||||||||||||||||||||||||||||||||||||||||||||||||||||||||||||||||||||||||||||||||||||||||||||||||||||||||||||
| R code (references can be found in the software module): | |||||||||||||||||||||||||||||||||||||||||||||||||||||||||||||||||||||||||||||||||||||||||||||||||||||||||||||||||||||||||||||||||||||||||||||||||||||||||||||||||||||||||||||||||||||||||||||||||||||||||||||||||||||||||||||||||||||||||||||||||||||||||||||||||||||||||||||||||||||||||||||||||||||||||||||||||||||||||||||||||||||||||||||||||||||||||||||||||||||||||||||||||||||||||||||||||||||
panel.tau <- function(x, y, digits=2, prefix='', cex.cor) | |||||||||||||||||||||||||||||||||||||||||||||||||||||||||||||||||||||||||||||||||||||||||||||||||||||||||||||||||||||||||||||||||||||||||||||||||||||||||||||||||||||||||||||||||||||||||||||||||||||||||||||||||||||||||||||||||||||||||||||||||||||||||||||||||||||||||||||||||||||||||||||||||||||||||||||||||||||||||||||||||||||||||||||||||||||||||||||||||||||||||||||||||||||||||||||||||||||