Free Statistics

of Irreproducible Research!

Author's title

Author*Unverified author*
R Software Modulerwasp_centraltendency.wasp
Title produced by softwareCentral Tendency
Date of computationThu, 18 Oct 2012 08:04:03 -0400
Cite this page as followsStatistical Computations at FreeStatistics.org, Office for Research Development and Education, URL https://freestatistics.org/blog/index.php?v=date/2012/Oct/18/t1350562185tk3295rs87z6pfc.htm/, Retrieved Sun, 28 Apr 2024 23:36:44 +0000
Statistical Computations at FreeStatistics.org, Office for Research Development and Education, URL https://freestatistics.org/blog/index.php?pk=179495, Retrieved Sun, 28 Apr 2024 23:36:44 +0000
QR Codes:

Original text written by user:
IsPrivate?No (this computation is public)
User-defined keywords
Estimated Impact69
Family? (F = Feedback message, R = changed R code, M = changed R Module, P = changed Parameters, D = changed Data)
-       [Central Tendency] [] [2012-10-18 12:04:03] [c881bea568ce57c3f1ac16d86b52731a] [Current]
Feedback Forum

Post a new message
Dataseries X:
1855,87
1868,53
1865,71
1872,59
1875,95
1875,95
1875,95
1878,08
1878,26
1876,39
1876,77
1876,88
1876,88
1876,68
1865,52
1858,99
1856,87
1858,22
1858,22
1859,32
1859,52
1852,48
1850,07
1850,07
1850,07
1841,55
1845
1844,01
1842,67
1842,67
1842,67
1842,9
1840,37
1841,59
1844,33
1844,33
1844,33
1845,39
1861,84
1862,85
1869,46
1870,8
1870,8
1871,52
1875,52
1880,38
1885,05
1886,42
1886,42
1891,65
1903,11
1905,29
1904,26
1905,37
1905,37
1905,12
1908,62
1915,08
1916,36
1916,68
1916,24
1922,05
1922,63
1922,47
1920,64
1920,66
1920,66
1921,19
1921,44
1921,73
1921,81
1921,81


Summary of computational transaction
Raw Inputview raw input (R code)
Raw Outputview raw output of R engine
Computing time2 seconds
R Server'George Udny Yule' @ yule.wessa.net

\begin{tabular}{lllllllll}
\hline
Summary of computational transaction \tabularnewline
Raw Input & view raw input (R code)  \tabularnewline
Raw Output & view raw output of R engine  \tabularnewline
Computing time & 2 seconds \tabularnewline
R Server & 'George Udny Yule' @ yule.wessa.net \tabularnewline
\hline
\end{tabular}
%Source: https://freestatistics.org/blog/index.php?pk=179495&T=0

[TABLE]
[ROW][C]Summary of computational transaction[/C][/ROW]
[ROW][C]Raw Input[/C][C]view raw input (R code) [/C][/ROW]
[ROW][C]Raw Output[/C][C]view raw output of R engine [/C][/ROW]
[ROW][C]Computing time[/C][C]2 seconds[/C][/ROW]
[ROW][C]R Server[/C][C]'George Udny Yule' @ yule.wessa.net[/C][/ROW]
[/TABLE]
Source: https://freestatistics.org/blog/index.php?pk=179495&T=0

Globally Unique Identifier (entire table): ba.freestatistics.org/blog/index.php?pk=179495&T=0

As an alternative you can also use a QR Code:  

The GUIDs for individual cells are displayed in the table below:

Summary of computational transaction
Raw Inputview raw input (R code)
Raw Outputview raw output of R engine
Computing time2 seconds
R Server'George Udny Yule' @ yule.wessa.net


Central Tendency - Ungrouped Data
MeasureValueS.E.Value/S.E.
Arithmetic Mean1878.652083333333.27844863724267573.0308115833
Geometric Mean1878.44956792005
Harmonic Mean1878.24765755147
Quadratic Mean1878.85517648935
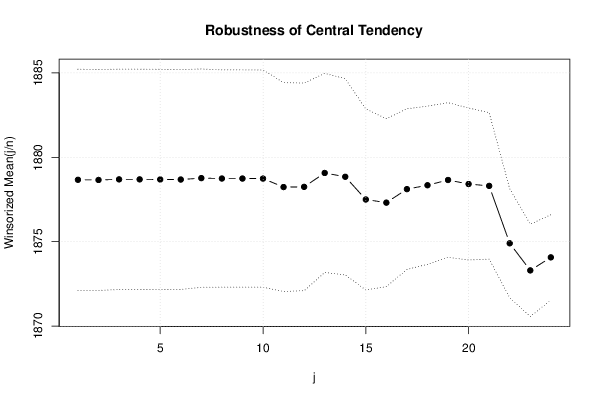
Winsorized Mean ( 1 / 24 )1878.666253.2753738478848573.573075089802
Winsorized Mean ( 2 / 24 )1878.655694444443.27300849641746573.984362246774
Winsorized Mean ( 3 / 24 )1878.690694444443.26405840064427575.568958592659
Winsorized Mean ( 4 / 24 )1878.690694444443.26405840064427575.568958592659
Winsorized Mean ( 5 / 24 )1878.685138888893.26302545695688575.749458185645
Winsorized Mean ( 6 / 24 )1878.680138888893.25557183083674577.066099753675
Winsorized Mean ( 7 / 24 )1878.763753.23455991349952580.840608998749
Winsorized Mean ( 8 / 24 )1878.740416666673.21835104186868583.758698857104
Winsorized Mean ( 9 / 24 )1878.740416666673.21835104186868583.758698857104
Winsorized Mean ( 10 / 24 )1878.737638888893.21784151410545583.850270640557
Winsorized Mean ( 11 / 24 )1878.2353.09391874114994607.073151281893
Winsorized Mean ( 12 / 24 )1878.246666666673.07478749090746610.854139422931
Winsorized Mean ( 13 / 24 )1879.072.94875615669972637.241569036036
Winsorized Mean ( 14 / 24 )1878.844444444442.90894572893151645.885011108325
Winsorized Mean ( 15 / 24 )1877.498611111112.6805200041023700.423279153956
Winsorized Mean ( 16 / 24 )1877.311944444442.48777057051833754.616187960333
Winsorized Mean ( 17 / 24 )1878.112361111112.37872054756129789.547289628699
Winsorized Mean ( 18 / 24 )1878.342361111112.3428865258077801.721440804122
Winsorized Mean ( 19 / 24 )1878.653752.2902182314428820.294644504894
Winsorized Mean ( 20 / 24 )1878.414861111112.25146418185358834.308125463783
Winsorized Mean ( 21 / 24 )1878.304027777782.16906286475444865.95186257565
Winsorized Mean ( 22 / 24 )1874.903194444441.614286627456981161.44379972844
Winsorized Mean ( 23 / 24 )1873.296388888891.369899364408011367.47007667853
Winsorized Mean ( 24 / 24 )1874.069722222221.262285711717271484.66365801816
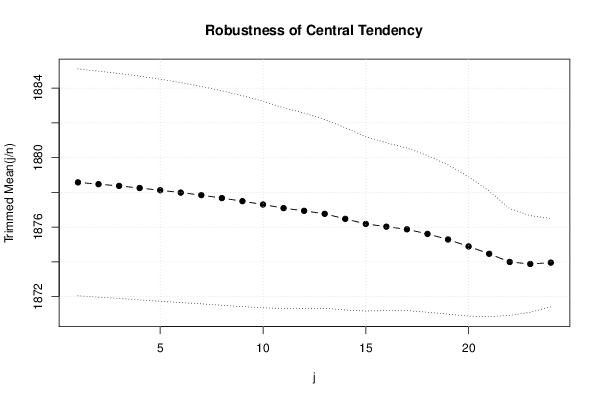
Trimmed Mean ( 1 / 24 )1878.570714285713.26677515129004575.053570351749
Trimmed Mean ( 2 / 24 )1878.469558823533.25417654535143577.248816296372
Trimmed Mean ( 3 / 24 )1878.368030303033.23826468838797580.053890294586
Trimmed Mean ( 4 / 24 )1878.247031253.22071611380121583.176835487441
Trimmed Mean ( 5 / 24 )1878.118225806453.19718194202274587.429261100554
Trimmed Mean ( 6 / 24 )1877.982166666673.16673320856343593.034538428515
Trimmed Mean ( 7 / 24 )1877.837758620693.12955168858299600.034108869742
Trimmed Mean ( 8 / 24 )1877.667678571433.08714973817496608.22047448902
Trimmed Mean ( 9 / 24 )1877.488888888893.03672221442689618.26165066047
Trimmed Mean ( 10 / 24 )1877.296346153852.9721729032614631.624204666514
Trimmed Mean ( 11 / 24 )1877.08882.88978939476953649.559031325085
Trimmed Mean ( 12 / 24 )1876.93252.81376239596061667.054369158709
Trimmed Mean ( 13 / 24 )1876.761086956522.71963048478006690.079441843108
Trimmed Mean ( 14 / 24 )1876.470454545452.62487410257934714.880173758252
Trimmed Mean ( 15 / 24 )1876.179761904762.50951521358449747.626374906453
Trimmed Mean ( 16 / 24 )1876.02152.41648867293233776.341938207188
Trimmed Mean ( 17 / 24 )1875.868684210532.3391447833261801.946376975937
Trimmed Mean ( 18 / 24 )1875.604722222222.2573133168645830.901367661052
Trimmed Mean ( 19 / 24 )1875.282647058822.14960748847644872.383752434706
Trimmed Mean ( 20 / 24 )1874.88343752.00755883140882933.912076780477
Trimmed Mean ( 21 / 24 )1874.459666666671.810572430173461035.28565630875
Trimmed Mean ( 22 / 24 )1873.988928571431.536871895127661219.35272192336
Trimmed Mean ( 23 / 24 )1873.873846153851.391301557416171346.84952817409
Trimmed Mean ( 24 / 24 )1873.949166666671.273078961522241471.98188274666
Median1875.95
Midrange1881.5
Midmean - Weighted Average at Xnp1875.07135135135
Midmean - Weighted Average at X(n+1)p1875.60472222222
Midmean - Empirical Distribution Function1875.07135135135
Midmean - Empirical Distribution Function - Averaging1875.60472222222
Midmean - Empirical Distribution Function - Interpolation1875.60472222222
Midmean - Closest Observation1875.07135135135
Midmean - True Basic - Statistics Graphics Toolkit1875.60472222222
Midmean - MS Excel (old versions)1876.62512820513
Number of observations72

\begin{tabular}{lllllllll}
\hline
Central Tendency - Ungrouped Data \tabularnewline
Measure & Value & S.E. & Value/S.E. \tabularnewline
Arithmetic Mean & 1878.65208333333 & 3.27844863724267 & 573.0308115833 \tabularnewline
Geometric Mean & 1878.44956792005 &  &  \tabularnewline
Harmonic Mean & 1878.24765755147 &  &  \tabularnewline
Quadratic Mean & 1878.85517648935 &  &  \tabularnewline
Winsorized Mean ( 1 / 24 ) & 1878.66625 & 3.2753738478848 & 573.573075089802 \tabularnewline
Winsorized Mean ( 2 / 24 ) & 1878.65569444444 & 3.27300849641746 & 573.984362246774 \tabularnewline
Winsorized Mean ( 3 / 24 ) & 1878.69069444444 & 3.26405840064427 & 575.568958592659 \tabularnewline
Winsorized Mean ( 4 / 24 ) & 1878.69069444444 & 3.26405840064427 & 575.568958592659 \tabularnewline
Winsorized Mean ( 5 / 24 ) & 1878.68513888889 & 3.26302545695688 & 575.749458185645 \tabularnewline
Winsorized Mean ( 6 / 24 ) & 1878.68013888889 & 3.25557183083674 & 577.066099753675 \tabularnewline
Winsorized Mean ( 7 / 24 ) & 1878.76375 & 3.23455991349952 & 580.840608998749 \tabularnewline
Winsorized Mean ( 8 / 24 ) & 1878.74041666667 & 3.21835104186868 & 583.758698857104 \tabularnewline
Winsorized Mean ( 9 / 24 ) & 1878.74041666667 & 3.21835104186868 & 583.758698857104 \tabularnewline
Winsorized Mean ( 10 / 24 ) & 1878.73763888889 & 3.21784151410545 & 583.850270640557 \tabularnewline
Winsorized Mean ( 11 / 24 ) & 1878.235 & 3.09391874114994 & 607.073151281893 \tabularnewline
Winsorized Mean ( 12 / 24 ) & 1878.24666666667 & 3.07478749090746 & 610.854139422931 \tabularnewline
Winsorized Mean ( 13 / 24 ) & 1879.07 & 2.94875615669972 & 637.241569036036 \tabularnewline
Winsorized Mean ( 14 / 24 ) & 1878.84444444444 & 2.90894572893151 & 645.885011108325 \tabularnewline
Winsorized Mean ( 15 / 24 ) & 1877.49861111111 & 2.6805200041023 & 700.423279153956 \tabularnewline
Winsorized Mean ( 16 / 24 ) & 1877.31194444444 & 2.48777057051833 & 754.616187960333 \tabularnewline
Winsorized Mean ( 17 / 24 ) & 1878.11236111111 & 2.37872054756129 & 789.547289628699 \tabularnewline
Winsorized Mean ( 18 / 24 ) & 1878.34236111111 & 2.3428865258077 & 801.721440804122 \tabularnewline
Winsorized Mean ( 19 / 24 ) & 1878.65375 & 2.2902182314428 & 820.294644504894 \tabularnewline
Winsorized Mean ( 20 / 24 ) & 1878.41486111111 & 2.25146418185358 & 834.308125463783 \tabularnewline
Winsorized Mean ( 21 / 24 ) & 1878.30402777778 & 2.16906286475444 & 865.95186257565 \tabularnewline
Winsorized Mean ( 22 / 24 ) & 1874.90319444444 & 1.61428662745698 & 1161.44379972844 \tabularnewline
Winsorized Mean ( 23 / 24 ) & 1873.29638888889 & 1.36989936440801 & 1367.47007667853 \tabularnewline
Winsorized Mean ( 24 / 24 ) & 1874.06972222222 & 1.26228571171727 & 1484.66365801816 \tabularnewline
Trimmed Mean ( 1 / 24 ) & 1878.57071428571 & 3.26677515129004 & 575.053570351749 \tabularnewline
Trimmed Mean ( 2 / 24 ) & 1878.46955882353 & 3.25417654535143 & 577.248816296372 \tabularnewline
Trimmed Mean ( 3 / 24 ) & 1878.36803030303 & 3.23826468838797 & 580.053890294586 \tabularnewline
Trimmed Mean ( 4 / 24 ) & 1878.24703125 & 3.22071611380121 & 583.176835487441 \tabularnewline
Trimmed Mean ( 5 / 24 ) & 1878.11822580645 & 3.19718194202274 & 587.429261100554 \tabularnewline
Trimmed Mean ( 6 / 24 ) & 1877.98216666667 & 3.16673320856343 & 593.034538428515 \tabularnewline
Trimmed Mean ( 7 / 24 ) & 1877.83775862069 & 3.12955168858299 & 600.034108869742 \tabularnewline
Trimmed Mean ( 8 / 24 ) & 1877.66767857143 & 3.08714973817496 & 608.22047448902 \tabularnewline
Trimmed Mean ( 9 / 24 ) & 1877.48888888889 & 3.03672221442689 & 618.26165066047 \tabularnewline
Trimmed Mean ( 10 / 24 ) & 1877.29634615385 & 2.9721729032614 & 631.624204666514 \tabularnewline
Trimmed Mean ( 11 / 24 ) & 1877.0888 & 2.88978939476953 & 649.559031325085 \tabularnewline
Trimmed Mean ( 12 / 24 ) & 1876.9325 & 2.81376239596061 & 667.054369158709 \tabularnewline
Trimmed Mean ( 13 / 24 ) & 1876.76108695652 & 2.71963048478006 & 690.079441843108 \tabularnewline
Trimmed Mean ( 14 / 24 ) & 1876.47045454545 & 2.62487410257934 & 714.880173758252 \tabularnewline
Trimmed Mean ( 15 / 24 ) & 1876.17976190476 & 2.50951521358449 & 747.626374906453 \tabularnewline
Trimmed Mean ( 16 / 24 ) & 1876.0215 & 2.41648867293233 & 776.341938207188 \tabularnewline
Trimmed Mean ( 17 / 24 ) & 1875.86868421053 & 2.3391447833261 & 801.946376975937 \tabularnewline
Trimmed Mean ( 18 / 24 ) & 1875.60472222222 & 2.2573133168645 & 830.901367661052 \tabularnewline
Trimmed Mean ( 19 / 24 ) & 1875.28264705882 & 2.14960748847644 & 872.383752434706 \tabularnewline
Trimmed Mean ( 20 / 24 ) & 1874.8834375 & 2.00755883140882 & 933.912076780477 \tabularnewline
Trimmed Mean ( 21 / 24 ) & 1874.45966666667 & 1.81057243017346 & 1035.28565630875 \tabularnewline
Trimmed Mean ( 22 / 24 ) & 1873.98892857143 & 1.53687189512766 & 1219.35272192336 \tabularnewline
Trimmed Mean ( 23 / 24 ) & 1873.87384615385 & 1.39130155741617 & 1346.84952817409 \tabularnewline
Trimmed Mean ( 24 / 24 ) & 1873.94916666667 & 1.27307896152224 & 1471.98188274666 \tabularnewline
Median & 1875.95 &  &  \tabularnewline
Midrange & 1881.5 &  &  \tabularnewline
Midmean - Weighted Average at Xnp & 1875.07135135135 &  &  \tabularnewline
Midmean - Weighted Average at X(n+1)p & 1875.60472222222 &  &  \tabularnewline
Midmean - Empirical Distribution Function & 1875.07135135135 &  &  \tabularnewline
Midmean - Empirical Distribution Function - Averaging & 1875.60472222222 &  &  \tabularnewline
Midmean - Empirical Distribution Function - Interpolation & 1875.60472222222 &  &  \tabularnewline
Midmean - Closest Observation & 1875.07135135135 &  &  \tabularnewline
Midmean - True Basic - Statistics Graphics Toolkit & 1875.60472222222 &  &  \tabularnewline
Midmean - MS Excel (old versions) & 1876.62512820513 &  &  \tabularnewline
Number of observations & 72 &  &  \tabularnewline
\hline
\end{tabular}
%Source: https://freestatistics.org/blog/index.php?pk=179495&T=1

[TABLE]
[ROW][C]Central Tendency - Ungrouped Data[/C][/ROW]
[ROW][C]Measure[/C][C]Value[/C][C]S.E.[/C][C]Value/S.E.[/C][/ROW]
[ROW][C]Arithmetic Mean[/C][C]1878.65208333333[/C][C]3.27844863724267[/C][C]573.0308115833[/C][/ROW]
[ROW][C]Geometric Mean[/C][C]1878.44956792005[/C][C][/C][C][/C][/ROW]
[ROW][C]Harmonic Mean[/C][C]1878.24765755147[/C][C][/C][C][/C][/ROW]
[ROW][C]Quadratic Mean[/C][C]1878.85517648935[/C][C][/C][C][/C][/ROW]
[ROW][C]Winsorized Mean ( 1 / 24 )[/C][C]1878.66625[/C][C]3.2753738478848[/C][C]573.573075089802[/C][/ROW]
[ROW][C]Winsorized Mean ( 2 / 24 )[/C][C]1878.65569444444[/C][C]3.27300849641746[/C][C]573.984362246774[/C][/ROW]
[ROW][C]Winsorized Mean ( 3 / 24 )[/C][C]1878.69069444444[/C][C]3.26405840064427[/C][C]575.568958592659[/C][/ROW]
[ROW][C]Winsorized Mean ( 4 / 24 )[/C][C]1878.69069444444[/C][C]3.26405840064427[/C][C]575.568958592659[/C][/ROW]
[ROW][C]Winsorized Mean ( 5 / 24 )[/C][C]1878.68513888889[/C][C]3.26302545695688[/C][C]575.749458185645[/C][/ROW]
[ROW][C]Winsorized Mean ( 6 / 24 )[/C][C]1878.68013888889[/C][C]3.25557183083674[/C][C]577.066099753675[/C][/ROW]
[ROW][C]Winsorized Mean ( 7 / 24 )[/C][C]1878.76375[/C][C]3.23455991349952[/C][C]580.840608998749[/C][/ROW]
[ROW][C]Winsorized Mean ( 8 / 24 )[/C][C]1878.74041666667[/C][C]3.21835104186868[/C][C]583.758698857104[/C][/ROW]
[ROW][C]Winsorized Mean ( 9 / 24 )[/C][C]1878.74041666667[/C][C]3.21835104186868[/C][C]583.758698857104[/C][/ROW]
[ROW][C]Winsorized Mean ( 10 / 24 )[/C][C]1878.73763888889[/C][C]3.21784151410545[/C][C]583.850270640557[/C][/ROW]
[ROW][C]Winsorized Mean ( 11 / 24 )[/C][C]1878.235[/C][C]3.09391874114994[/C][C]607.073151281893[/C][/ROW]
[ROW][C]Winsorized Mean ( 12 / 24 )[/C][C]1878.24666666667[/C][C]3.07478749090746[/C][C]610.854139422931[/C][/ROW]
[ROW][C]Winsorized Mean ( 13 / 24 )[/C][C]1879.07[/C][C]2.94875615669972[/C][C]637.241569036036[/C][/ROW]
[ROW][C]Winsorized Mean ( 14 / 24 )[/C][C]1878.84444444444[/C][C]2.90894572893151[/C][C]645.885011108325[/C][/ROW]
[ROW][C]Winsorized Mean ( 15 / 24 )[/C][C]1877.49861111111[/C][C]2.6805200041023[/C][C]700.423279153956[/C][/ROW]
[ROW][C]Winsorized Mean ( 16 / 24 )[/C][C]1877.31194444444[/C][C]2.48777057051833[/C][C]754.616187960333[/C][/ROW]
[ROW][C]Winsorized Mean ( 17 / 24 )[/C][C]1878.11236111111[/C][C]2.37872054756129[/C][C]789.547289628699[/C][/ROW]
[ROW][C]Winsorized Mean ( 18 / 24 )[/C][C]1878.34236111111[/C][C]2.3428865258077[/C][C]801.721440804122[/C][/ROW]
[ROW][C]Winsorized Mean ( 19 / 24 )[/C][C]1878.65375[/C][C]2.2902182314428[/C][C]820.294644504894[/C][/ROW]
[ROW][C]Winsorized Mean ( 20 / 24 )[/C][C]1878.41486111111[/C][C]2.25146418185358[/C][C]834.308125463783[/C][/ROW]
[ROW][C]Winsorized Mean ( 21 / 24 )[/C][C]1878.30402777778[/C][C]2.16906286475444[/C][C]865.95186257565[/C][/ROW]
[ROW][C]Winsorized Mean ( 22 / 24 )[/C][C]1874.90319444444[/C][C]1.61428662745698[/C][C]1161.44379972844[/C][/ROW]
[ROW][C]Winsorized Mean ( 23 / 24 )[/C][C]1873.29638888889[/C][C]1.36989936440801[/C][C]1367.47007667853[/C][/ROW]
[ROW][C]Winsorized Mean ( 24 / 24 )[/C][C]1874.06972222222[/C][C]1.26228571171727[/C][C]1484.66365801816[/C][/ROW]
[ROW][C]Trimmed Mean ( 1 / 24 )[/C][C]1878.57071428571[/C][C]3.26677515129004[/C][C]575.053570351749[/C][/ROW]
[ROW][C]Trimmed Mean ( 2 / 24 )[/C][C]1878.46955882353[/C][C]3.25417654535143[/C][C]577.248816296372[/C][/ROW]
[ROW][C]Trimmed Mean ( 3 / 24 )[/C][C]1878.36803030303[/C][C]3.23826468838797[/C][C]580.053890294586[/C][/ROW]
[ROW][C]Trimmed Mean ( 4 / 24 )[/C][C]1878.24703125[/C][C]3.22071611380121[/C][C]583.176835487441[/C][/ROW]
[ROW][C]Trimmed Mean ( 5 / 24 )[/C][C]1878.11822580645[/C][C]3.19718194202274[/C][C]587.429261100554[/C][/ROW]
[ROW][C]Trimmed Mean ( 6 / 24 )[/C][C]1877.98216666667[/C][C]3.16673320856343[/C][C]593.034538428515[/C][/ROW]
[ROW][C]Trimmed Mean ( 7 / 24 )[/C][C]1877.83775862069[/C][C]3.12955168858299[/C][C]600.034108869742[/C][/ROW]
[ROW][C]Trimmed Mean ( 8 / 24 )[/C][C]1877.66767857143[/C][C]3.08714973817496[/C][C]608.22047448902[/C][/ROW]
[ROW][C]Trimmed Mean ( 9 / 24 )[/C][C]1877.48888888889[/C][C]3.03672221442689[/C][C]618.26165066047[/C][/ROW]
[ROW][C]Trimmed Mean ( 10 / 24 )[/C][C]1877.29634615385[/C][C]2.9721729032614[/C][C]631.624204666514[/C][/ROW]
[ROW][C]Trimmed Mean ( 11 / 24 )[/C][C]1877.0888[/C][C]2.88978939476953[/C][C]649.559031325085[/C][/ROW]
[ROW][C]Trimmed Mean ( 12 / 24 )[/C][C]1876.9325[/C][C]2.81376239596061[/C][C]667.054369158709[/C][/ROW]
[ROW][C]Trimmed Mean ( 13 / 24 )[/C][C]1876.76108695652[/C][C]2.71963048478006[/C][C]690.079441843108[/C][/ROW]
[ROW][C]Trimmed Mean ( 14 / 24 )[/C][C]1876.47045454545[/C][C]2.62487410257934[/C][C]714.880173758252[/C][/ROW]
[ROW][C]Trimmed Mean ( 15 / 24 )[/C][C]1876.17976190476[/C][C]2.50951521358449[/C][C]747.626374906453[/C][/ROW]
[ROW][C]Trimmed Mean ( 16 / 24 )[/C][C]1876.0215[/C][C]2.41648867293233[/C][C]776.341938207188[/C][/ROW]
[ROW][C]Trimmed Mean ( 17 / 24 )[/C][C]1875.86868421053[/C][C]2.3391447833261[/C][C]801.946376975937[/C][/ROW]
[ROW][C]Trimmed Mean ( 18 / 24 )[/C][C]1875.60472222222[/C][C]2.2573133168645[/C][C]830.901367661052[/C][/ROW]
[ROW][C]Trimmed Mean ( 19 / 24 )[/C][C]1875.28264705882[/C][C]2.14960748847644[/C][C]872.383752434706[/C][/ROW]
[ROW][C]Trimmed Mean ( 20 / 24 )[/C][C]1874.8834375[/C][C]2.00755883140882[/C][C]933.912076780477[/C][/ROW]
[ROW][C]Trimmed Mean ( 21 / 24 )[/C][C]1874.45966666667[/C][C]1.81057243017346[/C][C]1035.28565630875[/C][/ROW]
[ROW][C]Trimmed Mean ( 22 / 24 )[/C][C]1873.98892857143[/C][C]1.53687189512766[/C][C]1219.35272192336[/C][/ROW]
[ROW][C]Trimmed Mean ( 23 / 24 )[/C][C]1873.87384615385[/C][C]1.39130155741617[/C][C]1346.84952817409[/C][/ROW]
[ROW][C]Trimmed Mean ( 24 / 24 )[/C][C]1873.94916666667[/C][C]1.27307896152224[/C][C]1471.98188274666[/C][/ROW]
[ROW][C]Median[/C][C]1875.95[/C][C][/C][C][/C][/ROW]
[ROW][C]Midrange[/C][C]1881.5[/C][C][/C][C][/C][/ROW]
[ROW][C]Midmean - Weighted Average at Xnp[/C][C]1875.07135135135[/C][C][/C][C][/C][/ROW]
[ROW][C]Midmean - Weighted Average at X(n+1)p[/C][C]1875.60472222222[/C][C][/C][C][/C][/ROW]
[ROW][C]Midmean - Empirical Distribution Function[/C][C]1875.07135135135[/C][C][/C][C][/C][/ROW]
[ROW][C]Midmean - Empirical Distribution Function - Averaging[/C][C]1875.60472222222[/C][C][/C][C][/C][/ROW]
[ROW][C]Midmean - Empirical Distribution Function - Interpolation[/C][C]1875.60472222222[/C][C][/C][C][/C][/ROW]
[ROW][C]Midmean - Closest Observation[/C][C]1875.07135135135[/C][C][/C][C][/C][/ROW]
[ROW][C]Midmean - True Basic - Statistics Graphics Toolkit[/C][C]1875.60472222222[/C][C][/C][C][/C][/ROW]
[ROW][C]Midmean - MS Excel (old versions)[/C][C]1876.62512820513[/C][C][/C][C][/C][/ROW]
[ROW][C]Number of observations[/C][C]72[/C][C][/C][C][/C][/ROW]
[/TABLE]
Source: https://freestatistics.org/blog/index.php?pk=179495&T=1

Globally Unique Identifier (entire table): ba.freestatistics.org/blog/index.php?pk=179495&T=1

As an alternative you can also use a QR Code:  

The GUIDs for individual cells are displayed in the table below:

Central Tendency - Ungrouped Data
MeasureValueS.E.Value/S.E.
Arithmetic Mean1878.652083333333.27844863724267573.0308115833
Geometric Mean1878.44956792005
Harmonic Mean1878.24765755147
Quadratic Mean1878.85517648935
Winsorized Mean ( 1 / 24 )1878.666253.2753738478848573.573075089802
Winsorized Mean ( 2 / 24 )1878.655694444443.27300849641746573.984362246774
Winsorized Mean ( 3 / 24 )1878.690694444443.26405840064427575.568958592659
Winsorized Mean ( 4 / 24 )1878.690694444443.26405840064427575.568958592659
Winsorized Mean ( 5 / 24 )1878.685138888893.26302545695688575.749458185645
Winsorized Mean ( 6 / 24 )1878.680138888893.25557183083674577.066099753675
Winsorized Mean ( 7 / 24 )1878.763753.23455991349952580.840608998749
Winsorized Mean ( 8 / 24 )1878.740416666673.21835104186868583.758698857104
Winsorized Mean ( 9 / 24 )1878.740416666673.21835104186868583.758698857104
Winsorized Mean ( 10 / 24 )1878.737638888893.21784151410545583.850270640557
Winsorized Mean ( 11 / 24 )1878.2353.09391874114994607.073151281893
Winsorized Mean ( 12 / 24 )1878.246666666673.07478749090746610.854139422931
Winsorized Mean ( 13 / 24 )1879.072.94875615669972637.241569036036
Winsorized Mean ( 14 / 24 )1878.844444444442.90894572893151645.885011108325
Winsorized Mean ( 15 / 24 )1877.498611111112.6805200041023700.423279153956
Winsorized Mean ( 16 / 24 )1877.311944444442.48777057051833754.616187960333
Winsorized Mean ( 17 / 24 )1878.112361111112.37872054756129789.547289628699
Winsorized Mean ( 18 / 24 )1878.342361111112.3428865258077801.721440804122
Winsorized Mean ( 19 / 24 )1878.653752.2902182314428820.294644504894
Winsorized Mean ( 20 / 24 )1878.414861111112.25146418185358834.308125463783
Winsorized Mean ( 21 / 24 )1878.304027777782.16906286475444865.95186257565
Winsorized Mean ( 22 / 24 )1874.903194444441.614286627456981161.44379972844
Winsorized Mean ( 23 / 24 )1873.296388888891.369899364408011367.47007667853
Winsorized Mean ( 24 / 24 )1874.069722222221.262285711717271484.66365801816
Trimmed Mean ( 1 / 24 )1878.570714285713.26677515129004575.053570351749
Trimmed Mean ( 2 / 24 )1878.469558823533.25417654535143577.248816296372
Trimmed Mean ( 3 / 24 )1878.368030303033.23826468838797580.053890294586
Trimmed Mean ( 4 / 24 )1878.247031253.22071611380121583.176835487441
Trimmed Mean ( 5 / 24 )1878.118225806453.19718194202274587.429261100554
Trimmed Mean ( 6 / 24 )1877.982166666673.16673320856343593.034538428515
Trimmed Mean ( 7 / 24 )1877.837758620693.12955168858299600.034108869742
Trimmed Mean ( 8 / 24 )1877.667678571433.08714973817496608.22047448902
Trimmed Mean ( 9 / 24 )1877.488888888893.03672221442689618.26165066047
Trimmed Mean ( 10 / 24 )1877.296346153852.9721729032614631.624204666514
Trimmed Mean ( 11 / 24 )1877.08882.88978939476953649.559031325085
Trimmed Mean ( 12 / 24 )1876.93252.81376239596061667.054369158709
Trimmed Mean ( 13 / 24 )1876.761086956522.71963048478006690.079441843108
Trimmed Mean ( 14 / 24 )1876.470454545452.62487410257934714.880173758252
Trimmed Mean ( 15 / 24 )1876.179761904762.50951521358449747.626374906453
Trimmed Mean ( 16 / 24 )1876.02152.41648867293233776.341938207188
Trimmed Mean ( 17 / 24 )1875.868684210532.3391447833261801.946376975937
Trimmed Mean ( 18 / 24 )1875.604722222222.2573133168645830.901367661052
Trimmed Mean ( 19 / 24 )1875.282647058822.14960748847644872.383752434706
Trimmed Mean ( 20 / 24 )1874.88343752.00755883140882933.912076780477
Trimmed Mean ( 21 / 24 )1874.459666666671.810572430173461035.28565630875
Trimmed Mean ( 22 / 24 )1873.988928571431.536871895127661219.35272192336
Trimmed Mean ( 23 / 24 )1873.873846153851.391301557416171346.84952817409
Trimmed Mean ( 24 / 24 )1873.949166666671.273078961522241471.98188274666
Median1875.95
Midrange1881.5
Midmean - Weighted Average at Xnp1875.07135135135
Midmean - Weighted Average at X(n+1)p1875.60472222222
Midmean - Empirical Distribution Function1875.07135135135
Midmean - Empirical Distribution Function - Averaging1875.60472222222
Midmean - Empirical Distribution Function - Interpolation1875.60472222222
Midmean - Closest Observation1875.07135135135
Midmean - True Basic - Statistics Graphics Toolkit1875.60472222222
Midmean - MS Excel (old versions)1876.62512820513
Number of observations72


Parameters (Session):
Parameters (R input):
R code (references can be found in the software module):
geomean <- function(x) {
return(exp(mean(log(x))))
}
harmean <- function(x) {
return(1/mean(1/x))
}
quamean <- function(x) {
return(sqrt(mean(x*x)))
}
winmean <- function(x) {
x <-sort(x[!is.na(x)])
n<-length(x)
denom <- 3
nodenom <- n/denom
if (nodenom>40) denom <- n/40
sqrtn = sqrt(n)
roundnodenom = floor(nodenom)
win <- array(NA,dim=c(roundnodenom,2))
for (j in 1:roundnodenom) {
win[j,1] <- (j*x[j+1]+sum(x[(j+1):(n-j)])+j*x[n-j])/n
win[j,2] <- sd(c(rep(x[j+1],j),x[(j+1):(n-j)],rep(x[n-j],j)))/sqrtn
}
return(win)
}
trimean <- function(x) {
x <-sort(x[!is.na(x)])
n<-length(x)
denom <- 3
nodenom <- n/denom
if (nodenom>40) denom <- n/40
sqrtn = sqrt(n)
roundnodenom = floor(nodenom)
tri <- array(NA,dim=c(roundnodenom,2))
for (j in 1:roundnodenom) {
tri[j,1] <- mean(x,trim=j/n)
tri[j,2] <- sd(x[(j+1):(n-j)]) / sqrt(n-j*2)
}
return(tri)
}
midrange <- function(x) {
return((max(x)+min(x))/2)
}
q1 <- function(data,n,p,i,f) {
np <- n*p;
i <<- floor(np)
f <<- np - i
qvalue <- (1-f)*data[i] + f*data[i+1]
}
q2 <- function(data,n,p,i,f) {
np <- (n+1)*p
i <<- floor(np)
f <<- np - i
qvalue <- (1-f)*data[i] + f*data[i+1]
}
q3 <- function(data,n,p,i,f) {
np <- n*p
i <<- floor(np)
f <<- np - i
if (f==0) {
qvalue <- data[i]
} else {
qvalue <- data[i+1]
}
}
q4 <- function(data,n,p,i,f) {
np <- n*p
i <<- floor(np)
f <<- np - i
if (f==0) {
qvalue <- (data[i]+data[i+1])/2
} else {
qvalue <- data[i+1]
}
}
q5 <- function(data,n,p,i,f) {
np <- (n-1)*p
i <<- floor(np)
f <<- np - i
if (f==0) {
qvalue <- data[i+1]
} else {
qvalue <- data[i+1] + f*(data[i+2]-data[i+1])
}
}
q6 <- function(data,n,p,i,f) {
np <- n*p+0.5
i <<- floor(np)
f <<- np - i
qvalue <- data[i]
}
q7 <- function(data,n,p,i,f) {
np <- (n+1)*p
i <<- floor(np)
f <<- np - i
if (f==0) {
qvalue <- data[i]
} else {
qvalue <- f*data[i] + (1-f)*data[i+1]
}
}
q8 <- function(data,n,p,i,f) {
np <- (n+1)*p
i <<- floor(np)
f <<- np - i
if (f==0) {
qvalue <- data[i]
} else {
if (f == 0.5) {
qvalue <- (data[i]+data[i+1])/2
} else {
if (f < 0.5) {
qvalue <- data[i]
} else {
qvalue <- data[i+1]
}
}
}
}
midmean <- function(x,def) {
x <-sort(x[!is.na(x)])
n<-length(x)
if (def==1) {
qvalue1 <- q1(x,n,0.25,i,f)
qvalue3 <- q1(x,n,0.75,i,f)
}
if (def==2) {
qvalue1 <- q2(x,n,0.25,i,f)
qvalue3 <- q2(x,n,0.75,i,f)
}
if (def==3) {
qvalue1 <- q3(x,n,0.25,i,f)
qvalue3 <- q3(x,n,0.75,i,f)
}
if (def==4) {
qvalue1 <- q4(x,n,0.25,i,f)
qvalue3 <- q4(x,n,0.75,i,f)
}
if (def==5) {
qvalue1 <- q5(x,n,0.25,i,f)
qvalue3 <- q5(x,n,0.75,i,f)
}
if (def==6) {
qvalue1 <- q6(x,n,0.25,i,f)
qvalue3 <- q6(x,n,0.75,i,f)
}
if (def==7) {
qvalue1 <- q7(x,n,0.25,i,f)
qvalue3 <- q7(x,n,0.75,i,f)
}
if (def==8) {
qvalue1 <- q8(x,n,0.25,i,f)
qvalue3 <- q8(x,n,0.75,i,f)
}
midm <- 0
myn <- 0
roundno4 <- round(n/4)
round3no4 <- round(3*n/4)
for (i in 1:n) {
if ((x[i]>=qvalue1) & (x[i]<=qvalue3)){
midm = midm + x[i]
myn = myn + 1
}
}
midm = midm / myn
return(midm)
}
(arm <- mean(x))
sqrtn <- sqrt(length(x))
(armse <- sd(x) / sqrtn)
(armose <- arm / armse)
(geo <- geomean(x))
(har <- harmean(x))
(qua <- quamean(x))
(win <- winmean(x))
(tri <- trimean(x))
(midr <- midrange(x))
midm <- array(NA,dim=8)
for (j in 1:8) midm[j] <- midmean(x,j)
midm
bitmap(file='test1.png')
lb <- win[,1] - 2*win[,2]
ub <- win[,1] + 2*win[,2]
if ((ylimmin == '') | (ylimmax == '')) plot(win[,1],type='b',main=main, xlab='j', pch=19, ylab='Winsorized Mean(j/n)', ylim=c(min(lb),max(ub))) else plot(win[,1],type='l',main=main, xlab='j', pch=19, ylab='Winsorized Mean(j/n)', ylim=c(ylimmin,ylimmax))
lines(ub,lty=3)
lines(lb,lty=3)
grid()
dev.off()
bitmap(file='test2.png')
lb <- tri[,1] - 2*tri[,2]
ub <- tri[,1] + 2*tri[,2]
if ((ylimmin == '') | (ylimmax == '')) plot(tri[,1],type='b',main=main, xlab='j', pch=19, ylab='Trimmed Mean(j/n)', ylim=c(min(lb),max(ub))) else plot(tri[,1],type='l',main=main, xlab='j', pch=19, ylab='Trimmed Mean(j/n)', ylim=c(ylimmin,ylimmax))
lines(ub,lty=3)
lines(lb,lty=3)
grid()
dev.off()
load(file='createtable')
a<-table.start()
a<-table.row.start(a)
a<-table.element(a,'Central Tendency - Ungrouped Data',4,TRUE)
a<-table.row.end(a)
a<-table.row.start(a)
a<-table.element(a,'Measure',header=TRUE)
a<-table.element(a,'Value',header=TRUE)
a<-table.element(a,'S.E.',header=TRUE)
a<-table.element(a,'Value/S.E.',header=TRUE)
a<-table.row.end(a)
a<-table.row.start(a)
a<-table.element(a,hyperlink('arithmetic_mean.htm', 'Arithmetic Mean', 'click to view the definition of the Arithmetic Mean'),header=TRUE)
a<-table.element(a,arm)
a<-table.element(a,hyperlink('arithmetic_mean_standard_error.htm', armse, 'click to view the definition of the Standard Error of the Arithmetic Mean'))
a<-table.element(a,armose)
a<-table.row.end(a)
a<-table.row.start(a)
a<-table.element(a,hyperlink('geometric_mean.htm', 'Geometric Mean', 'click to view the definition of the Geometric Mean'),header=TRUE)
a<-table.element(a,geo)
a<-table.element(a,'')
a<-table.row.end(a)
a<-table.row.start(a)
a<-table.element(a,hyperlink('harmonic_mean.htm', 'Harmonic Mean', 'click to view the definition of the Harmonic Mean'),header=TRUE)
a<-table.element(a,har)
a<-table.element(a,'')
a<-table.row.end(a)
a<-table.row.start(a)
a<-table.element(a,hyperlink('quadratic_mean.htm', 'Quadratic Mean', 'click to view the definition of the Quadratic Mean'),header=TRUE)
a<-table.element(a,qua)
a<-table.element(a,'')
a<-table.row.end(a)
for (j in 1:length(win[,1])) {
a<-table.row.start(a)
mylabel <- paste('Winsorized Mean (',j)
mylabel <- paste(mylabel,'/')
mylabel <- paste(mylabel,length(win[,1]))
mylabel <- paste(mylabel,')')
a<-table.element(a,hyperlink('winsorized_mean.htm', mylabel, 'click to view the definition of the Winsorized Mean'),header=TRUE)
a<-table.element(a,win[j,1])
a<-table.element(a,win[j,2])
a<-table.element(a,win[j,1]/win[j,2])
a<-table.row.end(a)
}
for (j in 1:length(tri[,1])) {
a<-table.row.start(a)
mylabel <- paste('Trimmed Mean (',j)
mylabel <- paste(mylabel,'/')
mylabel <- paste(mylabel,length(tri[,1]))
mylabel <- paste(mylabel,')')
a<-table.element(a,hyperlink('arithmetic_mean.htm', mylabel, 'click to view the definition of the Trimmed Mean'),header=TRUE)
a<-table.element(a,tri[j,1])
a<-table.element(a,tri[j,2])
a<-table.element(a,tri[j,1]/tri[j,2])
a<-table.row.end(a)
}
a<-table.row.start(a)
a<-table.element(a,hyperlink('median_1.htm', 'Median', 'click to view the definition of the Median'),header=TRUE)
a<-table.element(a,median(x))
a<-table.element(a,'')
a<-table.row.end(a)
a<-table.row.start(a)
a<-table.element(a,hyperlink('midrange.htm', 'Midrange', 'click to view the definition of the Midrange'),header=TRUE)
a<-table.element(a,midr)
a<-table.element(a,'')
a<-table.row.end(a)
a<-table.row.start(a)
mymid <- hyperlink('midmean.htm', 'Midmean', 'click to view the definition of the Midmean')
mylabel <- paste(mymid,hyperlink('method_1.htm','Weighted Average at Xnp',''),sep=' - ')
a<-table.element(a,mylabel,header=TRUE)
a<-table.element(a,midm[1])
a<-table.element(a,'')
a<-table.row.end(a)
a<-table.row.start(a)
mymid <- hyperlink('midmean.htm', 'Midmean', 'click to view the definition of the Midmean')
mylabel <- paste(mymid,hyperlink('method_2.htm','Weighted Average at X(n+1)p',''),sep=' - ')
a<-table.element(a,mylabel,header=TRUE)
a<-table.element(a,midm[2])
a<-table.element(a,'')
a<-table.row.end(a)
a<-table.row.start(a)
mymid <- hyperlink('midmean.htm', 'Midmean', 'click to view the definition of the Midmean')
mylabel <- paste(mymid,hyperlink('method_3.htm','Empirical Distribution Function',''),sep=' - ')
a<-table.element(a,mylabel,header=TRUE)
a<-table.element(a,midm[3])
a<-table.element(a,'')
a<-table.row.end(a)
a<-table.row.start(a)
mymid <- hyperlink('midmean.htm', 'Midmean', 'click to view the definition of the Midmean')
mylabel <- paste(mymid,hyperlink('method_4.htm','Empirical Distribution Function - Averaging',''),sep=' - ')
a<-table.element(a,mylabel,header=TRUE)
a<-table.element(a,midm[4])
a<-table.element(a,'')
a<-table.row.end(a)
a<-table.row.start(a)
mymid <- hyperlink('midmean.htm', 'Midmean', 'click to view the definition of the Midmean')
mylabel <- paste(mymid,hyperlink('method_5.htm','Empirical Distribution Function - Interpolation',''),sep=' - ')
a<-table.element(a,mylabel,header=TRUE)
a<-table.element(a,midm[5])
a<-table.element(a,'')
a<-table.row.end(a)
a<-table.row.start(a)
mymid <- hyperlink('midmean.htm', 'Midmean', 'click to view the definition of the Midmean')
mylabel <- paste(mymid,hyperlink('method_6.htm','Closest Observation',''),sep=' - ')
a<-table.element(a,mylabel,header=TRUE)
a<-table.element(a,midm[6])
a<-table.element(a,'')
a<-table.row.end(a)
a<-table.row.start(a)
mymid <- hyperlink('midmean.htm', 'Midmean', 'click to view the definition of the Midmean')
mylabel <- paste(mymid,hyperlink('method_7.htm','True Basic - Statistics Graphics Toolkit',''),sep=' - ')
a<-table.element(a,mylabel,header=TRUE)
a<-table.element(a,midm[7])
a<-table.element(a,'')
a<-table.row.end(a)
a<-table.row.start(a)
mymid <- hyperlink('midmean.htm', 'Midmean', 'click to view the definition of the Midmean')
mylabel <- paste(mymid,hyperlink('method_8.htm','MS Excel (old versions)',''),sep=' - ')
a<-table.element(a,mylabel,header=TRUE)
a<-table.element(a,midm[8])
a<-table.element(a,'')
a<-table.row.end(a)
a<-table.row.start(a)
a<-table.element(a,'Number of observations',header=TRUE)
a<-table.element(a,length(x))
a<-table.element(a,'')
a<-table.row.end(a)
a<-table.end(a)
table.save(a,file='mytable.tab')