Free Statistics

of Irreproducible Research!

Author's title

Author*The author of this computation has been verified*
R Software Modulerwasp_multipleregression.wasp
Title produced by softwareMultiple Regression
Date of computationTue, 30 Oct 2012 16:40:15 -0400
Cite this page as followsStatistical Computations at FreeStatistics.org, Office for Research Development and Education, URL https://freestatistics.org/blog/index.php?v=date/2012/Oct/30/t1351629787zu6fjsfvn12uztf.htm/, Retrieved Sat, 04 May 2024 14:31:52 +0000
Statistical Computations at FreeStatistics.org, Office for Research Development and Education, URL https://freestatistics.org/blog/index.php?pk=185330, Retrieved Sat, 04 May 2024 14:31:52 +0000
QR Codes:

Original text written by user:
IsPrivate?No (this computation is public)
User-defined keywords
Estimated Impact71
Family? (F = Feedback message, R = changed R code, M = changed R Module, P = changed Parameters, D = changed Data)
-       [Multiple Regression] [Data OMEC Multipl...] [2012-10-30 20:40:15] [851af2766980873020febd248b5479af] [Current]
Feedback Forum

Post a new message
Dataseries X:
393.60	36.86	.05000	458.30
410.20	37.38	.04500	481.20
433.00	38.19	.03500	514.10
472.40	39.78	.04250	551.80
496.90	41.39	.04750	617.60
540.90	43.13	.04750	676.70
581.40	44.38	.05250	719.60
612.70	45.58	.04000	767.00
662.40	47.29	.04500	824.10
720.20	49.14	.07500	916.50
769.00	51.27	.06500	1019.00
848.10	54.07	.05500	1117.20
945.80	57.82	.05000	1267.50
1082.40	65.16	.07750	1448.70
1255.90	73.48	.08750	1693.60
1421.10	80.21	.06000	1879.80
1609.50	85.91	.09000	2141.40
1763.80	89.75	.06000	2294.10
1888.20	93.76	.10500	2465.60
2049.60	100.00	.12000	2623.00
2232.60	107.62	.15000	2833.70
2394.20	117.02	.15000	2926.20
2622.60	125.98	.11500	3147.20
2761.50	133.97	.10000	3314.50
2958.70	140.5	.11000	3597.80
3198.30	142.33	.09750	3846.00
3303.10	144.53	.08000	4091.60
3463.90	146.21	.07000	4259.10
3608.80	150.75	.07750	4534.20
3874.70	155.96	.10250	4915.80
4007.70	160.97	.10250	5115.60
4232.90	164.87	.08000	5438.60
4439.50	169.42	.07750	5698.60
4545.90	173.44	.05250	5889.50


Summary of computational transaction
Raw Inputview raw input (R code)
Raw Outputview raw output of R engine
Computing time13 seconds
R Server'Herman Ole Andreas Wold' @ wold.wessa.net

\begin{tabular}{lllllllll}
\hline
Summary of computational transaction \tabularnewline
Raw Input & view raw input (R code)  \tabularnewline
Raw Output & view raw output of R engine  \tabularnewline
Computing time & 13 seconds \tabularnewline
R Server & 'Herman Ole Andreas Wold' @ wold.wessa.net \tabularnewline
\hline
\end{tabular}
%Source: https://freestatistics.org/blog/index.php?pk=185330&T=0

[TABLE]
[ROW][C]Summary of computational transaction[/C][/ROW]
[ROW][C]Raw Input[/C][C]view raw input (R code) [/C][/ROW]
[ROW][C]Raw Output[/C][C]view raw output of R engine [/C][/ROW]
[ROW][C]Computing time[/C][C]13 seconds[/C][/ROW]
[ROW][C]R Server[/C][C]'Herman Ole Andreas Wold' @ wold.wessa.net[/C][/ROW]
[/TABLE]
Source: https://freestatistics.org/blog/index.php?pk=185330&T=0

Globally Unique Identifier (entire table): ba.freestatistics.org/blog/index.php?pk=185330&T=0

As an alternative you can also use a QR Code:  

The GUIDs for individual cells are displayed in the table below:

Summary of computational transaction
Raw Inputview raw input (R code)
Raw Outputview raw output of R engine
Computing time13 seconds
R Server'Herman Ole Andreas Wold' @ wold.wessa.net


Multiple Linear Regression - Estimated Regression Equation
Cons[t] = -214.817350915112 + 9.79463460703813CPI[t] -892.033307527903Rent[t] + 0.532978382102535Nyd[t] + e[t]

\begin{tabular}{lllllllll}
\hline
Multiple Linear Regression - Estimated Regression Equation \tabularnewline
Cons[t] =  -214.817350915112 +  9.79463460703813CPI[t] -892.033307527903Rent[t] +  0.532978382102535Nyd[t]  + e[t] \tabularnewline
\hline
\end{tabular}
%Source: https://freestatistics.org/blog/index.php?pk=185330&T=1

[TABLE]
[ROW][C]Multiple Linear Regression - Estimated Regression Equation[/C][/ROW]
[ROW][C]Cons[t] =  -214.817350915112 +  9.79463460703813CPI[t] -892.033307527903Rent[t] +  0.532978382102535Nyd[t]  + e[t][/C][/ROW]
[/TABLE]
Source: https://freestatistics.org/blog/index.php?pk=185330&T=1

Globally Unique Identifier (entire table): ba.freestatistics.org/blog/index.php?pk=185330&T=1

As an alternative you can also use a QR Code:  

The GUIDs for individual cells are displayed in the table below:

Multiple Linear Regression - Estimated Regression Equation
Cons[t] = -214.817350915112 + 9.79463460703813CPI[t] -892.033307527903Rent[t] + 0.532978382102535Nyd[t] + e[t]


Multiple Linear Regression - Ordinary Least Squares
VariableParameterS.D.T-STATH0: parameter = 02-tail p-value1-tail p-value
(Intercept)-214.81735091511230.784697-6.978100
CPI9.794634607038131.2954317.560900
Rent-892.033307527903339.266981-2.62930.0133650.006683
Nyd0.5329783821025350.03374715.793300

\begin{tabular}{lllllllll}
\hline
Multiple Linear Regression - Ordinary Least Squares \tabularnewline
Variable & Parameter & S.D. & T-STATH0: parameter = 0 & 2-tail p-value & 1-tail p-value \tabularnewline
(Intercept) & -214.817350915112 & 30.784697 & -6.9781 & 0 & 0 \tabularnewline
CPI & 9.79463460703813 & 1.295431 & 7.5609 & 0 & 0 \tabularnewline
Rent & -892.033307527903 & 339.266981 & -2.6293 & 0.013365 & 0.006683 \tabularnewline
Nyd & 0.532978382102535 & 0.033747 & 15.7933 & 0 & 0 \tabularnewline
\hline
\end{tabular}
%Source: https://freestatistics.org/blog/index.php?pk=185330&T=2

[TABLE]
[ROW][C]Multiple Linear Regression - Ordinary Least Squares[/C][/ROW]
[ROW][C]Variable[/C][C]Parameter[/C][C]S.D.[/C][C]T-STATH0: parameter = 0[/C][C]2-tail p-value[/C][C]1-tail p-value[/C][/ROW]
[ROW][C](Intercept)[/C][C]-214.817350915112[/C][C]30.784697[/C][C]-6.9781[/C][C]0[/C][C]0[/C][/ROW]
[ROW][C]CPI[/C][C]9.79463460703813[/C][C]1.295431[/C][C]7.5609[/C][C]0[/C][C]0[/C][/ROW]
[ROW][C]Rent[/C][C]-892.033307527903[/C][C]339.266981[/C][C]-2.6293[/C][C]0.013365[/C][C]0.006683[/C][/ROW]
[ROW][C]Nyd[/C][C]0.532978382102535[/C][C]0.033747[/C][C]15.7933[/C][C]0[/C][C]0[/C][/ROW]
[/TABLE]
Source: https://freestatistics.org/blog/index.php?pk=185330&T=2

Globally Unique Identifier (entire table): ba.freestatistics.org/blog/index.php?pk=185330&T=2

As an alternative you can also use a QR Code:  

The GUIDs for individual cells are displayed in the table below:

Multiple Linear Regression - Ordinary Least Squares
VariableParameterS.D.T-STATH0: parameter = 02-tail p-value1-tail p-value
(Intercept)-214.81735091511230.784697-6.978100
CPI9.794634607038131.2954317.560900
Rent-892.033307527903339.266981-2.62930.0133650.006683
Nyd0.5329783821025350.03374715.793300


Multiple Linear Regression - Regression Statistics
Multiple R0.999592664157468
R-squared0.999185494237425
Adjusted R-squared0.999104043661167
F-TEST (value)12267.3839786993
F-TEST (DF numerator)3
F-TEST (DF denominator)30
p-value0
Multiple Linear Regression - Residual Statistics
Residual Standard Deviation41.1685032509085
Sum Squared Residuals50845.369797602

\begin{tabular}{lllllllll}
\hline
Multiple Linear Regression - Regression Statistics \tabularnewline
Multiple R & 0.999592664157468 \tabularnewline
R-squared & 0.999185494237425 \tabularnewline
Adjusted R-squared & 0.999104043661167 \tabularnewline
F-TEST (value) & 12267.3839786993 \tabularnewline
F-TEST (DF numerator) & 3 \tabularnewline
F-TEST (DF denominator) & 30 \tabularnewline
p-value & 0 \tabularnewline
Multiple Linear Regression - Residual Statistics \tabularnewline
Residual Standard Deviation & 41.1685032509085 \tabularnewline
Sum Squared Residuals & 50845.369797602 \tabularnewline
\hline
\end{tabular}
%Source: https://freestatistics.org/blog/index.php?pk=185330&T=3

[TABLE]
[ROW][C]Multiple Linear Regression - Regression Statistics[/C][/ROW]
[ROW][C]Multiple R[/C][C]0.999592664157468[/C][/ROW]
[ROW][C]R-squared[/C][C]0.999185494237425[/C][/ROW]
[ROW][C]Adjusted R-squared[/C][C]0.999104043661167[/C][/ROW]
[ROW][C]F-TEST (value)[/C][C]12267.3839786993[/C][/ROW]
[ROW][C]F-TEST (DF numerator)[/C][C]3[/C][/ROW]
[ROW][C]F-TEST (DF denominator)[/C][C]30[/C][/ROW]
[ROW][C]p-value[/C][C]0[/C][/ROW]
[ROW][C]Multiple Linear Regression - Residual Statistics[/C][/ROW]
[ROW][C]Residual Standard Deviation[/C][C]41.1685032509085[/C][/ROW]
[ROW][C]Sum Squared Residuals[/C][C]50845.369797602[/C][/ROW]
[/TABLE]
Source: https://freestatistics.org/blog/index.php?pk=185330&T=3

Globally Unique Identifier (entire table): ba.freestatistics.org/blog/index.php?pk=185330&T=3

As an alternative you can also use a QR Code:  

The GUIDs for individual cells are displayed in the table below:

Multiple Linear Regression - Regression Statistics
Multiple R0.999592664157468
R-squared0.999185494237425
Adjusted R-squared0.999104043661167
F-TEST (value)12267.3839786993
F-TEST (DF numerator)3
F-TEST (DF denominator)30
p-value0
Multiple Linear Regression - Residual Statistics
Residual Standard Deviation41.1685032509085
Sum Squared Residuals50845.369797602


Multiple Linear Regression - Actuals, Interpolation, and Residuals
Time or IndexActualsInterpolationForecastResidualsPrediction Error
1393.6345.87520784151147.7247921584893
2410.2367.63378932495842.5662106750416
3433402.02276520311230.9772347968885
4472.4430.99926942710841.4007305728917
5496.9477.37844214914719.521557850853
6540.9525.92012874765314.9798712523468
7581.4556.5680280610124.8319719389899
8612.7604.7351812452157.96481875478521
9662.4647.45690550366514.9430944963347
10720.2688.06318280712332.1368171928772
11769772.476371760903-3.47637176090302
12848.1861.160158858358-13.0601588583577
13945.8982.456856002401-36.6568560024013
141082.41126.39424089802-43.9942408980231
151255.91329.49167353021-73.5916735302122
161421.11519.18105514009-98.0810551400882
171609.51687.67661793239-78.1766179323917
181763.81833.43481299631-69.6348129963123
191888.21923.97559146236-35.7755914623644
202049.62055.6044091403-6.00440914030289
212232.62215.777070729116.8229292708995
222394.22357.1471363797437.0528636202566
232622.62593.9164506669428.6835493330581
242761.52774.72336411585-13.2233641158492
252958.72980.75477067418-22.0547706741777
263198.33142.1146027870156.1853972129948
273303.13310.17287244861-7.0728724486101
283463.93424.8220706658939.0779293341119
293608.83609.22181489179-0.421814891788892
303874.73841.3355791165933.3644208834121
314007.73996.8957792419410.8042207580644
324232.94227.317621047885.58237895211883
334439.54412.6876711253826.812328874617
344545.94576.10850807725-30.2085080772482

\begin{tabular}{lllllllll}
\hline
Multiple Linear Regression - Actuals, Interpolation, and Residuals \tabularnewline
Time or Index & Actuals & InterpolationForecast & ResidualsPrediction Error \tabularnewline
1 & 393.6 & 345.875207841511 & 47.7247921584893 \tabularnewline
2 & 410.2 & 367.633789324958 & 42.5662106750416 \tabularnewline
3 & 433 & 402.022765203112 & 30.9772347968885 \tabularnewline
4 & 472.4 & 430.999269427108 & 41.4007305728917 \tabularnewline
5 & 496.9 & 477.378442149147 & 19.521557850853 \tabularnewline
6 & 540.9 & 525.920128747653 & 14.9798712523468 \tabularnewline
7 & 581.4 & 556.56802806101 & 24.8319719389899 \tabularnewline
8 & 612.7 & 604.735181245215 & 7.96481875478521 \tabularnewline
9 & 662.4 & 647.456905503665 & 14.9430944963347 \tabularnewline
10 & 720.2 & 688.063182807123 & 32.1368171928772 \tabularnewline
11 & 769 & 772.476371760903 & -3.47637176090302 \tabularnewline
12 & 848.1 & 861.160158858358 & -13.0601588583577 \tabularnewline
13 & 945.8 & 982.456856002401 & -36.6568560024013 \tabularnewline
14 & 1082.4 & 1126.39424089802 & -43.9942408980231 \tabularnewline
15 & 1255.9 & 1329.49167353021 & -73.5916735302122 \tabularnewline
16 & 1421.1 & 1519.18105514009 & -98.0810551400882 \tabularnewline
17 & 1609.5 & 1687.67661793239 & -78.1766179323917 \tabularnewline
18 & 1763.8 & 1833.43481299631 & -69.6348129963123 \tabularnewline
19 & 1888.2 & 1923.97559146236 & -35.7755914623644 \tabularnewline
20 & 2049.6 & 2055.6044091403 & -6.00440914030289 \tabularnewline
21 & 2232.6 & 2215.7770707291 & 16.8229292708995 \tabularnewline
22 & 2394.2 & 2357.14713637974 & 37.0528636202566 \tabularnewline
23 & 2622.6 & 2593.91645066694 & 28.6835493330581 \tabularnewline
24 & 2761.5 & 2774.72336411585 & -13.2233641158492 \tabularnewline
25 & 2958.7 & 2980.75477067418 & -22.0547706741777 \tabularnewline
26 & 3198.3 & 3142.11460278701 & 56.1853972129948 \tabularnewline
27 & 3303.1 & 3310.17287244861 & -7.0728724486101 \tabularnewline
28 & 3463.9 & 3424.82207066589 & 39.0779293341119 \tabularnewline
29 & 3608.8 & 3609.22181489179 & -0.421814891788892 \tabularnewline
30 & 3874.7 & 3841.33557911659 & 33.3644208834121 \tabularnewline
31 & 4007.7 & 3996.89577924194 & 10.8042207580644 \tabularnewline
32 & 4232.9 & 4227.31762104788 & 5.58237895211883 \tabularnewline
33 & 4439.5 & 4412.68767112538 & 26.812328874617 \tabularnewline
34 & 4545.9 & 4576.10850807725 & -30.2085080772482 \tabularnewline
\hline
\end{tabular}
%Source: https://freestatistics.org/blog/index.php?pk=185330&T=4

[TABLE]
[ROW][C]Multiple Linear Regression - Actuals, Interpolation, and Residuals[/C][/ROW]
[ROW][C]Time or Index[/C][C]Actuals[/C][C]InterpolationForecast[/C][C]ResidualsPrediction Error[/C][/ROW]
[ROW][C]1[/C][C]393.6[/C][C]345.875207841511[/C][C]47.7247921584893[/C][/ROW]
[ROW][C]2[/C][C]410.2[/C][C]367.633789324958[/C][C]42.5662106750416[/C][/ROW]
[ROW][C]3[/C][C]433[/C][C]402.022765203112[/C][C]30.9772347968885[/C][/ROW]
[ROW][C]4[/C][C]472.4[/C][C]430.999269427108[/C][C]41.4007305728917[/C][/ROW]
[ROW][C]5[/C][C]496.9[/C][C]477.378442149147[/C][C]19.521557850853[/C][/ROW]
[ROW][C]6[/C][C]540.9[/C][C]525.920128747653[/C][C]14.9798712523468[/C][/ROW]
[ROW][C]7[/C][C]581.4[/C][C]556.56802806101[/C][C]24.8319719389899[/C][/ROW]
[ROW][C]8[/C][C]612.7[/C][C]604.735181245215[/C][C]7.96481875478521[/C][/ROW]
[ROW][C]9[/C][C]662.4[/C][C]647.456905503665[/C][C]14.9430944963347[/C][/ROW]
[ROW][C]10[/C][C]720.2[/C][C]688.063182807123[/C][C]32.1368171928772[/C][/ROW]
[ROW][C]11[/C][C]769[/C][C]772.476371760903[/C][C]-3.47637176090302[/C][/ROW]
[ROW][C]12[/C][C]848.1[/C][C]861.160158858358[/C][C]-13.0601588583577[/C][/ROW]
[ROW][C]13[/C][C]945.8[/C][C]982.456856002401[/C][C]-36.6568560024013[/C][/ROW]
[ROW][C]14[/C][C]1082.4[/C][C]1126.39424089802[/C][C]-43.9942408980231[/C][/ROW]
[ROW][C]15[/C][C]1255.9[/C][C]1329.49167353021[/C][C]-73.5916735302122[/C][/ROW]
[ROW][C]16[/C][C]1421.1[/C][C]1519.18105514009[/C][C]-98.0810551400882[/C][/ROW]
[ROW][C]17[/C][C]1609.5[/C][C]1687.67661793239[/C][C]-78.1766179323917[/C][/ROW]
[ROW][C]18[/C][C]1763.8[/C][C]1833.43481299631[/C][C]-69.6348129963123[/C][/ROW]
[ROW][C]19[/C][C]1888.2[/C][C]1923.97559146236[/C][C]-35.7755914623644[/C][/ROW]
[ROW][C]20[/C][C]2049.6[/C][C]2055.6044091403[/C][C]-6.00440914030289[/C][/ROW]
[ROW][C]21[/C][C]2232.6[/C][C]2215.7770707291[/C][C]16.8229292708995[/C][/ROW]
[ROW][C]22[/C][C]2394.2[/C][C]2357.14713637974[/C][C]37.0528636202566[/C][/ROW]
[ROW][C]23[/C][C]2622.6[/C][C]2593.91645066694[/C][C]28.6835493330581[/C][/ROW]
[ROW][C]24[/C][C]2761.5[/C][C]2774.72336411585[/C][C]-13.2233641158492[/C][/ROW]
[ROW][C]25[/C][C]2958.7[/C][C]2980.75477067418[/C][C]-22.0547706741777[/C][/ROW]
[ROW][C]26[/C][C]3198.3[/C][C]3142.11460278701[/C][C]56.1853972129948[/C][/ROW]
[ROW][C]27[/C][C]3303.1[/C][C]3310.17287244861[/C][C]-7.0728724486101[/C][/ROW]
[ROW][C]28[/C][C]3463.9[/C][C]3424.82207066589[/C][C]39.0779293341119[/C][/ROW]
[ROW][C]29[/C][C]3608.8[/C][C]3609.22181489179[/C][C]-0.421814891788892[/C][/ROW]
[ROW][C]30[/C][C]3874.7[/C][C]3841.33557911659[/C][C]33.3644208834121[/C][/ROW]
[ROW][C]31[/C][C]4007.7[/C][C]3996.89577924194[/C][C]10.8042207580644[/C][/ROW]
[ROW][C]32[/C][C]4232.9[/C][C]4227.31762104788[/C][C]5.58237895211883[/C][/ROW]
[ROW][C]33[/C][C]4439.5[/C][C]4412.68767112538[/C][C]26.812328874617[/C][/ROW]
[ROW][C]34[/C][C]4545.9[/C][C]4576.10850807725[/C][C]-30.2085080772482[/C][/ROW]
[/TABLE]
Source: https://freestatistics.org/blog/index.php?pk=185330&T=4

Globally Unique Identifier (entire table): ba.freestatistics.org/blog/index.php?pk=185330&T=4

As an alternative you can also use a QR Code:  

The GUIDs for individual cells are displayed in the table below:

Multiple Linear Regression - Actuals, Interpolation, and Residuals
Time or IndexActualsInterpolationForecastResidualsPrediction Error
1393.6345.87520784151147.7247921584893
2410.2367.63378932495842.5662106750416
3433402.02276520311230.9772347968885
4472.4430.99926942710841.4007305728917
5496.9477.37844214914719.521557850853
6540.9525.92012874765314.9798712523468
7581.4556.5680280610124.8319719389899
8612.7604.7351812452157.96481875478521
9662.4647.45690550366514.9430944963347
10720.2688.06318280712332.1368171928772
11769772.476371760903-3.47637176090302
12848.1861.160158858358-13.0601588583577
13945.8982.456856002401-36.6568560024013
141082.41126.39424089802-43.9942408980231
151255.91329.49167353021-73.5916735302122
161421.11519.18105514009-98.0810551400882
171609.51687.67661793239-78.1766179323917
181763.81833.43481299631-69.6348129963123
191888.21923.97559146236-35.7755914623644
202049.62055.6044091403-6.00440914030289
212232.62215.777070729116.8229292708995
222394.22357.1471363797437.0528636202566
232622.62593.9164506669428.6835493330581
242761.52774.72336411585-13.2233641158492
252958.72980.75477067418-22.0547706741777
263198.33142.1146027870156.1853972129948
273303.13310.17287244861-7.0728724486101
283463.93424.8220706658939.0779293341119
293608.83609.22181489179-0.421814891788892
303874.73841.3355791165933.3644208834121
314007.73996.8957792419410.8042207580644
324232.94227.317621047885.58237895211883
334439.54412.6876711253826.812328874617
344545.94576.10850807725-30.2085080772482


Goldfeld-Quandt test for Heteroskedasticity
p-valuesAlternative Hypothesis
breakpoint indexgreater2-sidedless
70.008015533031568390.01603106606313680.991984466968432
80.001499466446295890.002998932892591780.998500533553704
90.0008852083691250330.001770416738250070.999114791630875
100.0008317627034067150.001663525406813430.999168237296593
110.0004692646168102080.0009385292336204150.99953073538319
120.0003071945036903170.0006143890073806340.99969280549631
130.0002362736831713430.0004725473663426860.999763726316829
140.0003841351514430350.0007682703028860690.999615864848557
150.0001447844853225920.0002895689706451840.999855215514677
160.0001247478355543360.0002494956711086730.999875252164446
170.00148821231536880.002976424630737610.998511787684631
180.03602169511921710.07204339023843420.963978304880783
190.1753783959805390.3507567919610780.824621604019461
200.4239513921698150.847902784339630.576048607830185
210.5121728266465030.9756543467069930.487827173353497
220.5065894482039340.9868211035921330.493410551796066
230.5334334573934720.9331330852130550.466566542606528
240.4839682318214460.9679364636428930.516031768178554
250.5355759922878430.9288480154243140.464424007712157
260.9061406555942320.1877186888115350.0938593444057676
270.8435144687712710.3129710624574590.156485531228729

\begin{tabular}{lllllllll}
\hline
Goldfeld-Quandt test for Heteroskedasticity \tabularnewline
p-values & Alternative Hypothesis \tabularnewline
breakpoint index & greater & 2-sided & less \tabularnewline
7 & 0.00801553303156839 & 0.0160310660631368 & 0.991984466968432 \tabularnewline
8 & 0.00149946644629589 & 0.00299893289259178 & 0.998500533553704 \tabularnewline
9 & 0.000885208369125033 & 0.00177041673825007 & 0.999114791630875 \tabularnewline
10 & 0.000831762703406715 & 0.00166352540681343 & 0.999168237296593 \tabularnewline
11 & 0.000469264616810208 & 0.000938529233620415 & 0.99953073538319 \tabularnewline
12 & 0.000307194503690317 & 0.000614389007380634 & 0.99969280549631 \tabularnewline
13 & 0.000236273683171343 & 0.000472547366342686 & 0.999763726316829 \tabularnewline
14 & 0.000384135151443035 & 0.000768270302886069 & 0.999615864848557 \tabularnewline
15 & 0.000144784485322592 & 0.000289568970645184 & 0.999855215514677 \tabularnewline
16 & 0.000124747835554336 & 0.000249495671108673 & 0.999875252164446 \tabularnewline
17 & 0.0014882123153688 & 0.00297642463073761 & 0.998511787684631 \tabularnewline
18 & 0.0360216951192171 & 0.0720433902384342 & 0.963978304880783 \tabularnewline
19 & 0.175378395980539 & 0.350756791961078 & 0.824621604019461 \tabularnewline
20 & 0.423951392169815 & 0.84790278433963 & 0.576048607830185 \tabularnewline
21 & 0.512172826646503 & 0.975654346706993 & 0.487827173353497 \tabularnewline
22 & 0.506589448203934 & 0.986821103592133 & 0.493410551796066 \tabularnewline
23 & 0.533433457393472 & 0.933133085213055 & 0.466566542606528 \tabularnewline
24 & 0.483968231821446 & 0.967936463642893 & 0.516031768178554 \tabularnewline
25 & 0.535575992287843 & 0.928848015424314 & 0.464424007712157 \tabularnewline
26 & 0.906140655594232 & 0.187718688811535 & 0.0938593444057676 \tabularnewline
27 & 0.843514468771271 & 0.312971062457459 & 0.156485531228729 \tabularnewline
\hline
\end{tabular}
%Source: https://freestatistics.org/blog/index.php?pk=185330&T=5

[TABLE]
[ROW][C]Goldfeld-Quandt test for Heteroskedasticity[/C][/ROW]
[ROW][C]p-values[/C][C]Alternative Hypothesis[/C][/ROW]
[ROW][C]breakpoint index[/C][C]greater[/C][C]2-sided[/C][C]less[/C][/ROW]
[ROW][C]7[/C][C]0.00801553303156839[/C][C]0.0160310660631368[/C][C]0.991984466968432[/C][/ROW]
[ROW][C]8[/C][C]0.00149946644629589[/C][C]0.00299893289259178[/C][C]0.998500533553704[/C][/ROW]
[ROW][C]9[/C][C]0.000885208369125033[/C][C]0.00177041673825007[/C][C]0.999114791630875[/C][/ROW]
[ROW][C]10[/C][C]0.000831762703406715[/C][C]0.00166352540681343[/C][C]0.999168237296593[/C][/ROW]
[ROW][C]11[/C][C]0.000469264616810208[/C][C]0.000938529233620415[/C][C]0.99953073538319[/C][/ROW]
[ROW][C]12[/C][C]0.000307194503690317[/C][C]0.000614389007380634[/C][C]0.99969280549631[/C][/ROW]
[ROW][C]13[/C][C]0.000236273683171343[/C][C]0.000472547366342686[/C][C]0.999763726316829[/C][/ROW]
[ROW][C]14[/C][C]0.000384135151443035[/C][C]0.000768270302886069[/C][C]0.999615864848557[/C][/ROW]
[ROW][C]15[/C][C]0.000144784485322592[/C][C]0.000289568970645184[/C][C]0.999855215514677[/C][/ROW]
[ROW][C]16[/C][C]0.000124747835554336[/C][C]0.000249495671108673[/C][C]0.999875252164446[/C][/ROW]
[ROW][C]17[/C][C]0.0014882123153688[/C][C]0.00297642463073761[/C][C]0.998511787684631[/C][/ROW]
[ROW][C]18[/C][C]0.0360216951192171[/C][C]0.0720433902384342[/C][C]0.963978304880783[/C][/ROW]
[ROW][C]19[/C][C]0.175378395980539[/C][C]0.350756791961078[/C][C]0.824621604019461[/C][/ROW]
[ROW][C]20[/C][C]0.423951392169815[/C][C]0.84790278433963[/C][C]0.576048607830185[/C][/ROW]
[ROW][C]21[/C][C]0.512172826646503[/C][C]0.975654346706993[/C][C]0.487827173353497[/C][/ROW]
[ROW][C]22[/C][C]0.506589448203934[/C][C]0.986821103592133[/C][C]0.493410551796066[/C][/ROW]
[ROW][C]23[/C][C]0.533433457393472[/C][C]0.933133085213055[/C][C]0.466566542606528[/C][/ROW]
[ROW][C]24[/C][C]0.483968231821446[/C][C]0.967936463642893[/C][C]0.516031768178554[/C][/ROW]
[ROW][C]25[/C][C]0.535575992287843[/C][C]0.928848015424314[/C][C]0.464424007712157[/C][/ROW]
[ROW][C]26[/C][C]0.906140655594232[/C][C]0.187718688811535[/C][C]0.0938593444057676[/C][/ROW]
[ROW][C]27[/C][C]0.843514468771271[/C][C]0.312971062457459[/C][C]0.156485531228729[/C][/ROW]
[/TABLE]
Source: https://freestatistics.org/blog/index.php?pk=185330&T=5

Globally Unique Identifier (entire table): ba.freestatistics.org/blog/index.php?pk=185330&T=5

As an alternative you can also use a QR Code:  

The GUIDs for individual cells are displayed in the table below:

Goldfeld-Quandt test for Heteroskedasticity
p-valuesAlternative Hypothesis
breakpoint indexgreater2-sidedless
70.008015533031568390.01603106606313680.991984466968432
80.001499466446295890.002998932892591780.998500533553704
90.0008852083691250330.001770416738250070.999114791630875
100.0008317627034067150.001663525406813430.999168237296593
110.0004692646168102080.0009385292336204150.99953073538319
120.0003071945036903170.0006143890073806340.99969280549631
130.0002362736831713430.0004725473663426860.999763726316829
140.0003841351514430350.0007682703028860690.999615864848557
150.0001447844853225920.0002895689706451840.999855215514677
160.0001247478355543360.0002494956711086730.999875252164446
170.00148821231536880.002976424630737610.998511787684631
180.03602169511921710.07204339023843420.963978304880783
190.1753783959805390.3507567919610780.824621604019461
200.4239513921698150.847902784339630.576048607830185
210.5121728266465030.9756543467069930.487827173353497
220.5065894482039340.9868211035921330.493410551796066
230.5334334573934720.9331330852130550.466566542606528
240.4839682318214460.9679364636428930.516031768178554
250.5355759922878430.9288480154243140.464424007712157
260.9061406555942320.1877186888115350.0938593444057676
270.8435144687712710.3129710624574590.156485531228729


Meta Analysis of Goldfeld-Quandt test for Heteroskedasticity
Description# significant tests% significant testsOK/NOK
1% type I error level100.476190476190476NOK
5% type I error level110.523809523809524NOK
10% type I error level120.571428571428571NOK

\begin{tabular}{lllllllll}
\hline
Meta Analysis of Goldfeld-Quandt test for Heteroskedasticity \tabularnewline
Description & # significant tests & % significant tests & OK/NOK \tabularnewline
1% type I error level & 10 & 0.476190476190476 & NOK \tabularnewline
5% type I error level & 11 & 0.523809523809524 & NOK \tabularnewline
10% type I error level & 12 & 0.571428571428571 & NOK \tabularnewline
\hline
\end{tabular}
%Source: https://freestatistics.org/blog/index.php?pk=185330&T=6

[TABLE]
[ROW][C]Meta Analysis of Goldfeld-Quandt test for Heteroskedasticity[/C][/ROW]
[ROW][C]Description[/C][C]# significant tests[/C][C]% significant tests[/C][C]OK/NOK[/C][/ROW]
[ROW][C]1% type I error level[/C][C]10[/C][C]0.476190476190476[/C][C]NOK[/C][/ROW]
[ROW][C]5% type I error level[/C][C]11[/C][C]0.523809523809524[/C][C]NOK[/C][/ROW]
[ROW][C]10% type I error level[/C][C]12[/C][C]0.571428571428571[/C][C]NOK[/C][/ROW]
[/TABLE]
Source: https://freestatistics.org/blog/index.php?pk=185330&T=6

Globally Unique Identifier (entire table): ba.freestatistics.org/blog/index.php?pk=185330&T=6

As an alternative you can also use a QR Code:  

The GUIDs for individual cells are displayed in the table below:

Meta Analysis of Goldfeld-Quandt test for Heteroskedasticity
Description# significant tests% significant testsOK/NOK
1% type I error level100.476190476190476NOK
5% type I error level110.523809523809524NOK
10% type I error level120.571428571428571NOK


Parameters (Session):
par1 = 1 ; par2 = Do not include Seasonal Dummies ; par3 = No Linear Trend ;
Parameters (R input):
par1 = 1 ; par2 = Do not include Seasonal Dummies ; par3 = No Linear Trend ;
R code (references can be found in the software module):
library(lattice)
library(lmtest)
n25 <- 25 #minimum number of obs. for Goldfeld-Quandt test
par1 <- as.numeric(par1)
x <- t(y)
k <- length(x[1,])
n <- length(x[,1])
x1 <- cbind(x[,par1], x[,1:k!=par1])
mycolnames <- c(colnames(x)[par1], colnames(x)[1:k!=par1])
colnames(x1) <- mycolnames #colnames(x)[par1]
x <- x1
if (par3 == 'First Differences'){
x2 <- array(0, dim=c(n-1,k), dimnames=list(1:(n-1), paste('(1-B)',colnames(x),sep='')))
for (i in 1:n-1) {
for (j in 1:k) {
x2[i,j] <- x[i+1,j] - x[i,j]
}
}
x <- x2
}
if (par2 == 'Include Monthly Dummies'){
x2 <- array(0, dim=c(n,11), dimnames=list(1:n, paste('M', seq(1:11), sep ='')))
for (i in 1:11){
x2[seq(i,n,12),i] <- 1
}
x <- cbind(x, x2)
}
if (par2 == 'Include Quarterly Dummies'){
x2 <- array(0, dim=c(n,3), dimnames=list(1:n, paste('Q', seq(1:3), sep ='')))
for (i in 1:3){
x2[seq(i,n,4),i] <- 1
}
x <- cbind(x, x2)
}
k <- length(x[1,])
if (par3 == 'Linear Trend'){
x <- cbind(x, c(1:n))
colnames(x)[k+1] <- 't'
}
x
k <- length(x[1,])
df <- as.data.frame(x)
(mylm <- lm(df))
(mysum <- summary(mylm))
if (n > n25) {
kp3 <- k + 3
nmkm3 <- n - k - 3
gqarr <- array(NA, dim=c(nmkm3-kp3+1,3))
numgqtests <- 0
numsignificant1 <- 0
numsignificant5 <- 0
numsignificant10 <- 0
for (mypoint in kp3:nmkm3) {
j <- 0
numgqtests <- numgqtests + 1
for (myalt in c('greater', 'two.sided', 'less')) {
j <- j + 1
gqarr[mypoint-kp3+1,j] <- gqtest(mylm, point=mypoint, alternative=myalt)$p.value
}
if (gqarr[mypoint-kp3+1,2] < 0.01) numsignificant1 <- numsignificant1 + 1
if (gqarr[mypoint-kp3+1,2] < 0.05) numsignificant5 <- numsignificant5 + 1
if (gqarr[mypoint-kp3+1,2] < 0.10) numsignificant10 <- numsignificant10 + 1
}
gqarr
}
bitmap(file='test0.png')
plot(x[,1], type='l', main='Actuals and Interpolation', ylab='value of Actuals and Interpolation (dots)', xlab='time or index')
points(x[,1]-mysum$resid)
grid()
dev.off()
bitmap(file='test1.png')
plot(mysum$resid, type='b', pch=19, main='Residuals', ylab='value of Residuals', xlab='time or index')
grid()
dev.off()
bitmap(file='test2.png')
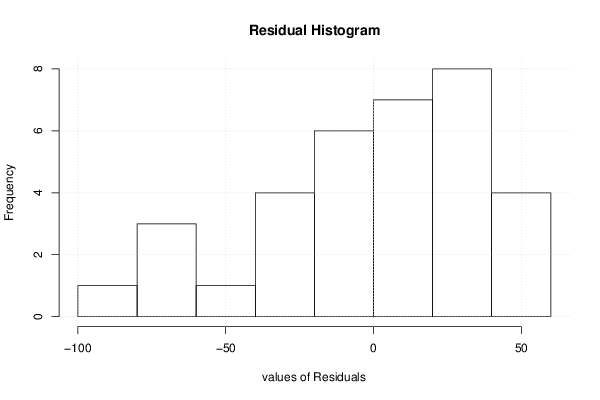
hist(mysum$resid, main='Residual Histogram', xlab='values of Residuals')
grid()
dev.off()
bitmap(file='test3.png')
densityplot(~mysum$resid,col='black',main='Residual Density Plot', xlab='values of Residuals')
dev.off()
bitmap(file='test4.png')
qqnorm(mysum$resid, main='Residual Normal Q-Q Plot')
qqline(mysum$resid)
grid()
dev.off()
(myerror <- as.ts(mysum$resid))
bitmap(file='test5.png')
dum <- cbind(lag(myerror,k=1),myerror)
dum
dum1 <- dum[2:length(myerror),]
dum1
z <- as.data.frame(dum1)
z
plot(z,main=paste('Residual Lag plot, lowess, and regression line'), ylab='values of Residuals', xlab='lagged values of Residuals')
lines(lowess(z))
abline(lm(z))
grid()
dev.off()
bitmap(file='test6.png')
acf(mysum$resid, lag.max=length(mysum$resid)/2, main='Residual Autocorrelation Function')
grid()
dev.off()
bitmap(file='test7.png')
pacf(mysum$resid, lag.max=length(mysum$resid)/2, main='Residual Partial Autocorrelation Function')
grid()
dev.off()
bitmap(file='test8.png')
opar <- par(mfrow = c(2,2), oma = c(0, 0, 1.1, 0))
plot(mylm, las = 1, sub='Residual Diagnostics')
par(opar)
dev.off()
if (n > n25) {
bitmap(file='test9.png')
plot(kp3:nmkm3,gqarr[,2], main='Goldfeld-Quandt test',ylab='2-sided p-value',xlab='breakpoint')
grid()
dev.off()
}
load(file='createtable')
a<-table.start()
a<-table.row.start(a)
a<-table.element(a, 'Multiple Linear Regression - Estimated Regression Equation', 1, TRUE)
a<-table.row.end(a)
myeq <- colnames(x)[1]
myeq <- paste(myeq, '[t] = ', sep='')
for (i in 1:k){
if (mysum$coefficients[i,1] > 0) myeq <- paste(myeq, '+', '')
myeq <- paste(myeq, mysum$coefficients[i,1], sep=' ')
if (rownames(mysum$coefficients)[i] != '(Intercept)') {
myeq <- paste(myeq, rownames(mysum$coefficients)[i], sep='')
if (rownames(mysum$coefficients)[i] != 't') myeq <- paste(myeq, '[t]', sep='')
}
}
myeq <- paste(myeq, ' + e[t]')
a<-table.row.start(a)
a<-table.element(a, myeq)
a<-table.row.end(a)
a<-table.end(a)
table.save(a,file='mytable1.tab')
a<-table.start()
a<-table.row.start(a)
a<-table.element(a,hyperlink('ols1.htm','Multiple Linear Regression - Ordinary Least Squares',''), 6, TRUE)
a<-table.row.end(a)
a<-table.row.start(a)
a<-table.element(a,'Variable',header=TRUE)
a<-table.element(a,'Parameter',header=TRUE)
a<-table.element(a,'S.D.',header=TRUE)
a<-table.element(a,'T-STAT
H0: parameter = 0',header=TRUE)
a<-table.element(a,'2-tail p-value',header=TRUE)
a<-table.element(a,'1-tail p-value',header=TRUE)
a<-table.row.end(a)
for (i in 1:k){
a<-table.row.start(a)
a<-table.element(a,rownames(mysum$coefficients)[i],header=TRUE)
a<-table.element(a,mysum$coefficients[i,1])
a<-table.element(a, round(mysum$coefficients[i,2],6))
a<-table.element(a, round(mysum$coefficients[i,3],4))
a<-table.element(a, round(mysum$coefficients[i,4],6))
a<-table.element(a, round(mysum$coefficients[i,4]/2,6))
a<-table.row.end(a)
}
a<-table.end(a)
table.save(a,file='mytable2.tab')
a<-table.start()
a<-table.row.start(a)
a<-table.element(a, 'Multiple Linear Regression - Regression Statistics', 2, TRUE)
a<-table.row.end(a)
a<-table.row.start(a)
a<-table.element(a, 'Multiple R',1,TRUE)
a<-table.element(a, sqrt(mysum$r.squared))
a<-table.row.end(a)
a<-table.row.start(a)
a<-table.element(a, 'R-squared',1,TRUE)
a<-table.element(a, mysum$r.squared)
a<-table.row.end(a)
a<-table.row.start(a)
a<-table.element(a, 'Adjusted R-squared',1,TRUE)
a<-table.element(a, mysum$adj.r.squared)
a<-table.row.end(a)
a<-table.row.start(a)
a<-table.element(a, 'F-TEST (value)',1,TRUE)
a<-table.element(a, mysum$fstatistic[1])
a<-table.row.end(a)
a<-table.row.start(a)
a<-table.element(a, 'F-TEST (DF numerator)',1,TRUE)
a<-table.element(a, mysum$fstatistic[2])
a<-table.row.end(a)
a<-table.row.start(a)
a<-table.element(a, 'F-TEST (DF denominator)',1,TRUE)
a<-table.element(a, mysum$fstatistic[3])
a<-table.row.end(a)
a<-table.row.start(a)
a<-table.element(a, 'p-value',1,TRUE)
a<-table.element(a, 1-pf(mysum$fstatistic[1],mysum$fstatistic[2],mysum$fstatistic[3]))
a<-table.row.end(a)
a<-table.row.start(a)
a<-table.element(a, 'Multiple Linear Regression - Residual Statistics', 2, TRUE)
a<-table.row.end(a)
a<-table.row.start(a)
a<-table.element(a, 'Residual Standard Deviation',1,TRUE)
a<-table.element(a, mysum$sigma)
a<-table.row.end(a)
a<-table.row.start(a)
a<-table.element(a, 'Sum Squared Residuals',1,TRUE)
a<-table.element(a, sum(myerror*myerror))
a<-table.row.end(a)
a<-table.end(a)
table.save(a,file='mytable3.tab')
a<-table.start()
a<-table.row.start(a)
a<-table.element(a, 'Multiple Linear Regression - Actuals, Interpolation, and Residuals', 4, TRUE)
a<-table.row.end(a)
a<-table.row.start(a)
a<-table.element(a, 'Time or Index', 1, TRUE)
a<-table.element(a, 'Actuals', 1, TRUE)
a<-table.element(a, 'Interpolation
Forecast', 1, TRUE)
a<-table.element(a, 'Residuals
Prediction Error', 1, TRUE)
a<-table.row.end(a)
for (i in 1:n) {
a<-table.row.start(a)
a<-table.element(a,i, 1, TRUE)
a<-table.element(a,x[i])
a<-table.element(a,x[i]-mysum$resid[i])
a<-table.element(a,mysum$resid[i])
a<-table.row.end(a)
}
a<-table.end(a)
table.save(a,file='mytable4.tab')
if (n > n25) {
a<-table.start()
a<-table.row.start(a)
a<-table.element(a,'Goldfeld-Quandt test for Heteroskedasticity',4,TRUE)
a<-table.row.end(a)
a<-table.row.start(a)
a<-table.element(a,'p-values',header=TRUE)
a<-table.element(a,'Alternative Hypothesis',3,header=TRUE)
a<-table.row.end(a)
a<-table.row.start(a)
a<-table.element(a,'breakpoint index',header=TRUE)
a<-table.element(a,'greater',header=TRUE)
a<-table.element(a,'2-sided',header=TRUE)
a<-table.element(a,'less',header=TRUE)
a<-table.row.end(a)
for (mypoint in kp3:nmkm3) {
a<-table.row.start(a)
a<-table.element(a,mypoint,header=TRUE)
a<-table.element(a,gqarr[mypoint-kp3+1,1])
a<-table.element(a,gqarr[mypoint-kp3+1,2])
a<-table.element(a,gqarr[mypoint-kp3+1,3])
a<-table.row.end(a)
}
a<-table.end(a)
table.save(a,file='mytable5.tab')
a<-table.start()
a<-table.row.start(a)
a<-table.element(a,'Meta Analysis of Goldfeld-Quandt test for Heteroskedasticity',4,TRUE)
a<-table.row.end(a)
a<-table.row.start(a)
a<-table.element(a,'Description',header=TRUE)
a<-table.element(a,'# significant tests',header=TRUE)
a<-table.element(a,'% significant tests',header=TRUE)
a<-table.element(a,'OK/NOK',header=TRUE)
a<-table.row.end(a)
a<-table.row.start(a)
a<-table.element(a,'1% type I error level',header=TRUE)
a<-table.element(a,numsignificant1)
a<-table.element(a,numsignificant1/numgqtests)
if (numsignificant1/numgqtests < 0.01) dum <- 'OK' else dum <- 'NOK'
a<-table.element(a,dum)
a<-table.row.end(a)
a<-table.row.start(a)
a<-table.element(a,'5% type I error level',header=TRUE)
a<-table.element(a,numsignificant5)
a<-table.element(a,numsignificant5/numgqtests)
if (numsignificant5/numgqtests < 0.05) dum <- 'OK' else dum <- 'NOK'
a<-table.element(a,dum)
a<-table.row.end(a)
a<-table.row.start(a)
a<-table.element(a,'10% type I error level',header=TRUE)
a<-table.element(a,numsignificant10)
a<-table.element(a,numsignificant10/numgqtests)
if (numsignificant10/numgqtests < 0.1) dum <- 'OK' else dum <- 'NOK'
a<-table.element(a,dum)
a<-table.row.end(a)
a<-table.end(a)
table.save(a,file='mytable6.tab')
}