Free Statistics
of Irreproducible Research!
Description of Statistical Computation | |||||||||||||||||||||||||||||||||||||||||
|---|---|---|---|---|---|---|---|---|---|---|---|---|---|---|---|---|---|---|---|---|---|---|---|---|---|---|---|---|---|---|---|---|---|---|---|---|---|---|---|---|---|
| Author's title | |||||||||||||||||||||||||||||||||||||||||
| Author | *Unverified author* | ||||||||||||||||||||||||||||||||||||||||
| R Software Module | rwasp_univariatedataseries.wasp | ||||||||||||||||||||||||||||||||||||||||
| Title produced by software | Univariate Data Series | ||||||||||||||||||||||||||||||||||||||||
| Date of computation | Thu, 20 Sep 2012 09:23:07 -0400 | ||||||||||||||||||||||||||||||||||||||||
| Cite this page as follows | Statistical Computations at FreeStatistics.org, Office for Research Development and Education, URL https://freestatistics.org/blog/index.php?v=date/2012/Sep/20/t13481474341xss8sjtngttx1e.htm/, Retrieved Sun, 28 Apr 2024 04:45:23 +0000 | ||||||||||||||||||||||||||||||||||||||||
| Statistical Computations at FreeStatistics.org, Office for Research Development and Education, URL https://freestatistics.org/blog/index.php?pk=169663, Retrieved Sun, 28 Apr 2024 04:45:23 +0000 | |||||||||||||||||||||||||||||||||||||||||
| QR Codes: | |||||||||||||||||||||||||||||||||||||||||
|
| |||||||||||||||||||||||||||||||||||||||||
| Original text written by user: | |||||||||||||||||||||||||||||||||||||||||
| IsPrivate? | No (this computation is public) | ||||||||||||||||||||||||||||||||||||||||
| User-defined keywords | |||||||||||||||||||||||||||||||||||||||||
| Estimated Impact | 150 | ||||||||||||||||||||||||||||||||||||||||
Tree of Dependent Computations | |||||||||||||||||||||||||||||||||||||||||
| Family? (F = Feedback message, R = changed R code, M = changed R Module, P = changed Parameters, D = changed Data) | |||||||||||||||||||||||||||||||||||||||||
| - [Univariate Data Series] [] [2012-09-20 13:23:07] [a14baeeafb42bd31c8e1f231a0a4996d] [Current] - RMPD [Histogram] [] [2012-10-07 16:56:20] [018035fb0d4285098cb1e31787361d70] - RMPD [Histogram] [] [2012-10-07 17:02:56] [018035fb0d4285098cb1e31787361d70] - RMPD [Histogram] [] [2012-10-07 17:05:59] [018035fb0d4285098cb1e31787361d70] - RMPD [Histogram] [] [2012-10-07 17:11:33] [018035fb0d4285098cb1e31787361d70] - RMPD [Kernel Density Estimation] [] [2012-10-07 17:16:57] [018035fb0d4285098cb1e31787361d70] | |||||||||||||||||||||||||||||||||||||||||
| Feedback Forum | |||||||||||||||||||||||||||||||||||||||||
Post a new message | |||||||||||||||||||||||||||||||||||||||||
Dataset | |||||||||||||||||||||||||||||||||||||||||
| Dataseries X: | |||||||||||||||||||||||||||||||||||||||||
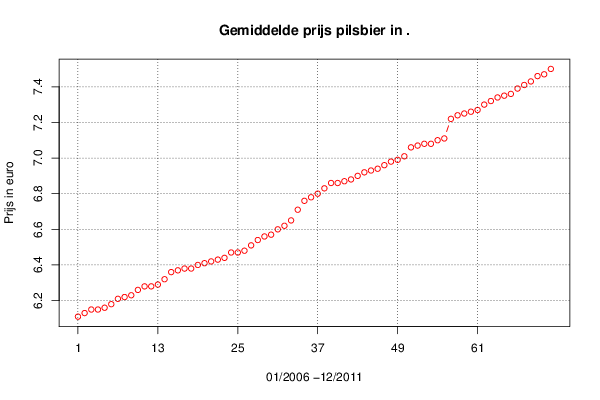
6,11 6,13 6,15 6,15 6,16 6,18 6,21 6,22 6,23 6,26 6,28 6,28 6,29 6,32 6,36 6,37 6,38 6,38 6,4 6,41 6,42 6,43 6,44 6,47 6,47 6,48 6,51 6,54 6,56 6,57 6,6 6,62 6,65 6,71 6,76 6,78 6,8 6,83 6,86 6,86 6,87 6,88 6,9 6,92 6,93 6,94 6,96 6,98 6,99 7,01 7,06 7,07 7,08 7,08 7,1 7,11 7,22 7,24 7,25 7,26 7,27 7,3 7,32 7,34 7,35 7,36 7,39 7,41 7,43 7,46 7,47 7,5 | |||||||||||||||||||||||||||||||||||||||||
Tables (Output of Computation) | |||||||||||||||||||||||||||||||||||||||||
| |||||||||||||||||||||||||||||||||||||||||
Figures (Output of Computation) | |||||||||||||||||||||||||||||||||||||||||
Input Parameters & R Code | |||||||||||||||||||||||||||||||||||||||||
| Parameters (Session): | |||||||||||||||||||||||||||||||||||||||||
| par1 = Gemiddelde prijs pilsbier in � ; par2 = Belgostat ; par3 = Gemiddelde prijs pilsbier in � 2006-2011 ; par4 = 12 ; | |||||||||||||||||||||||||||||||||||||||||
| Parameters (R input): | |||||||||||||||||||||||||||||||||||||||||
| par1 = Gemiddelde prijs pilsbier in � ; par2 = Belgostat ; par3 = Gemiddelde prijs pilsbier in � 2006-2011 ; par4 = 12 ; | |||||||||||||||||||||||||||||||||||||||||
| R code (references can be found in the software module): | |||||||||||||||||||||||||||||||||||||||||
par4 <- '12' | |||||||||||||||||||||||||||||||||||||||||