Free Statistics
of Irreproducible Research!
Description of Statistical Computation | |||||||||||||||||||||||||||||||||||||||||
|---|---|---|---|---|---|---|---|---|---|---|---|---|---|---|---|---|---|---|---|---|---|---|---|---|---|---|---|---|---|---|---|---|---|---|---|---|---|---|---|---|---|
| Author's title | |||||||||||||||||||||||||||||||||||||||||
| Author | *Unverified author* | ||||||||||||||||||||||||||||||||||||||||
| R Software Module | rwasp_univariatedataseries.wasp | ||||||||||||||||||||||||||||||||||||||||
| Title produced by software | Univariate Data Series | ||||||||||||||||||||||||||||||||||||||||
| Date of computation | Thu, 20 Sep 2012 16:34:03 -0400 | ||||||||||||||||||||||||||||||||||||||||
| Cite this page as follows | Statistical Computations at FreeStatistics.org, Office for Research Development and Education, URL https://freestatistics.org/blog/index.php?v=date/2012/Sep/20/t13481732711546uyvrl99yhf4.htm/, Retrieved Sun, 28 Apr 2024 12:56:24 +0000 | ||||||||||||||||||||||||||||||||||||||||
| Statistical Computations at FreeStatistics.org, Office for Research Development and Education, URL https://freestatistics.org/blog/index.php?pk=169676, Retrieved Sun, 28 Apr 2024 12:56:24 +0000 | |||||||||||||||||||||||||||||||||||||||||
| QR Codes: | |||||||||||||||||||||||||||||||||||||||||
|
| |||||||||||||||||||||||||||||||||||||||||
| Original text written by user: | |||||||||||||||||||||||||||||||||||||||||
| IsPrivate? | No (this computation is public) | ||||||||||||||||||||||||||||||||||||||||
| User-defined keywords | |||||||||||||||||||||||||||||||||||||||||
| Estimated Impact | 166 | ||||||||||||||||||||||||||||||||||||||||
Tree of Dependent Computations | |||||||||||||||||||||||||||||||||||||||||
| Family? (F = Feedback message, R = changed R code, M = changed R Module, P = changed Parameters, D = changed Data) | |||||||||||||||||||||||||||||||||||||||||
| - [Univariate Data Series] [Prijs pilsbier] [2012-09-20 13:13:24] [cd2f6c0e81d940a0d2cea5d0c6c3ba28] - R PD [Univariate Data Series] [Prijs pilsbier] [2012-09-20 20:34:03] [d41d8cd98f00b204e9800998ecf8427e] [Current] | |||||||||||||||||||||||||||||||||||||||||
| Feedback Forum | |||||||||||||||||||||||||||||||||||||||||
Post a new message | |||||||||||||||||||||||||||||||||||||||||
Dataset | |||||||||||||||||||||||||||||||||||||||||
| Dataseries X: | |||||||||||||||||||||||||||||||||||||||||
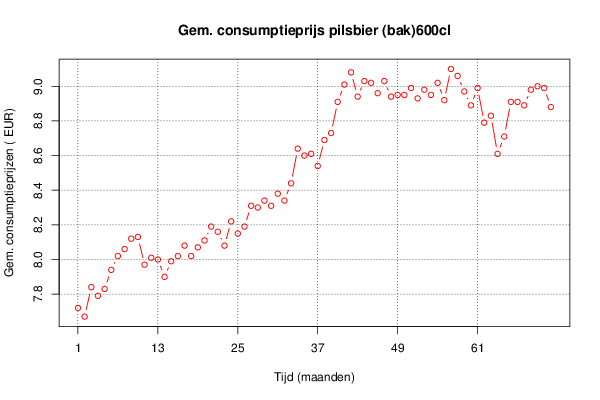
7.72 7.67 7.84 7.79 7.83 7.94 8.02 8.06 8.12 8.13 7.97 8.01 8 7.9 7.99 8.02 8.08 8.02 8.07 8.11 8.19 8.16 8.08 8.22 8.15 8.19 8.31 8.3 8.34 8.31 8.38 8.34 8.44 8.64 8.6 8.61 8.54 8.69 8.73 8.91 9.01 9.08 8.94 9.03 9.02 8.96 9.03 8.94 8.95 8.95 8.99 8.93 8.98 8.95 9.02 8.92 9.1 9.06 8.97 8.89 8.99 8.79 8.83 8.61 8.71 8.91 8.91 8.89 8.98 9 8.99 8.88 | |||||||||||||||||||||||||||||||||||||||||
Tables (Output of Computation) | |||||||||||||||||||||||||||||||||||||||||
| |||||||||||||||||||||||||||||||||||||||||
Figures (Output of Computation) | |||||||||||||||||||||||||||||||||||||||||
Input Parameters & R Code | |||||||||||||||||||||||||||||||||||||||||
| Parameters (Session): | |||||||||||||||||||||||||||||||||||||||||
| par1 = Gemiddelde consumptieprijzen Pilsbier (bak) 600cl ; par2 = http://www.nbb.be/belgostat/PresentationLinker?Order=true&TableId=696000054&Lang=N&prop=null ; par3 = Het is een tabel met gegevens van de gemiddelde consumptieprijs van pilsbier (bak) van 600 cl ; par4 = 12 ; | |||||||||||||||||||||||||||||||||||||||||
| Parameters (R input): | |||||||||||||||||||||||||||||||||||||||||
| par1 = Gemiddelde consumptieprijzen Pilsbier (bak) 600cl ; par2 = http://www.nbb.be/belgostat/PresentationLinker?Order=true&TableId=696000054&Lang=N&prop=null ; par3 = Het is een tabel met gegevens van de gemiddelde consumptieprijs van pilsbier (bak) van 600 cl ; par4 = 12 ; | |||||||||||||||||||||||||||||||||||||||||
| R code (references can be found in the software module): | |||||||||||||||||||||||||||||||||||||||||
if (par4 != 'No season') { | |||||||||||||||||||||||||||||||||||||||||